


Arne Slot Was Right About Refs, and Man United Suffer Similar Unfairness To Liverpool
In case anyone thinks this is self-interest!

I think I’ve finally cracked this mystery, and this will prove Arne Slot’s point.
If he was wrong to confront the increasingly awful Michael Oliver in the manner he did, he was right to be annoyed, and the data backs not Oliver, but Slot.
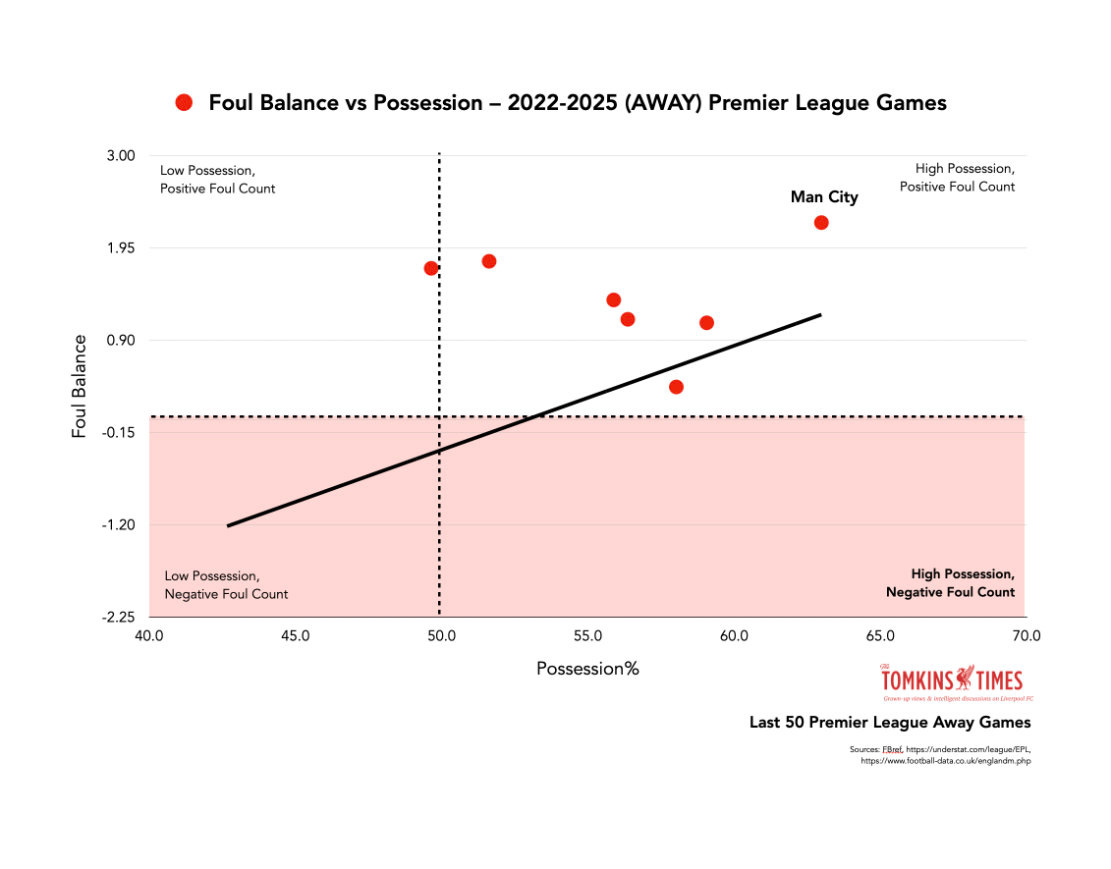
Look at this graph below and tell me which red dot is Liverpool:
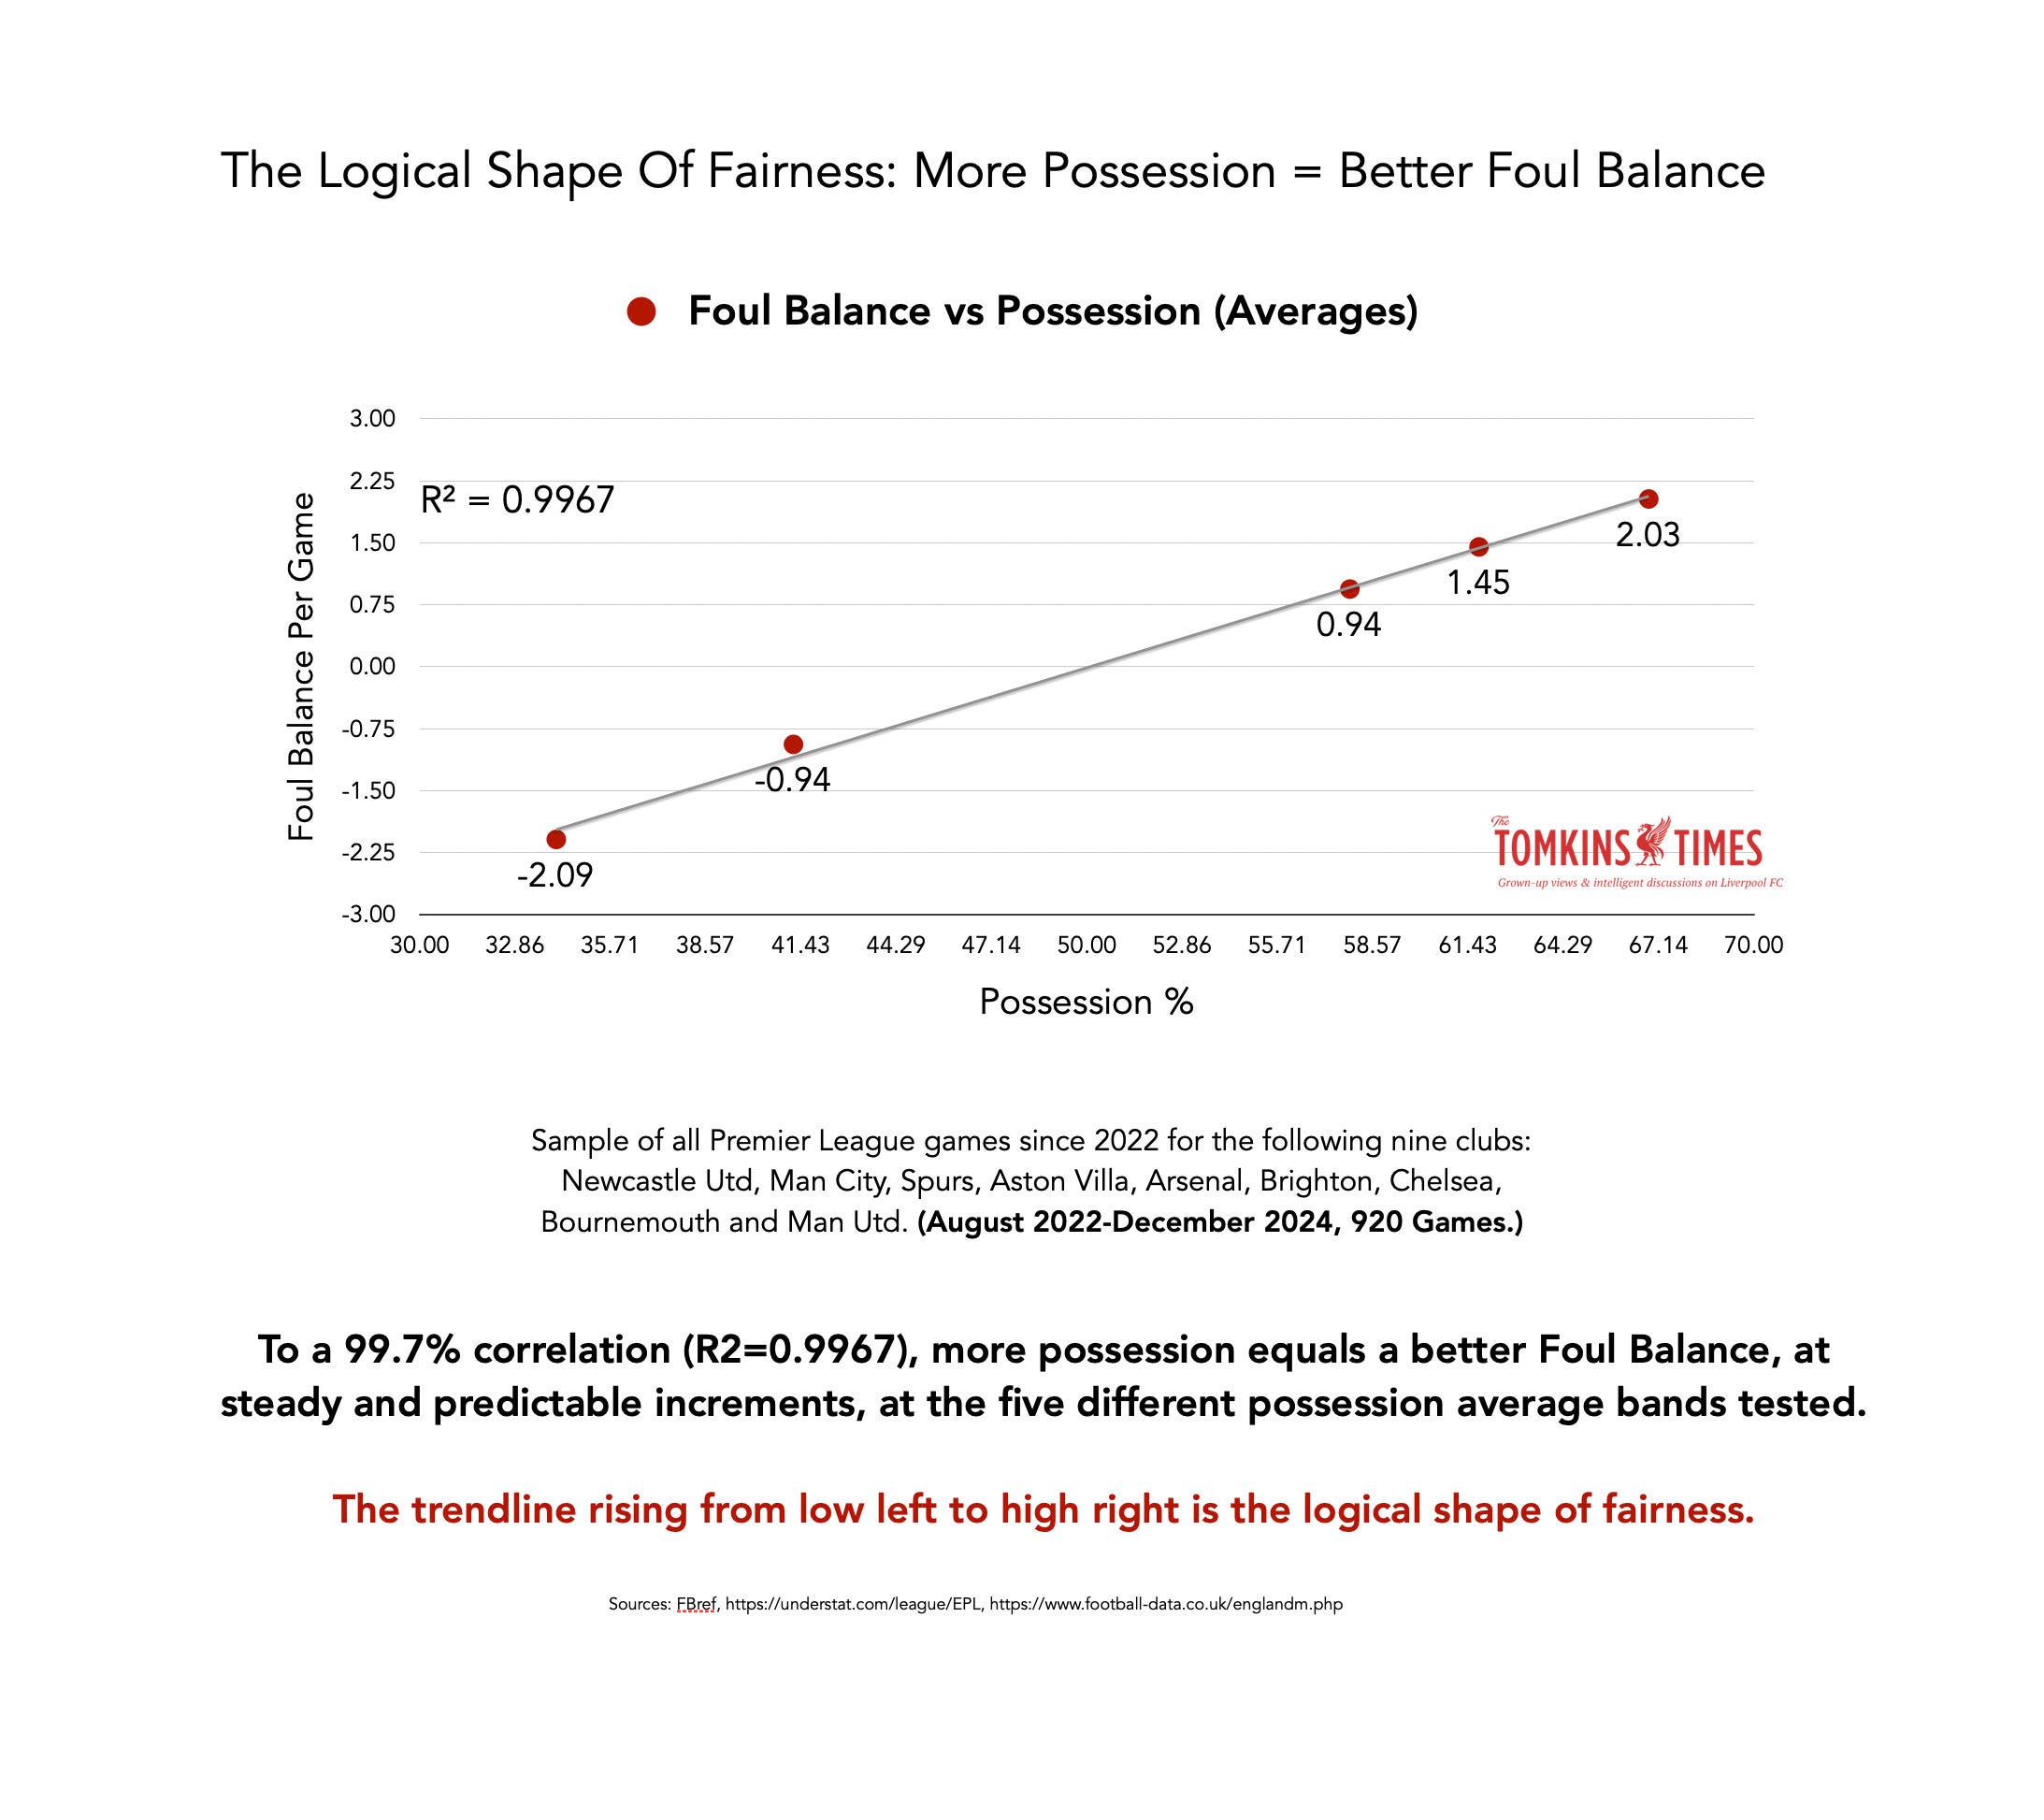
To help, the graph below details ‘The Logical Shape Of Fairness: More Possession = Better Foul Balance’ to a 99.7% correlation. (There’s a similar trend with xG Difference, but not quite the same correlation.)
As I’ve said before, up and to the right. More possession, the more Foul Balance rises in a team’s favour. To almost a 100% certainty over a larger sample size (920 games).
So again, from the top graph, which one is Liverpool? This is the possession vs Foul Balance in away league games since 2022, which is over 50 games each.
Of course, the whole point is that they are off the chart.
In a bad way. Below the chart.
Just like Man United, even if Man United are less off the chart in terms of being closer to the trendline. But both appear below the cutoff point. (Full chart appears later in the piece.)
Liverpool and Man United play very different styles of football to differing levels of success, so is this a Giant Two tax? While their Foul Balances are worse than expected at home, away they are absolutely annihilated.
While Man City claim great riches and popularity, despite no one buying their shirts, the two most successful and popular English teams are Liverpool and Manchester United.
(“For all their recent success on the pitch, Manchester City remain outside the top ten clubs and their kit and merchandising income of €76 million was 9 per cent of their revenue last year, the smallest percentage of the top 20 clubs. Five English clubs make the kit and merchandising top ten, with Manchester United and Liverpool earning €146 million. Arsenal (€120 million) and Tottenham Hotspur (€96 million) have overtaken Chelsea (€95 million).”)
Of course, as the two most successful and popular English teams, that also makes them to two most unpopular teams.
So let me explain, in my most concise and hopefully final article on this issue.
First, any Foul Balance discrepancy is not down to Liverpool’s pressing style, and nor are Liverpool a dirty team who make lots of fouls.
These are the two counter claims I’ve faced the most since focusing on Foul Balance.
These can be firmly laid to rest here.
Fouls Committed vs Pressing Intensity (PPDA) – Premier League 2022-2025
The lower the PPDA, the more a team is said to press; and in this graph, the hard-pressers are on the left. (It’s because of the confusing nature that a lower PPDA means an increase in pressing intensity, so the logical reading is inverted.)
Let’s look at the average PPDA and Fouls Made since 2022, so just over 100 games each.
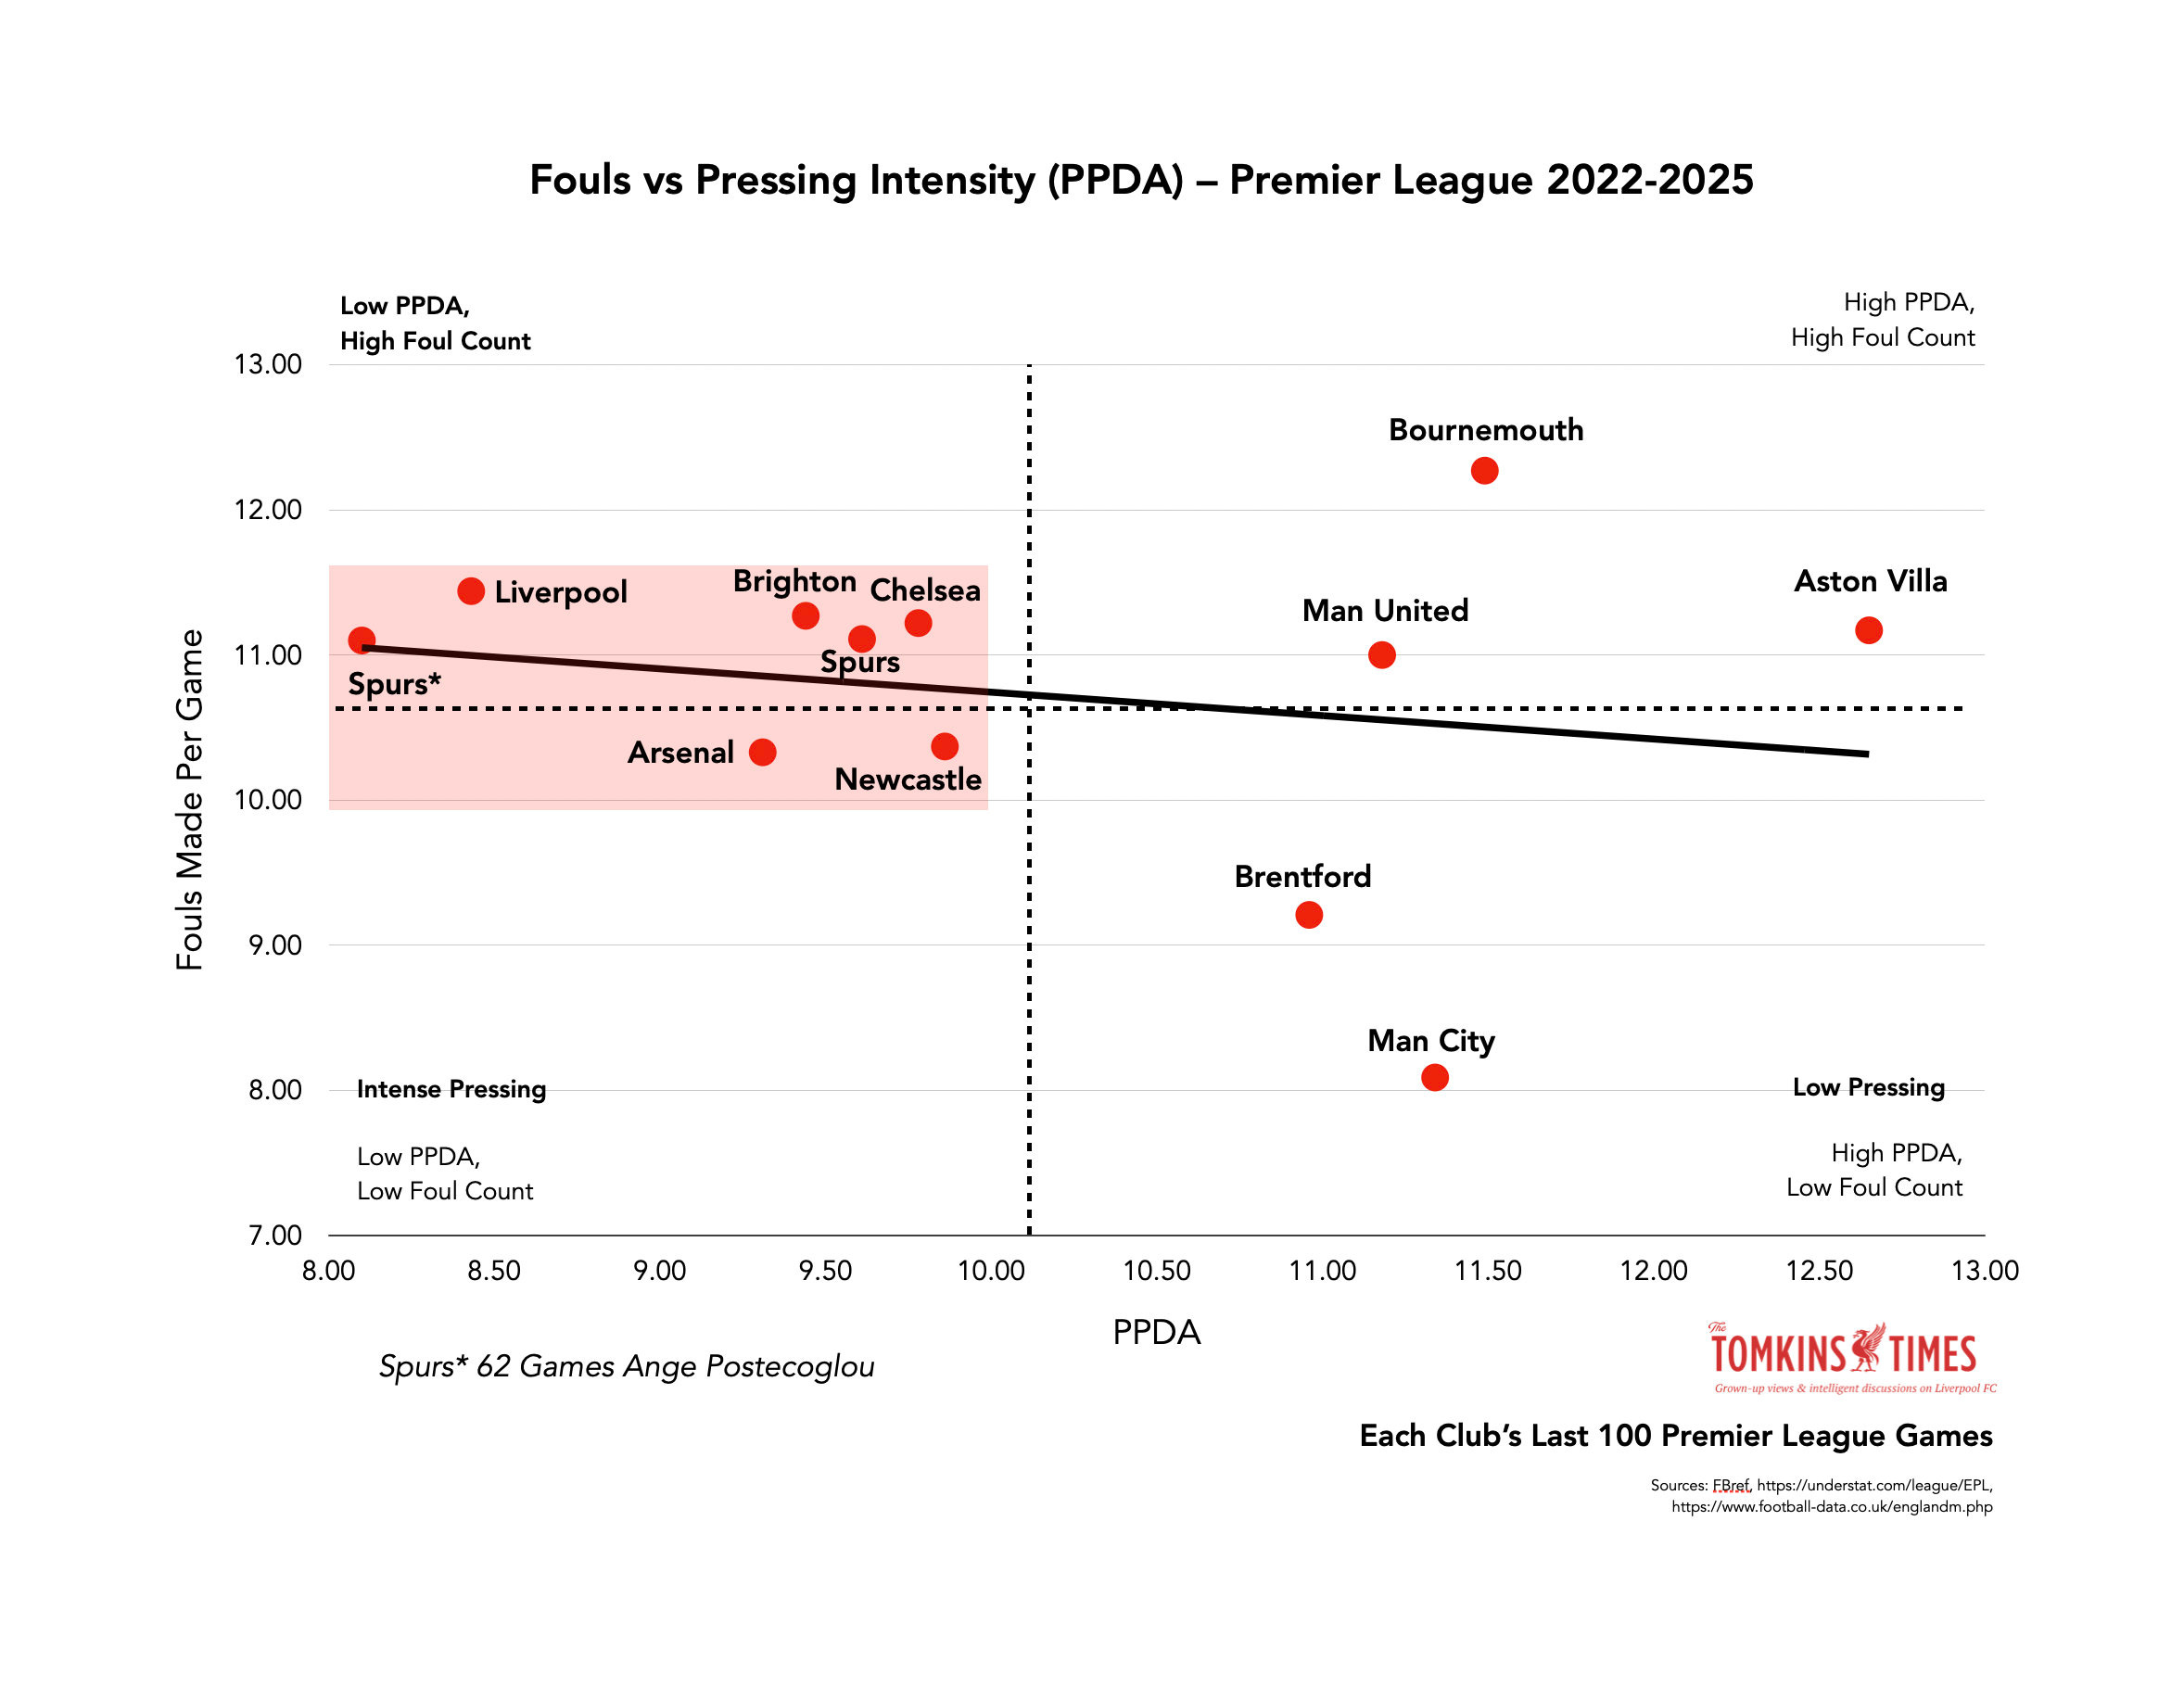
The highlighted teams in the red box are all hard-pressing teams, and there is no great difference in fouls made.
On average, beyond a tiny amount, pressing does not seem to equal a greater foul threat, especially as high-pressing teams will also spend a lot more time in possession, on average.
Of the seven hard-pressing teams, including Spurs twice (once overall, and once in the 62 league games under Ange Postecoglou given how extreme his team is), the difference in fouls is around 1.1 (minimum of 10.37 and maximum of 11.44), with Liverpool not the hardest pressers – that’s Spurs since 2023 – but the team penalised the most.
However, this is not by some outlying amount. It’s annoying, but it’s not outrageous.
The five teams on the right of the chart who press less than the average of 10.57 are not clustered together.
Brentford
Man Utd
Man City
Bournemouth
Aston Villa
These average out at 10.35 fouls committed per game, so not that much different from the pressing teams, other than the pressing teams are clustered together, and the non-pressing teams are spread out above, below and level with the pressing sides.
So while Liverpool are penalised a bit more than expected in relation to pressing, it’s not outlandish. And hard pressing is perhaps going to cost a team only half a foul per game, on average.
The issue is how few free-kicks Liverpool are given, compared to almost everyone else, and compared to all good teams.
This is where Man United are also penalised, and it seems to me that when Liverpool and Man United go away from home, in particular, home fans will badger the refs, or the refs will feel a need to show that they are not swayed by the English game’s Giant Two.
Irrespective of quality, game dominance and possession, these are the outright foul numbers, won and conceded, home and away. Since 2022, Man City have been the best team with the most possession, albeit Liverpool have not been far behind given the gulf this season. (Don’t ask me what Aston Villa’s secret is.)

Now let’s put that into context.
Liverpool Treated Horribly Away From Home
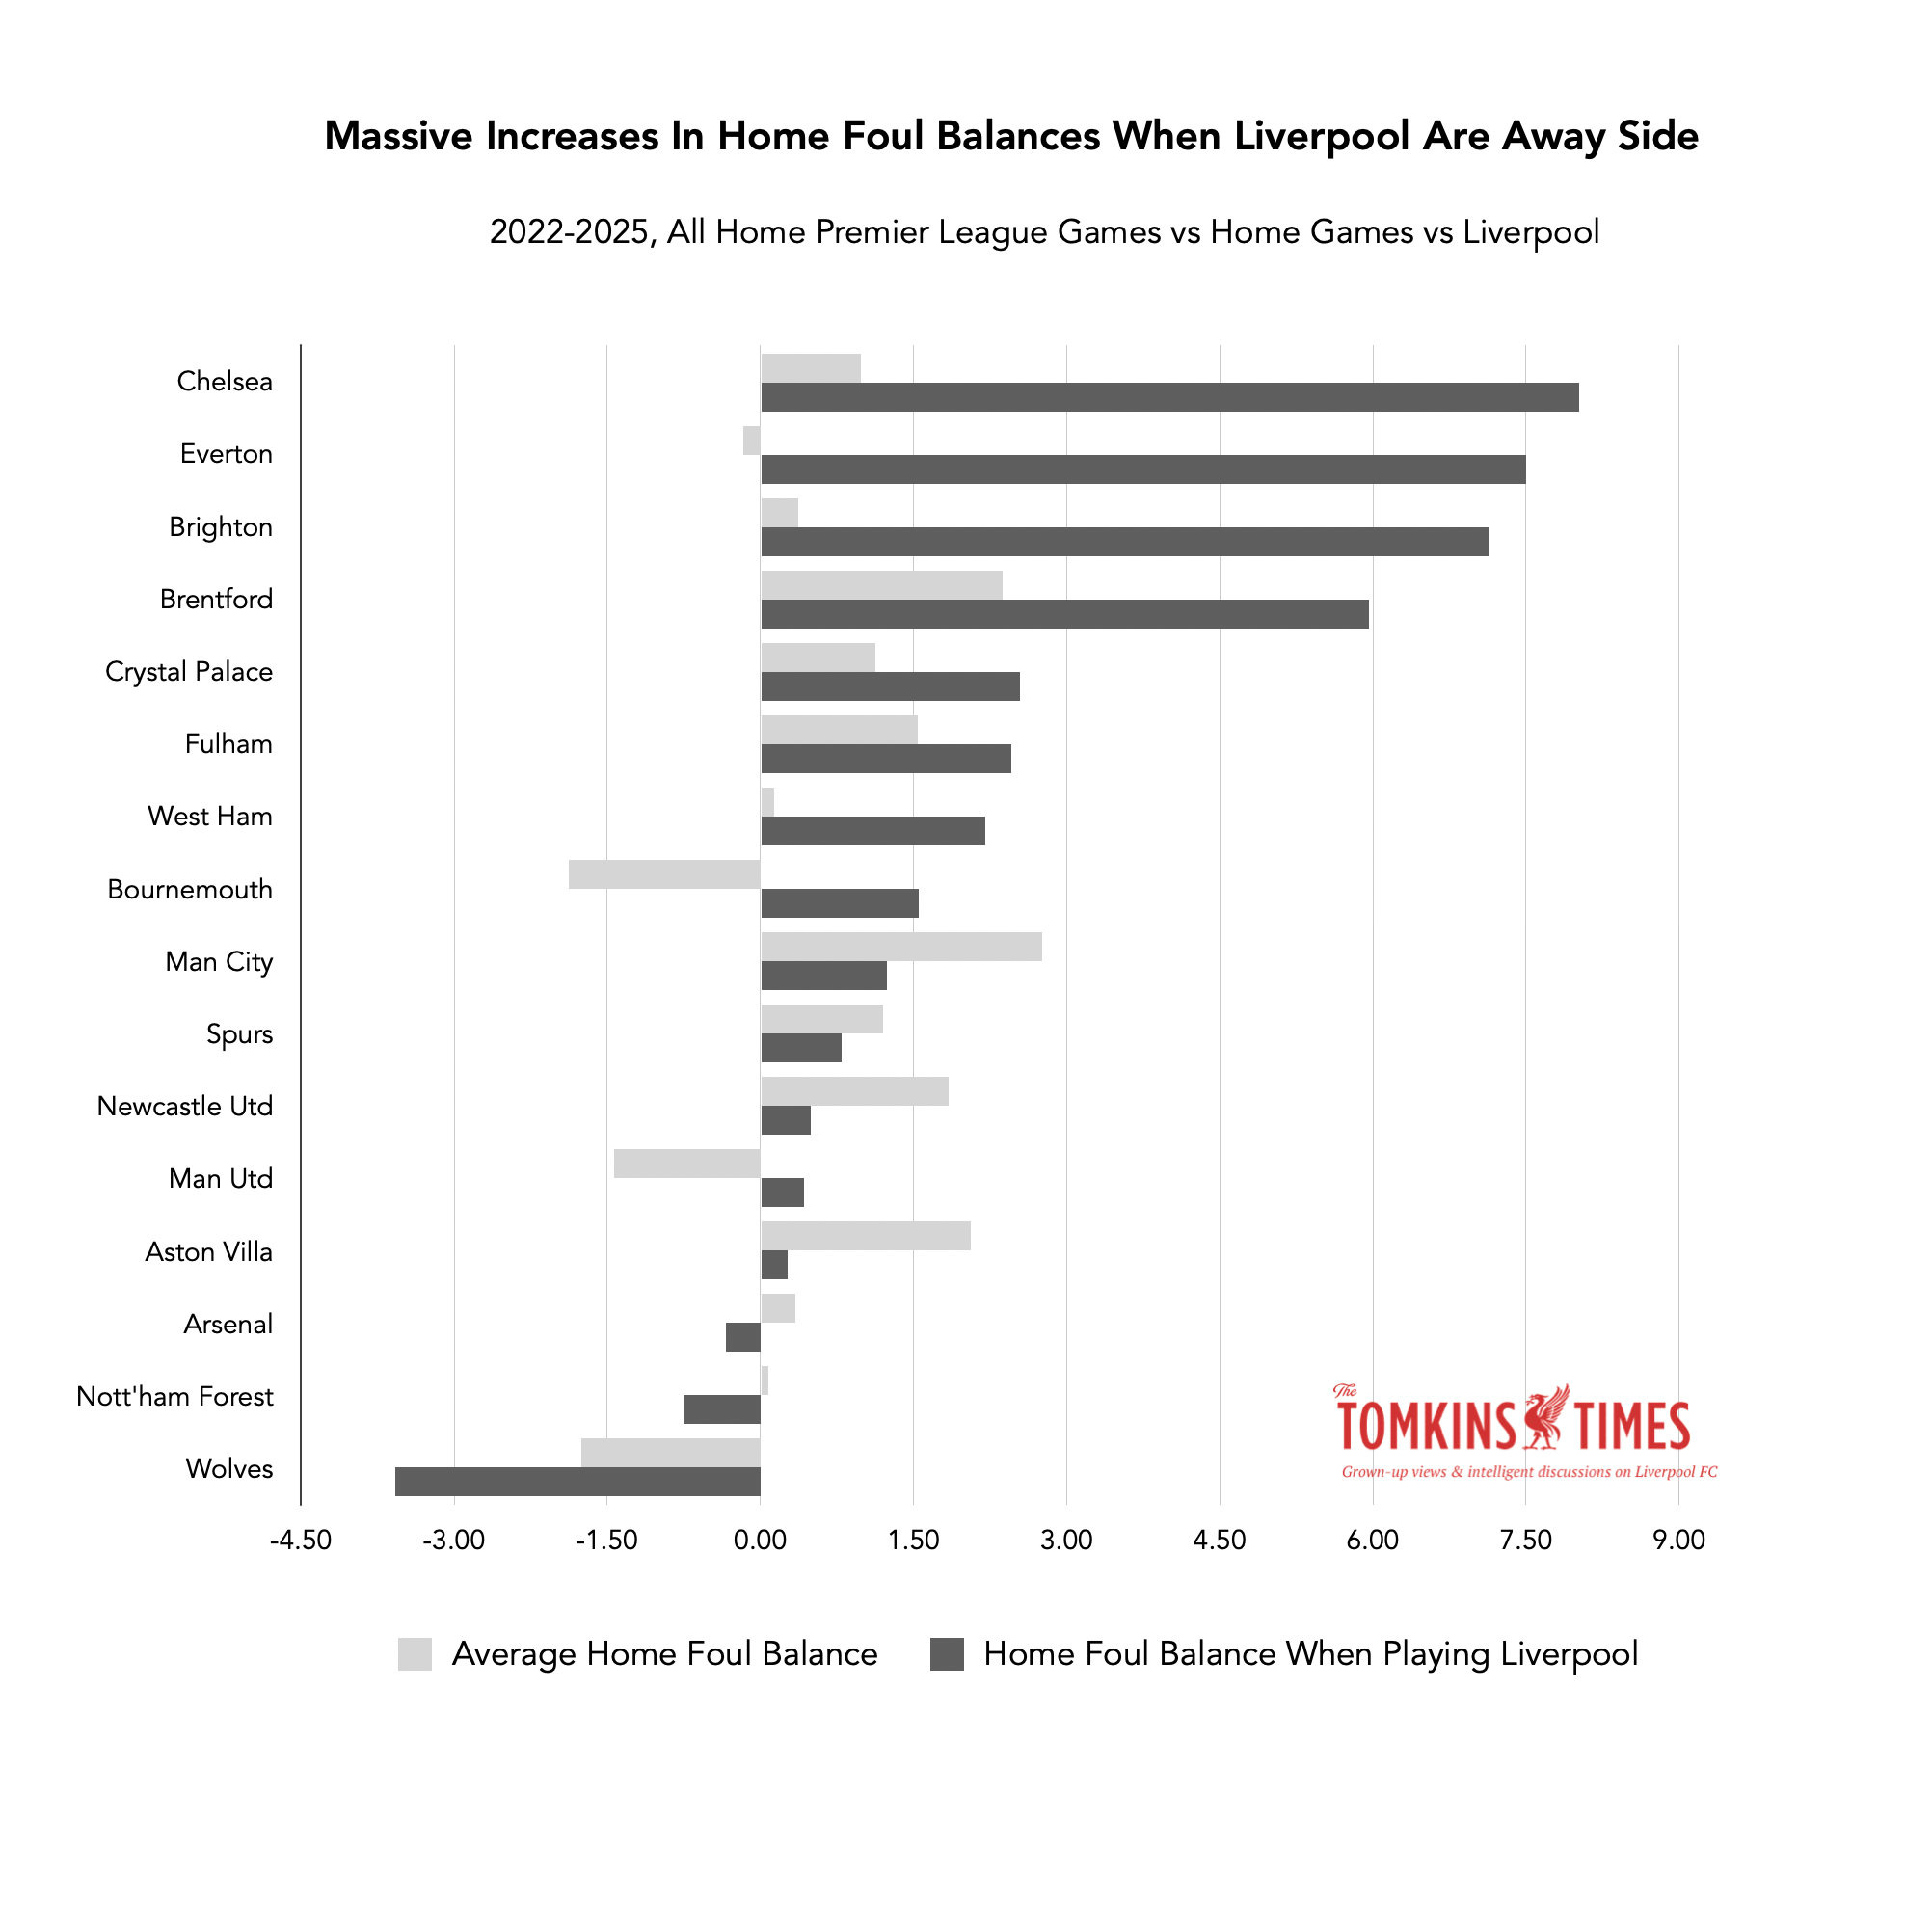
As you might expect, every single team has less possession in their three home games against Liverpool since 2022 than their average home possession share in the rest of their games.
On average, they have nearly 9% less possession, yet win 2.25 more home free-kicks per game against Liverpool than the average of all other home games.
Everton average -9.29% less possession at Goodison versus Liverpool compared to other visitors, but win an astonishing 7.5 more free-kicks per game than the Reds in the last three Mersey derbies there.
Liverpool do poorly for free-kicks at Stamford Bridge too, but not in relation to possession, as it is only one of four grounds where the Reds have been bossed on that metric since 2022, with the four opponents being Man City, Chelsea, Spurs and Brighton. (Chelsea and Brighton are only two games in the sample, as the Reds have to go there again this season, as part of only four remaining away fixtures.)
Many of these teams are hard-pressing, such as Brighton, Spurs, Arsenal and Newcastle.
Arsenal, Notts Forest and Wolves are the only three grounds where the home team gets a worse Foul Balance than normal, two of them by minimal amounts; meaning that it’s only against Wolves where the Reds do well for free-kicks.
When you make some adjustments for possession (very high possession averages +2 on Foul Balance, very low possession averages -2 on Foul Balance), this is how the graph looks:
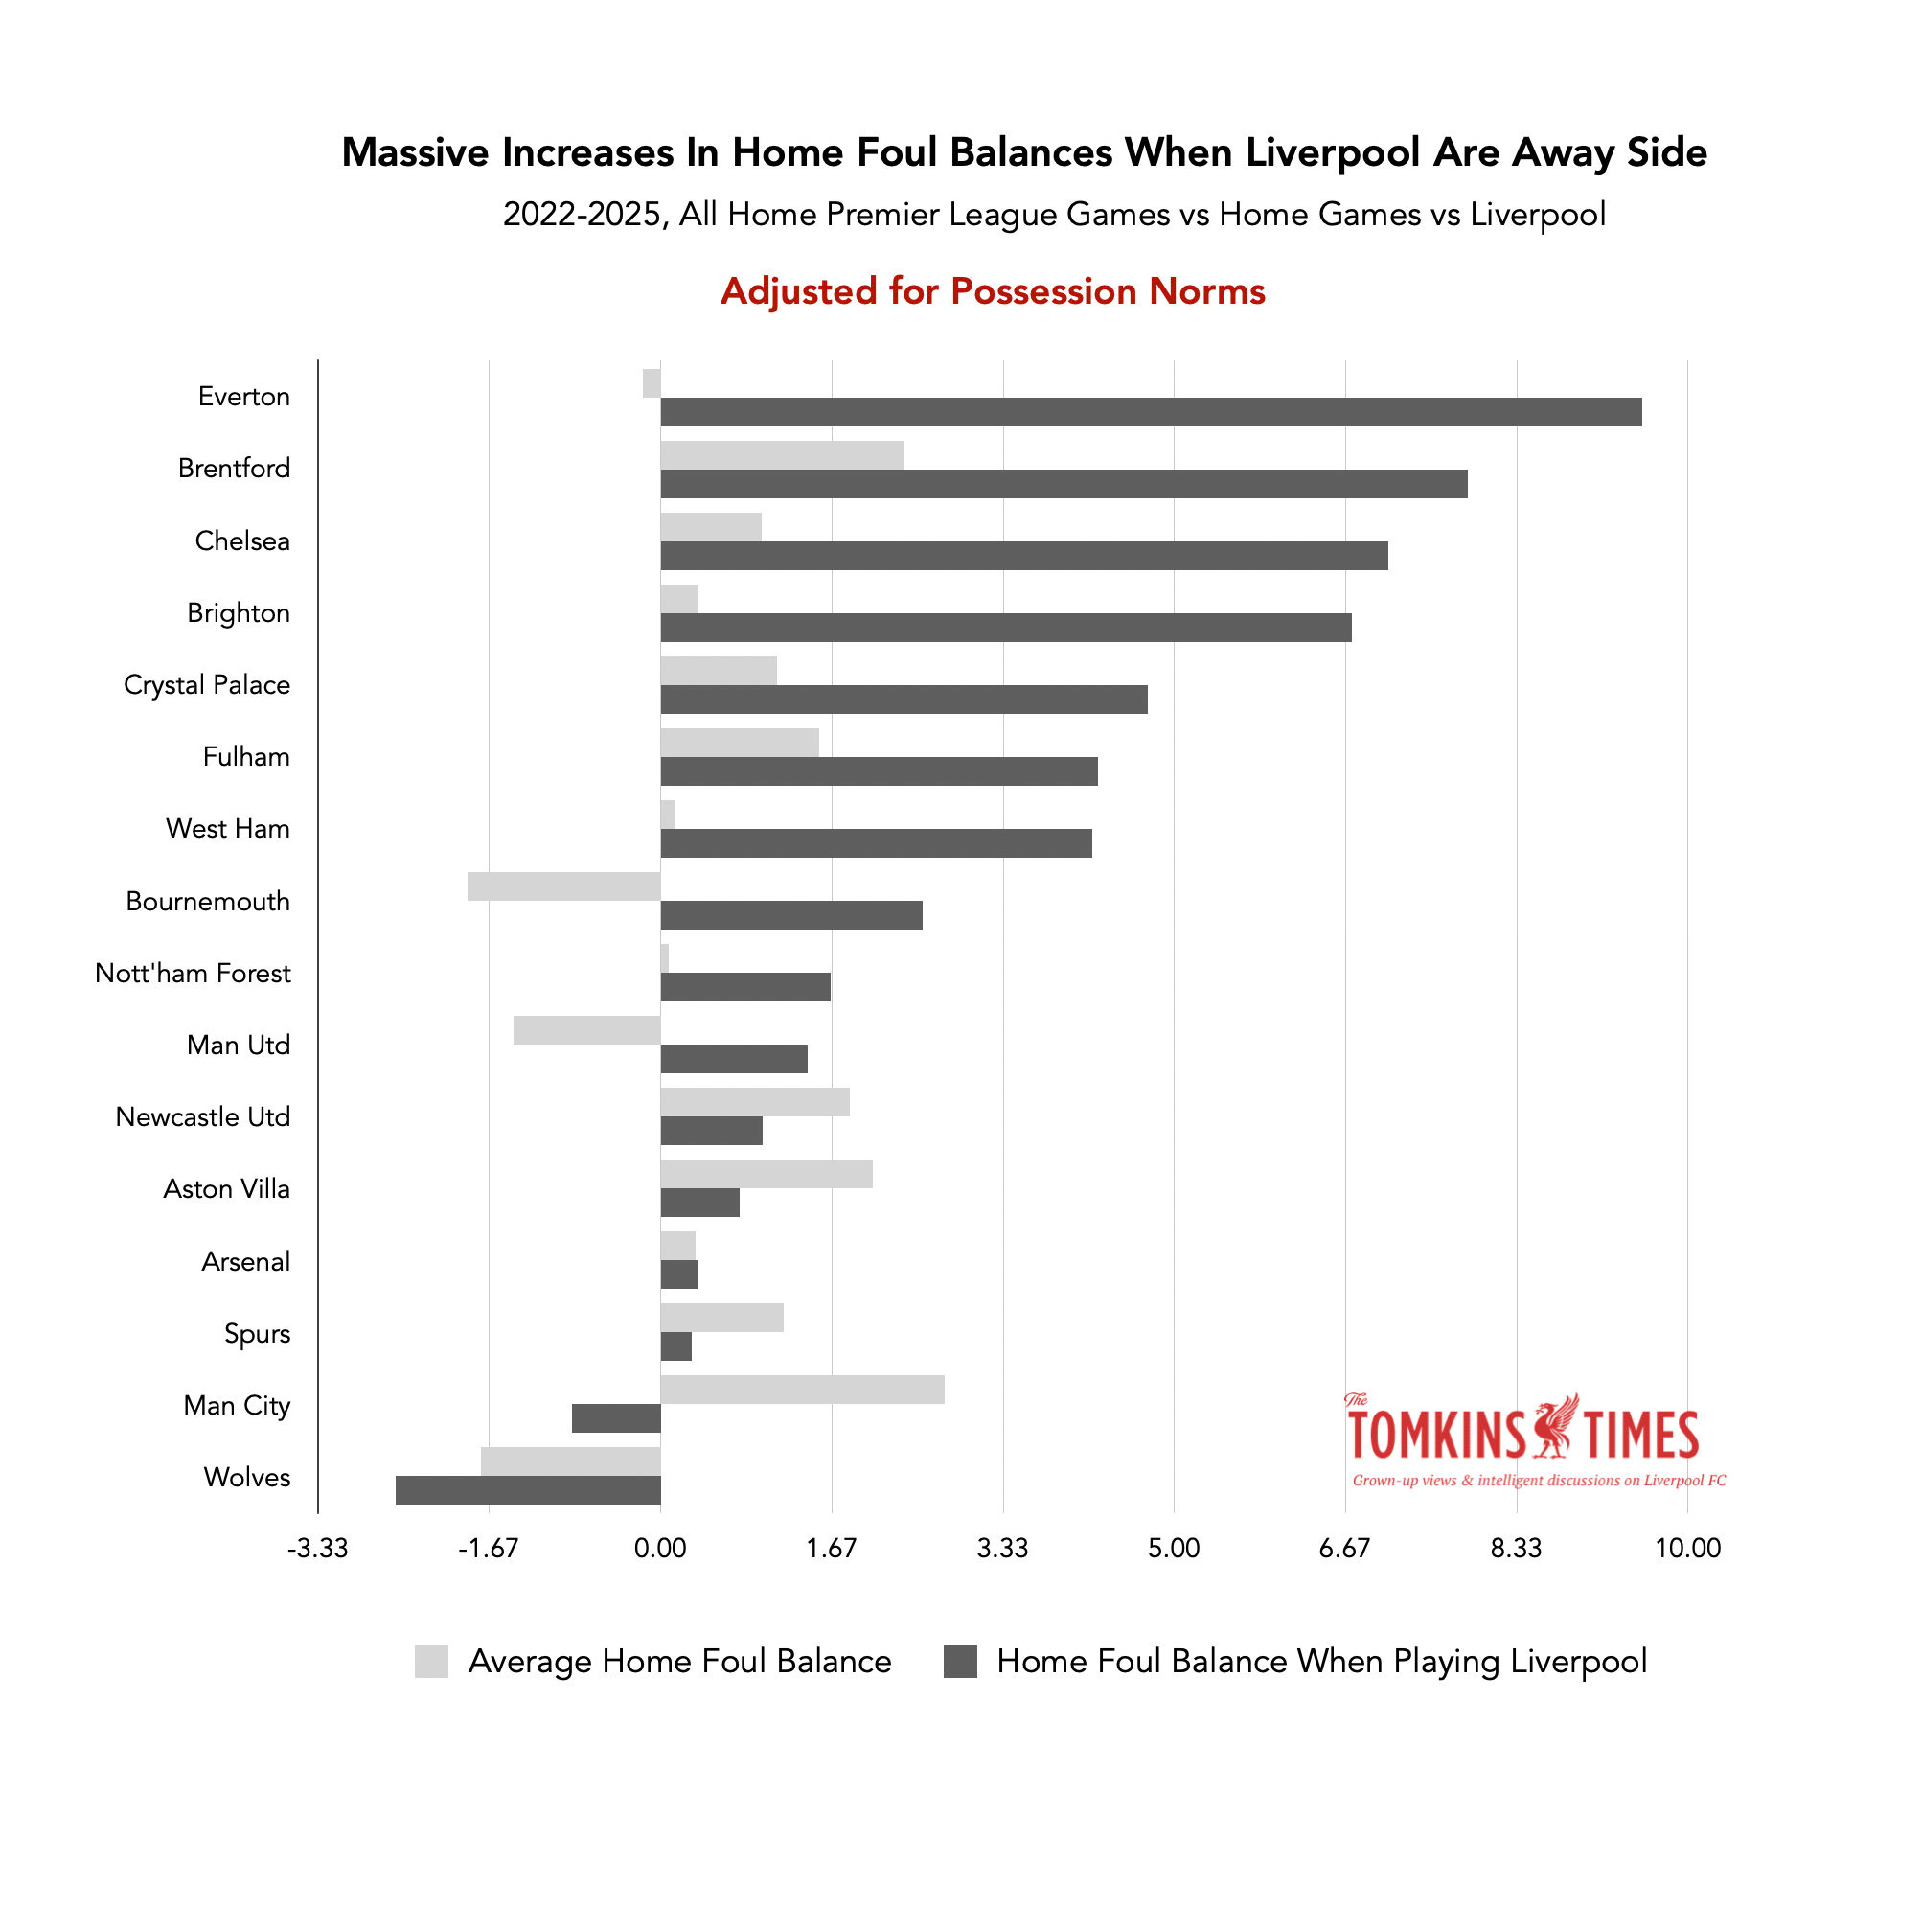
With possession taken into account, then Everton away is the game officiated furthest away from the average line.
It’s funny, in that you’d think that Everton would be more aggressive in the home derby. It certainly looks that way when you watch it, as they go flying in with their big British brawn and kick lumps out of Liverpool.
Everyone praised Michael Oliver for letting the most recent derby flow, yet he penalised Liverpool an incredible twenty times (an extremely high number), and yet let clear fouls on Liverpool players go unpunished, none more baffling than the late foul on Mo Salah, albeit Salah is treated horribly by refs as noted on here since 2022.
(Indeed, a fair chunk of this could come down to discrimination against Salah.)
Oliver only penalised Everton nine times, because he was letting the game flow for one side and kneecapping the other.
When Liverpool had just 30-40% possession at PSG and Man City recently, they lost the Foul Balance in line with that. Losing the Foul Balance made sense, even if PSG surely committed more than just three fouls all game.
Yet when they have that kind of possession advantage in games, like at Goodison, instead of winning 3-4 more fouls than the opposition, the Reds are penalised beyond all logic.
Last season, Andy Madley gave a pumped-up and physical Everton nine free kicks and none to Liverpool, until just before half-time, by which point Everton had taken the lead. (Job done!)
Liverpool and Man United Treated Badly
What follows are a series of graphs, possession vs Foul Balance, or xG Difference vs Foul Balance, and for home and away.
These are the killer graphs, to my mind. These are hard to argue with, if you understand what they are showing.
Liverpool are the massive outliers, with Man United also beyond the realms of the ‘fair’.
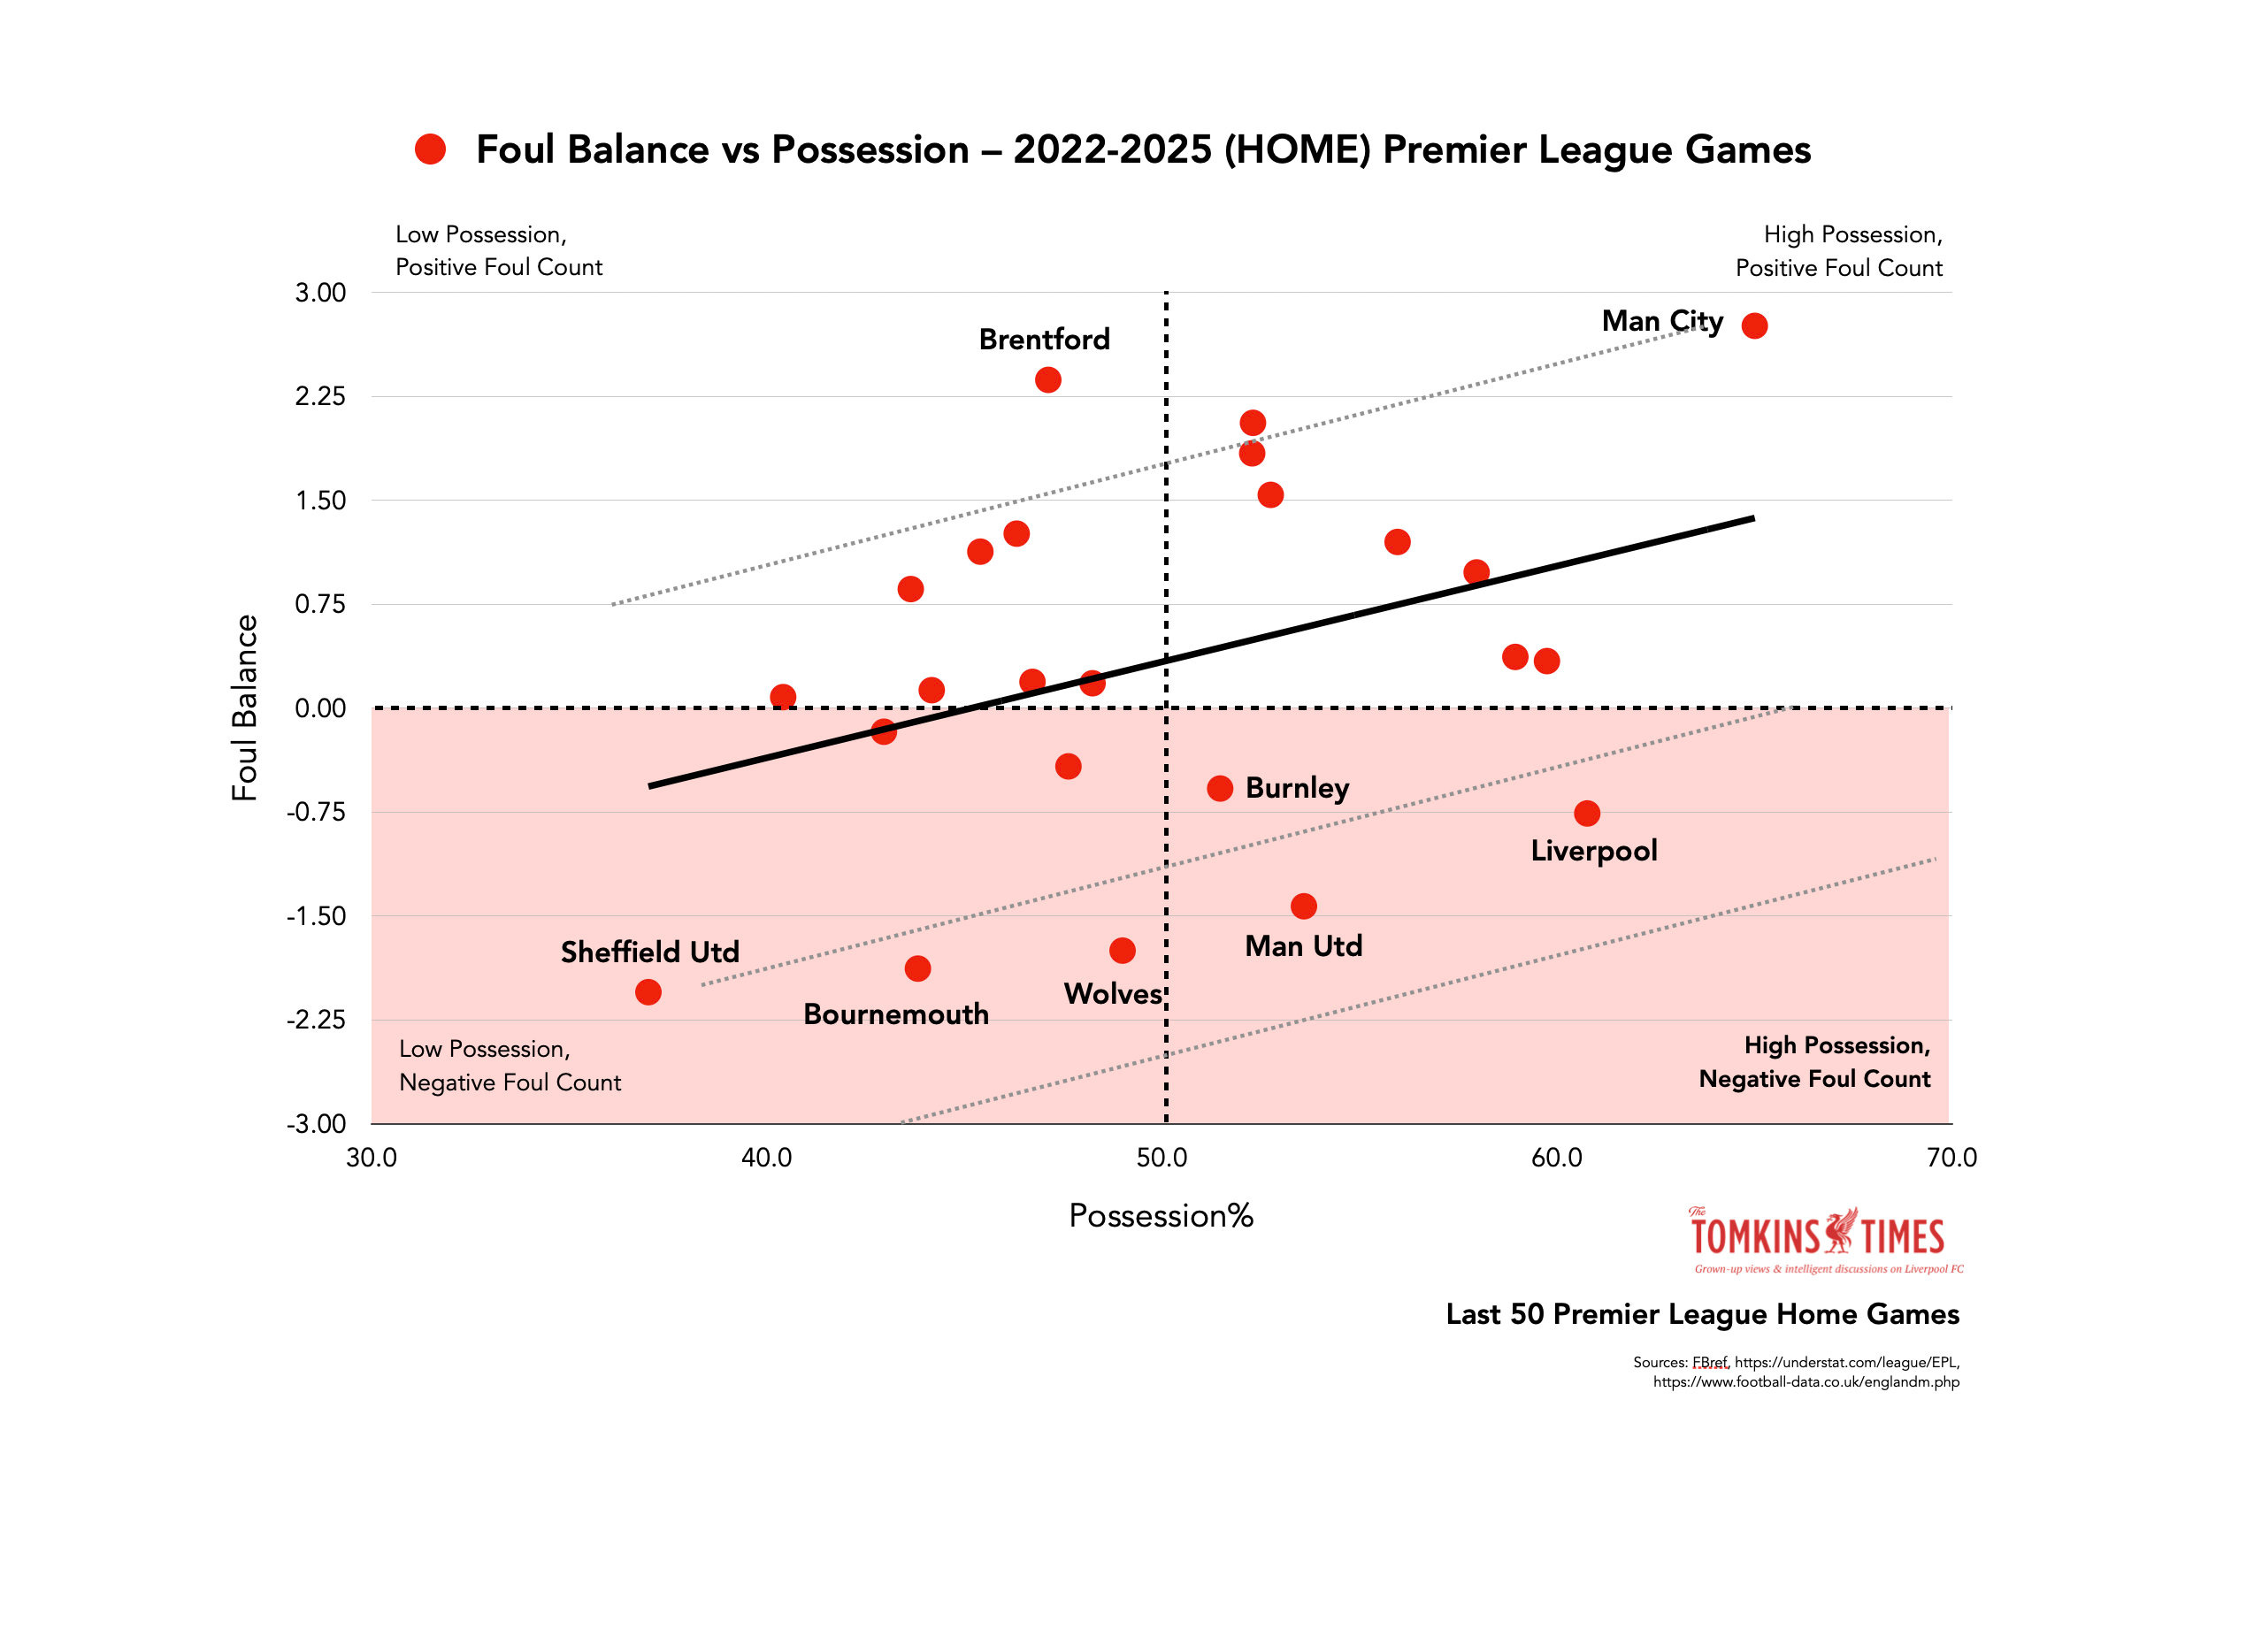
As you can see, Liverpool and Man United are harshly punished at home, but away …
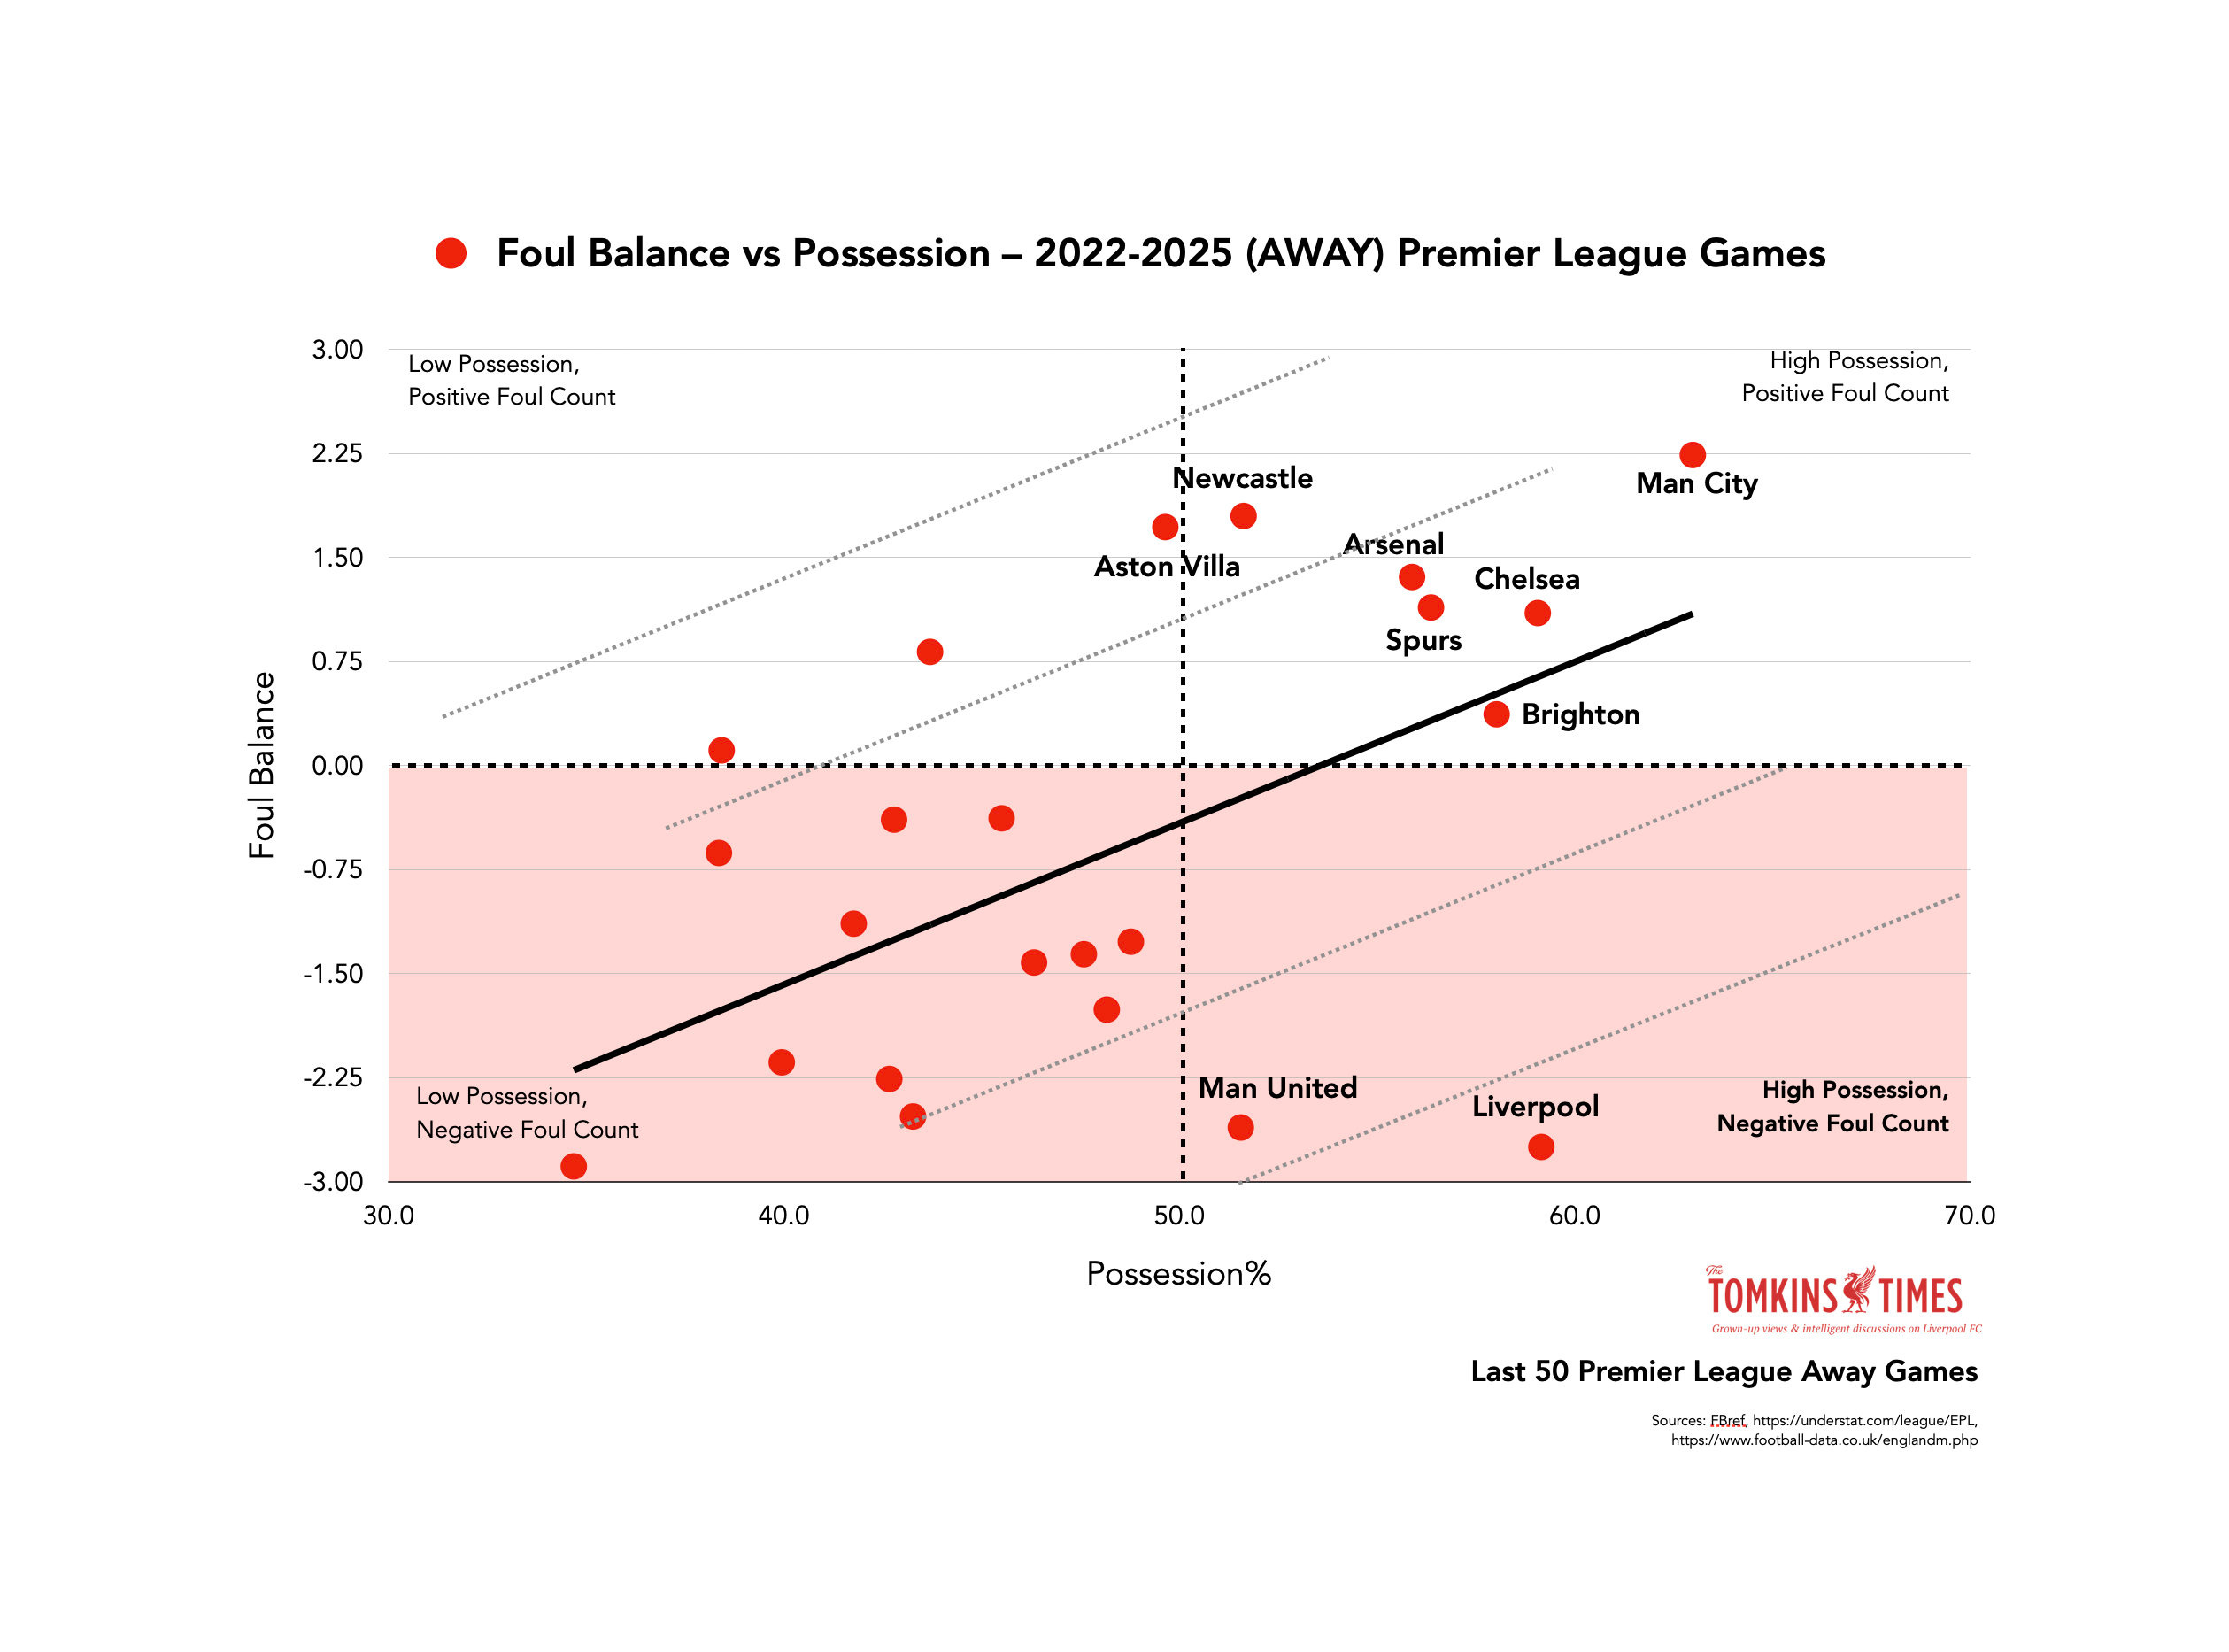
Liverpool are massive outliers, while Man United are also far from the black line that represents the trendline.
The same is true of xG Difference, with very similar patterns.
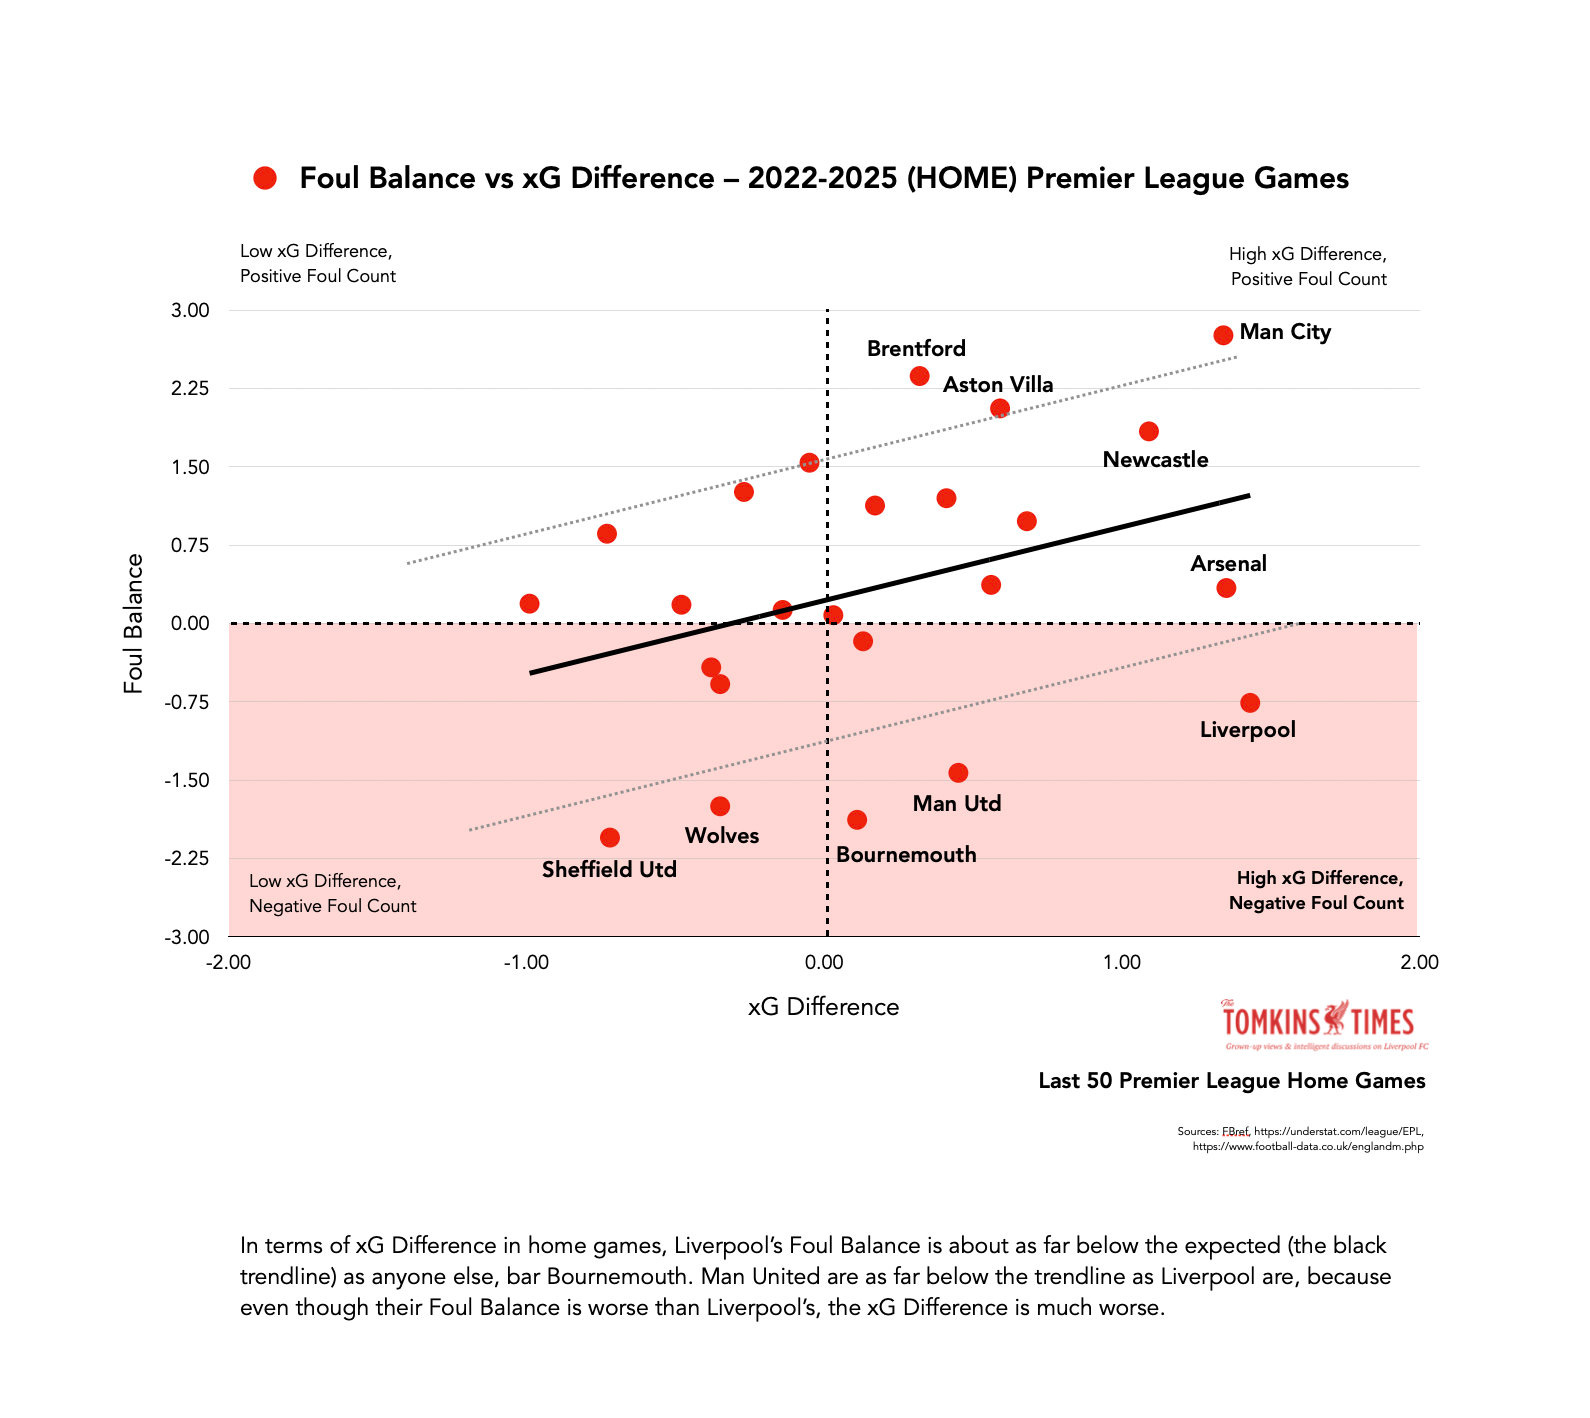
In terms of xG Difference in home games, Liverpool’s Foul Balance is about as far below the expected (the black trendline) as anyone else, bar Bournemouth.
Man United are as far below the trendline as Liverpool are, because even though their Foul Balance is worse than Liverpool’s, the xG Difference is much worse.
Surely Liverpool should be way closer to Arsenal, who also press intensely?! For all the moans of Arsenal fans, they get treated more fairly than Liverpool and Man United. (As do Spurs, Newcastle, Aston Villa, et al.)
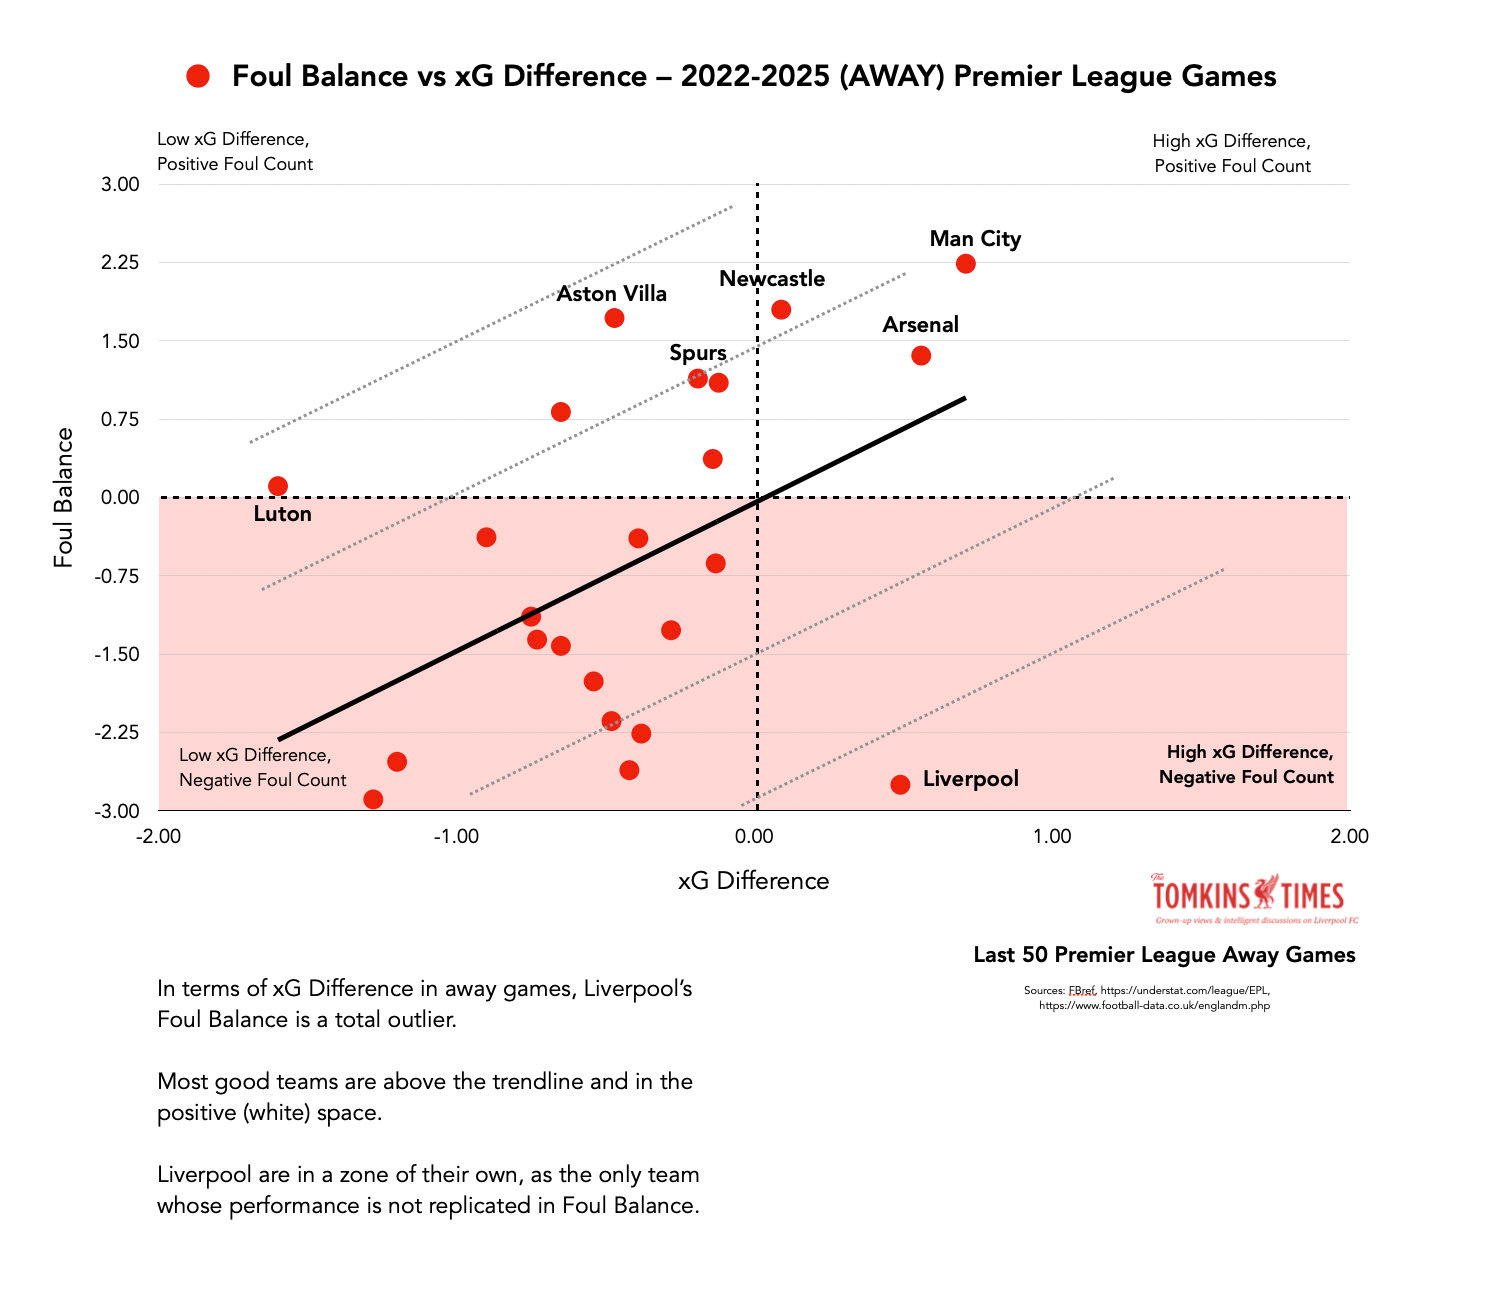
In terms of xG Difference in away games, Liverpool’s Foul Balance is a total outlier.
Most good teams are above the trendline and in the positive (white) space.
Liverpool are in a zone of their own, as the only team whose performance is not replicated in Foul Balance.
It doesn’t look like costing Liverpool the league title in 2025, but it may have done last season, especially the similar farce at Goodison; plus, Oliver and the execrable Stuart Attwell as VAR not giving Liverpool the clearest of penalties in the last minute against Man City, that tipped the title in City’s favour (not for the first time).
It may also be a (further) reason why Man United are struggling, albeit I don’t watch Man United every week, and I do watch Liverpool every week. However, despite not being very good, Man United don’t win as many fouls away from home as even worse teams.
I’d like to see all teams get fair refereeing.
Y’know, consistency, accountability, integrity.
Spurs press harder than Liverpool, but while they are penalised a similar amount (albeit not quite as much), they get given far more free-kicks (and despite being nowhere near as good as a team).
Is this like my penalty analysis from 2011-2019, when I found that British players were treated far better to foreign players in both boxes on 600 penalty decisions compared to percentage of minutes played? Spurs seem to have more English/British players in their attacking ranks. Many English players have a really good way of diving where they make it look more natural; a flop, almost. (Harry Kane was the absolute master.)
And do ‘lesser’ teams who want set-pieces play for (and deceive for) free-kicks?
Everton clearly dived five or six times to win free-kicks against Liverpool, and these dives were only noticeable from certain angles, but as they were outside the box, the ref could not use the VAR to see the deceit, and often it looks like a foul. (That still doesn’t excuse his lack of free-kicks to Liverpool.)
Liverpool have finally done well on penalties this season, albeit have also had two more chalked off by VAR. Since 2019, only two foul penalties have been awarded to Liverpool by VARs, but they will give the Reds the most blatant handballs (and offsides, which are offside). Players are almost never sent off against Liverpool by the VAR, and Liverpool don’t get DOGSOs. In recent times, Liverpool have also been disparaged by a referee, and elbowed by a linesman.
The fewest opposition red and second yellow cards are for teams playing against Liverpool. New refs are usually more likely to punish Liverpool at Anfield (well done to Lewis Smith for bucking the trend), and Liverpool have to wait longer than anyone else in terms of minutes into a match for a penalty (since 2014, aside from the season with empty stadia) and for a subjective VAR overturn (since 2019). Narratives like #LiVARpool perhaps cause refs to lose the plot.
(These days, most people are spineless and try to appease the mob, which spills out from places like Twitter/X like the worst type of virus. I suspect referees are no different.)
The pressure put on referees by rabid fans who have no idea of the data, but just go on gut instinct and narratives, doesn’t help. But no wonder Slot was raging at Michael Oliver, who ran that game purely to suit Everton.
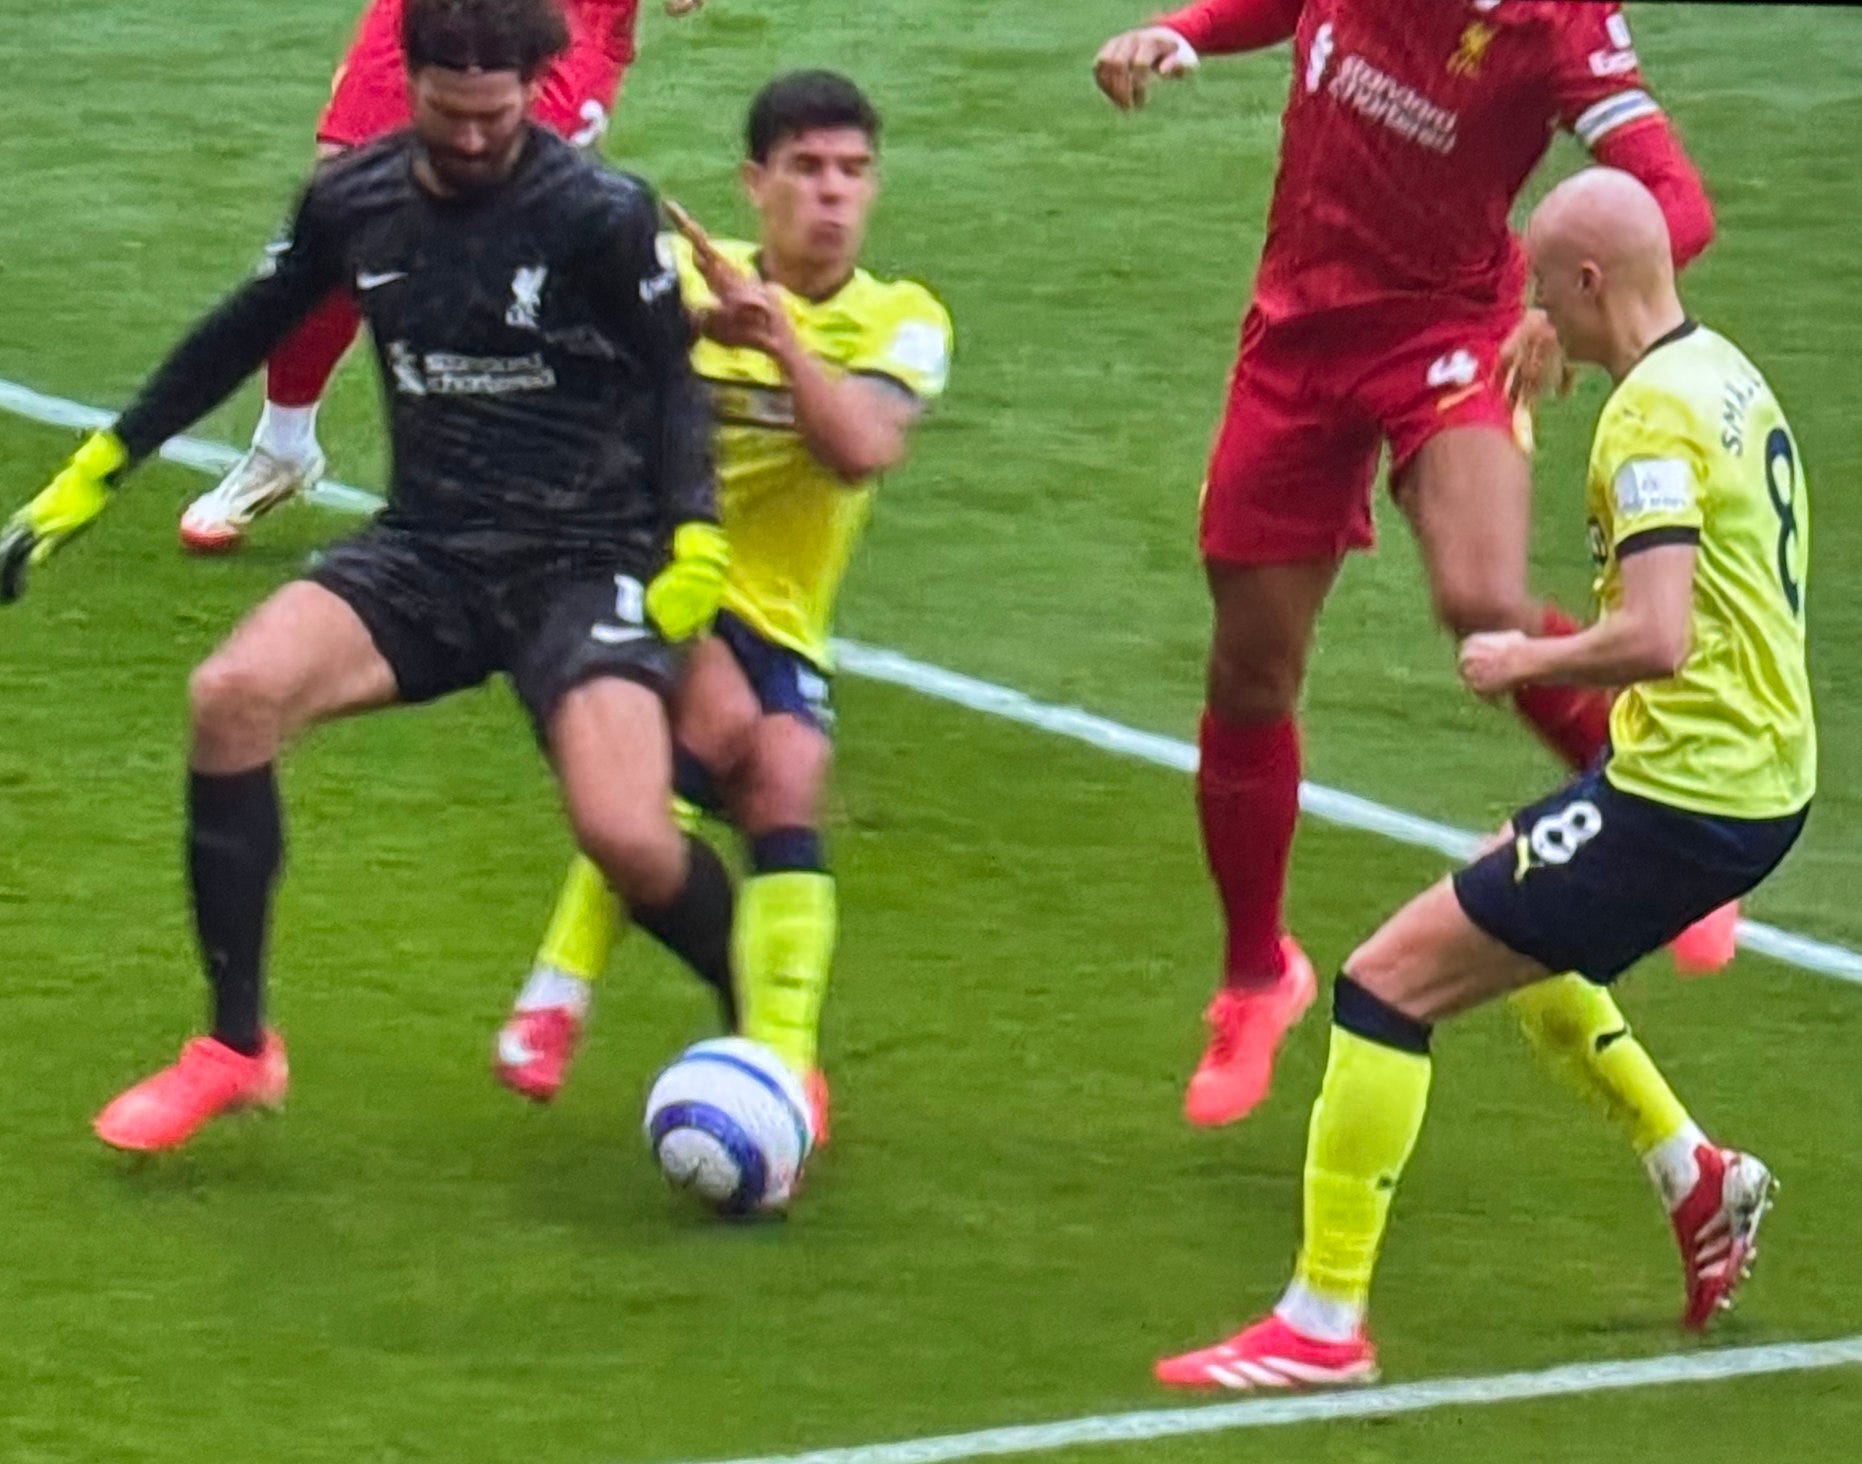
You can watch a video Daniel Rhodes created that shows the clear fouls Liverpool should have had, and that any other team would have been given. You can match it to the data of an insane -11 Foul Balance in the game, and see why it was so unfairly refereed. It’s a really good example of how the trends of that game – ignoring clear fouls on Liverpool players right in front of his face – matched the trends of the data.
Which is partly why Liverpool and Man United are only given 75% as many free-kicks as their opponents in away games, when the overall average is +1 for home teams and -1 for away teams, at between 10 and 11 fouls (so, roughly 95%, not a paltry 75%, for away teams).
Liverpool and Man United are closer to -1 at home and -3 away; and average below nine fouls received per game.
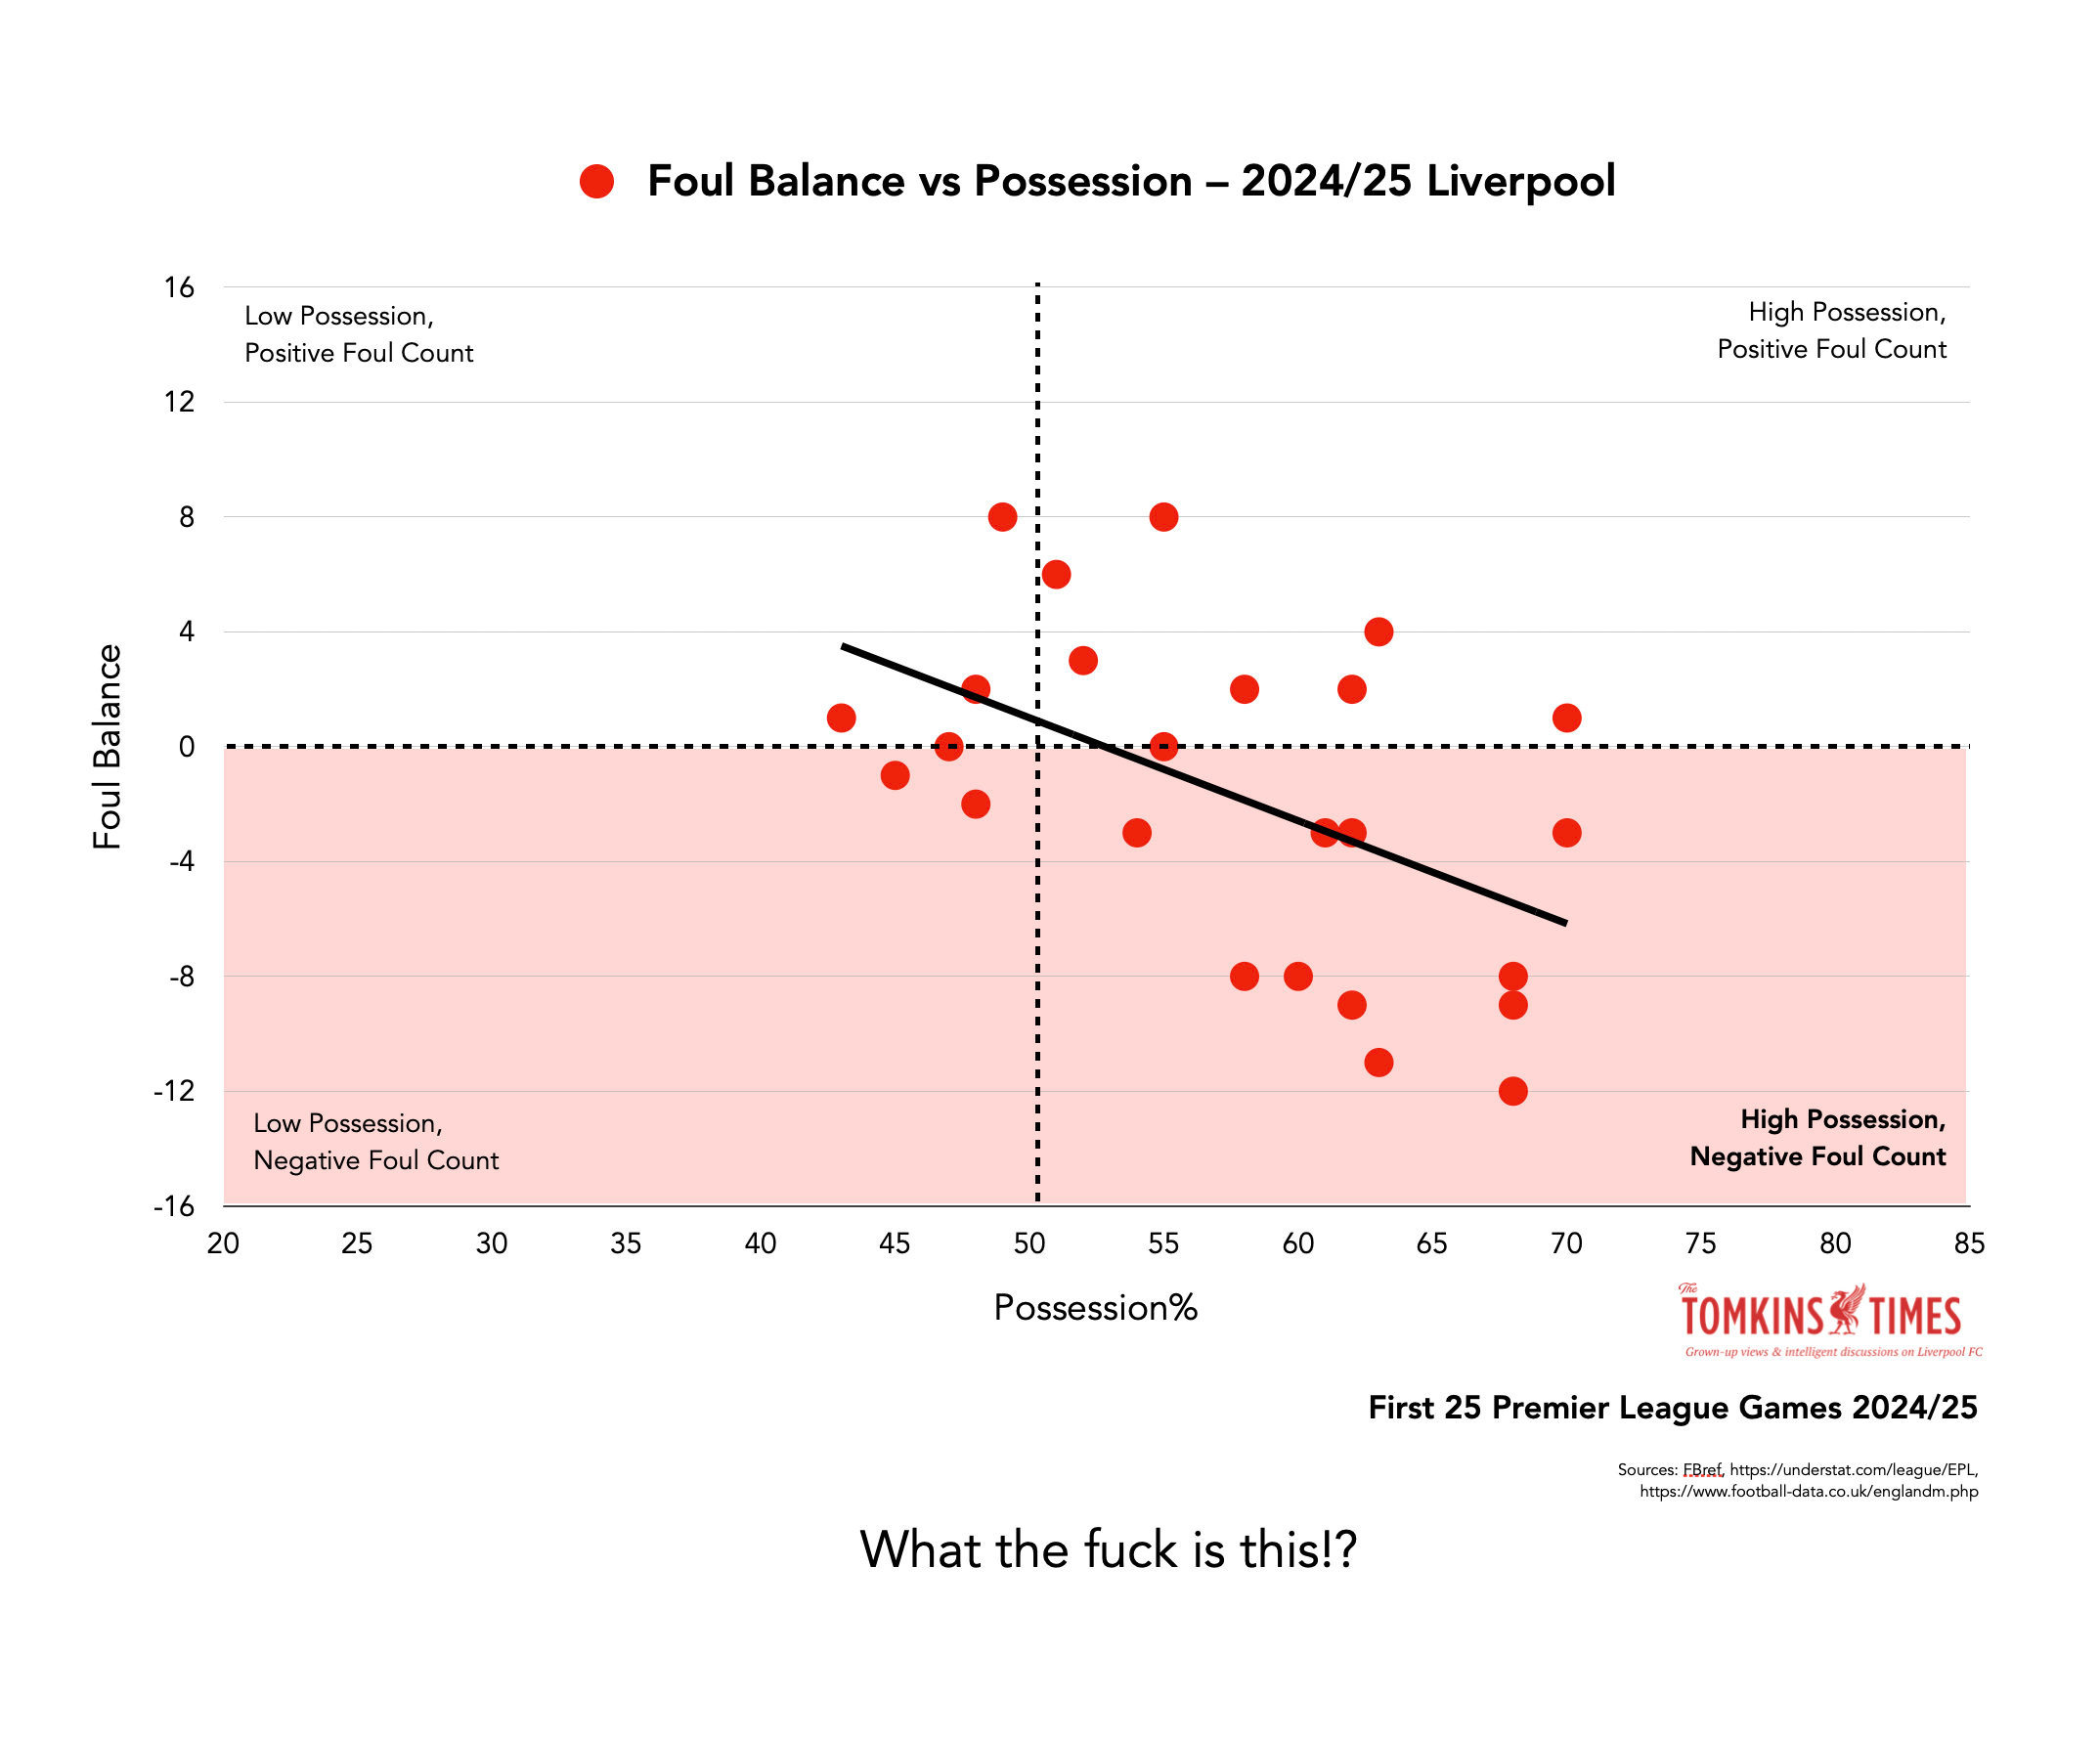
I’ll end with a reminder of this season’s Liverpool graphic for possession versus Foul Balance (from four games ago, albeit the Reds have lost the Foul Balance in three of the four since then).
Up and to the right? Not for Liverpool.
(And most of the dots in the positive spaces came earlier in the season.)
This is a free read – please share it as you see fit, either by sharing a link or by sharing the graphics and quoting the content. Comments are for paying TTT Main Hub subscribers only.
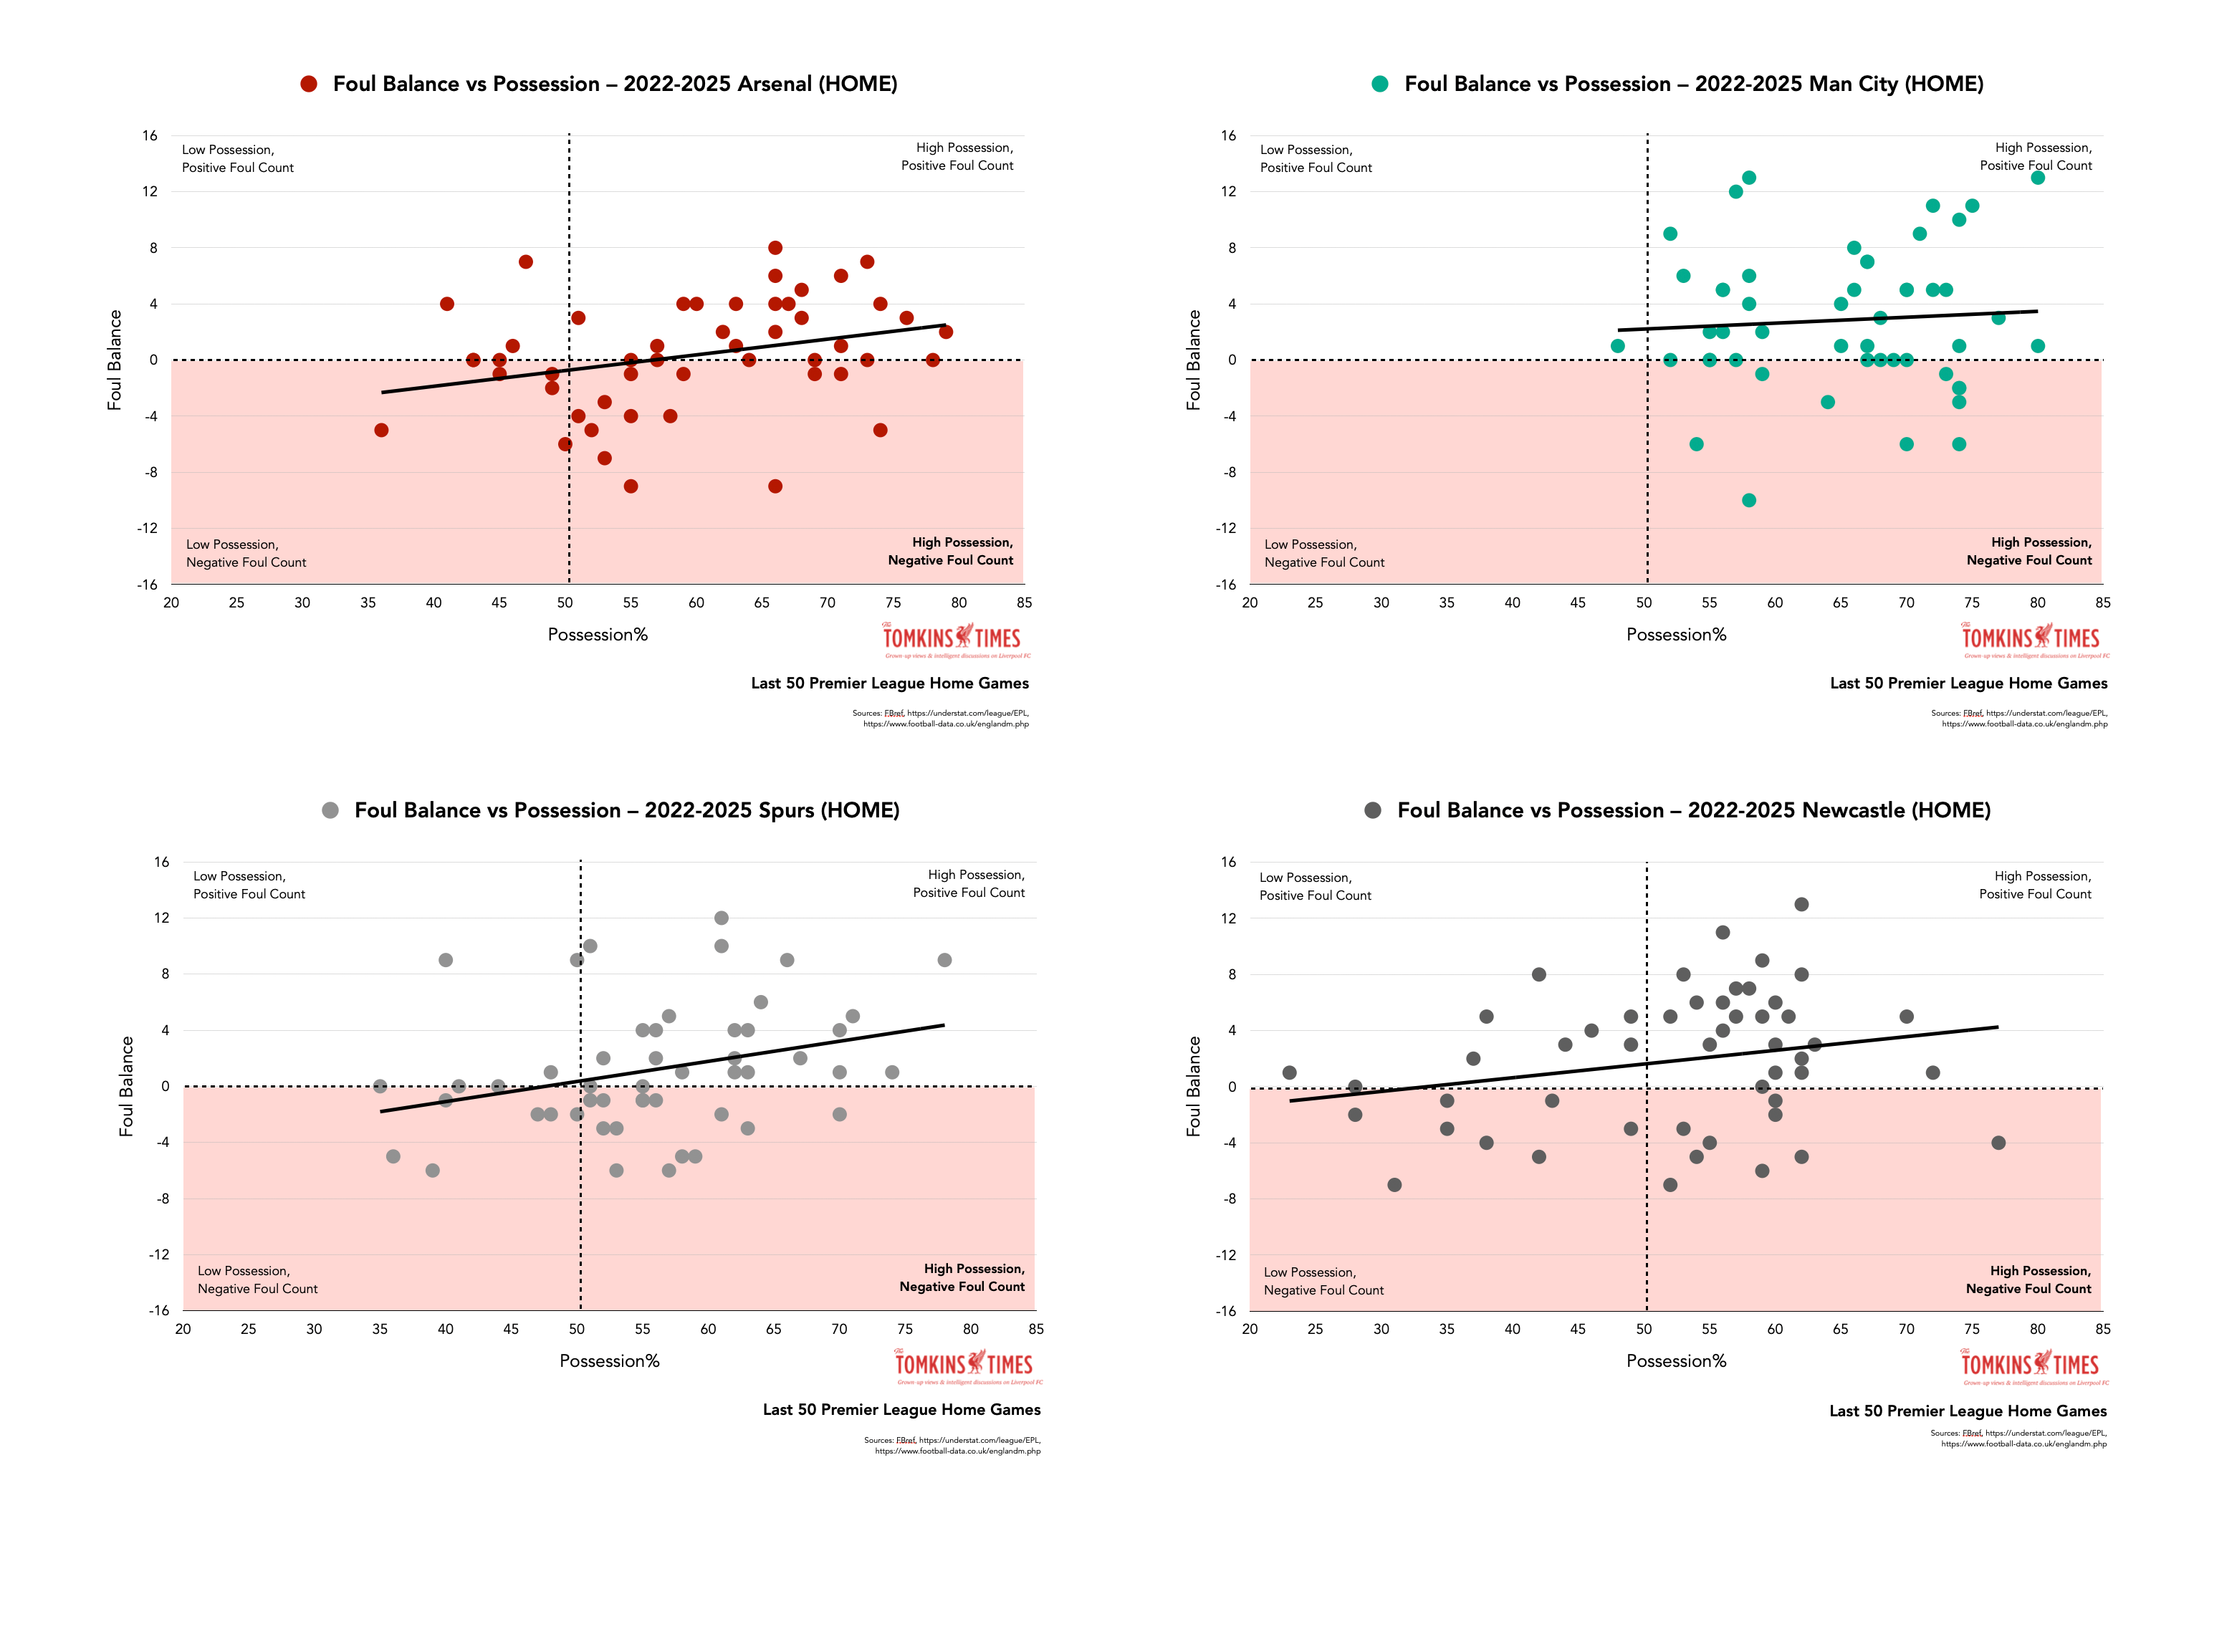
Postscript (Addition)
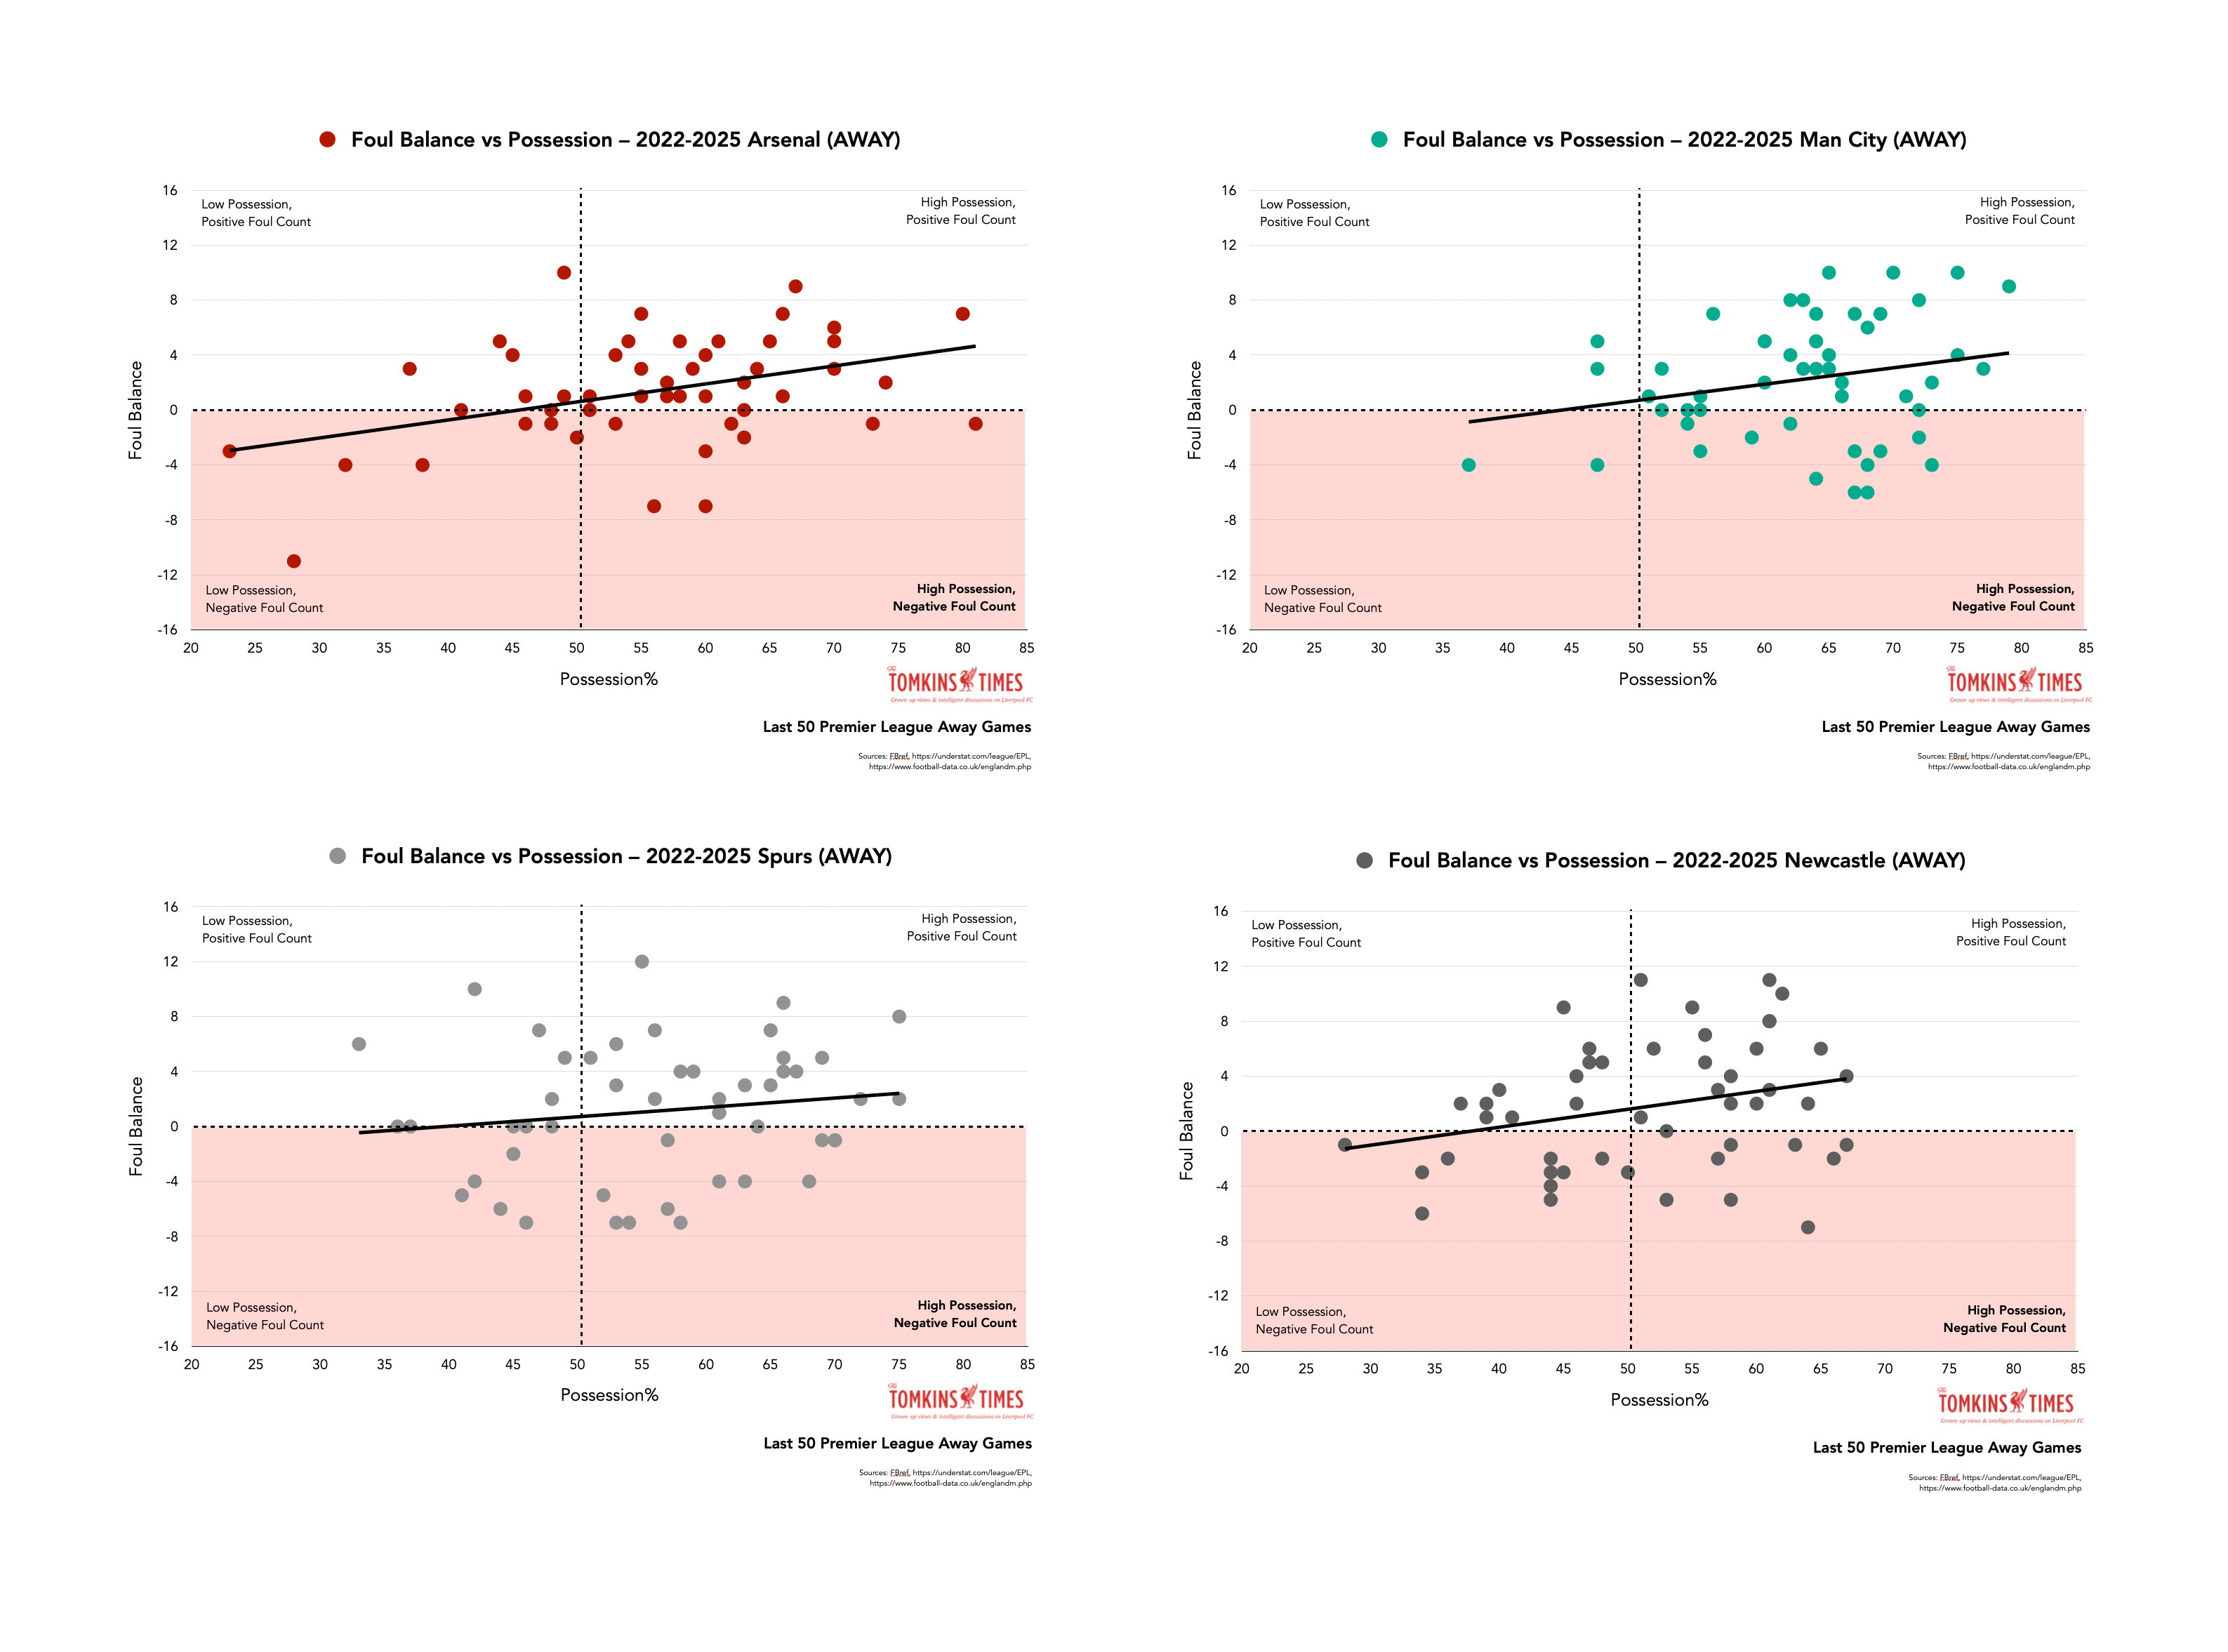
Here are some graphs showing the individual clubs’ data, and the consistency of the up-and-to-the-right trend, albeit at different rates, and some higher, some lower, on overall Foul Balance.
Even on these sample sizes, Liverpool (home and away) and Manchester United (away) are the only clubs where more possession doesn’t equate to a better Foul Balance.
As stated above, this is because, away from home, Liverpool and Man United are given an illogically low number of free-kicks.
Home

Away

Keep reading with a 7-day free trial
Subscribe to The Tomkins Times - Main Hub to keep reading this post and get 7 days of free access to the full post archives.