Facts: LFC Rank 10th in Klopp Era for PL Penalties Won, and Other Not 'Spot-On' Stuff for Reds
Non-Conspiracy-thinking, data-driven analysis without bias (by a very biased Red)
Tenth!
I've been closely monitoring and collating penalty data for several years now, including a couple of massive studies, aided by academics and gold-standard data analysts.
Yes, I'm biased, but everything I will share here is objective - data that can be double-checked. I do not mention a single subjective penalty call in this piece (beyond a single one for and also one against the Reds).
If there's randomness in penalty totals in smaller sample sizes, then the bigger the sample size, the less noise there should be.
So let's go big: nearly 300 games per club.
Yet none of what I get makes sense; remove the noise and you get a referee with his fingers in his ears, his eyes closed, saying "nope, nothing to give there".
This is also not a new phenomenon, as I've shared this data for years now, and on average, it only gets worse.
Thankfully someone put the penalty question to Jürgen Klopp yesterday.
(I was writing this piece to publish next week, given the ongoing lack of a penalty, but as a result of that press conference, I'm finishing and publishing this on a Saturday, from afternoon to evening, which isn't ideal. I don't expect it to lead to six penalties against Manchester United tomorrow. The piece will probably get lost in the chaos tomorrow, but here it is anyway.)
Klopp said: “I cannot change that [the lack of a penalty in nearly a year] obviously, but it is cool that someone else found the stats and I didn’t have to mention it: ‘By the way we didn’t get a penalty.’ ‘Really?’ This way is better.”
One of the weirder things in response was two established Liverpool writers at the Athletic coming up with these misleading, illogical points:
"Klopp succeeded Brendan Rodgers at Anfield in October 2015 and since then 738 penalties have been taken in the Premier League. Of the 738, 39 were awarded to Liverpool.
"The club have regularly featured towards the top end of the scale when it comes to spot-kicks awarded: indeed, only Manchester City and Chelsea (nine each) were given more Premier League penalties last season than Liverpool’s eight — a tally they matched in 2016-17, when they ranked fourth for spot-kicks won)."
To pick out the two OUTLIER (yes, OUTLIER!) seasons out of eight when the Reds did quite well for penalties (but still never ranked top) is like saying Emile Heskey was a regular double-digits striker in the Premier League, when he did so just twice in his final 14 seasons in the top flight (1998-2012, with a 14-goal and a 10-goal season), and in every other season fell short. It's basic numeracy.
And to note that Liverpool have won 39 penalties – as if it's a lot – when several other teams have won 50+, and one has won 60+, in the same period, seems bizarre.
There's no context to whether 39 should be considered a big number; they imply it is, but it's much smaller than 63, isn't it?!
Both are fine reporters, but I can't fathom the lack of logic with this open-goal issue, unless it’s trying to not look like they’re pro-Liverpool. (Bend-over-backwards-bias sucks. Don’t do it. Use data, analyse it carefully. Having said all that, I do get that if you try to point things out fairly, you’ll still be called conspiratorial.)
Instead of illogical comments like "this happened in 2017", let's look at all eight full seasons, in microscopic detail – albeit I'll start with the simplest numbers and then dig deeper.
Again, almost 300 league games per ever-present club (11 clubs), and all the games played by another 13 clubs (see criteria below).
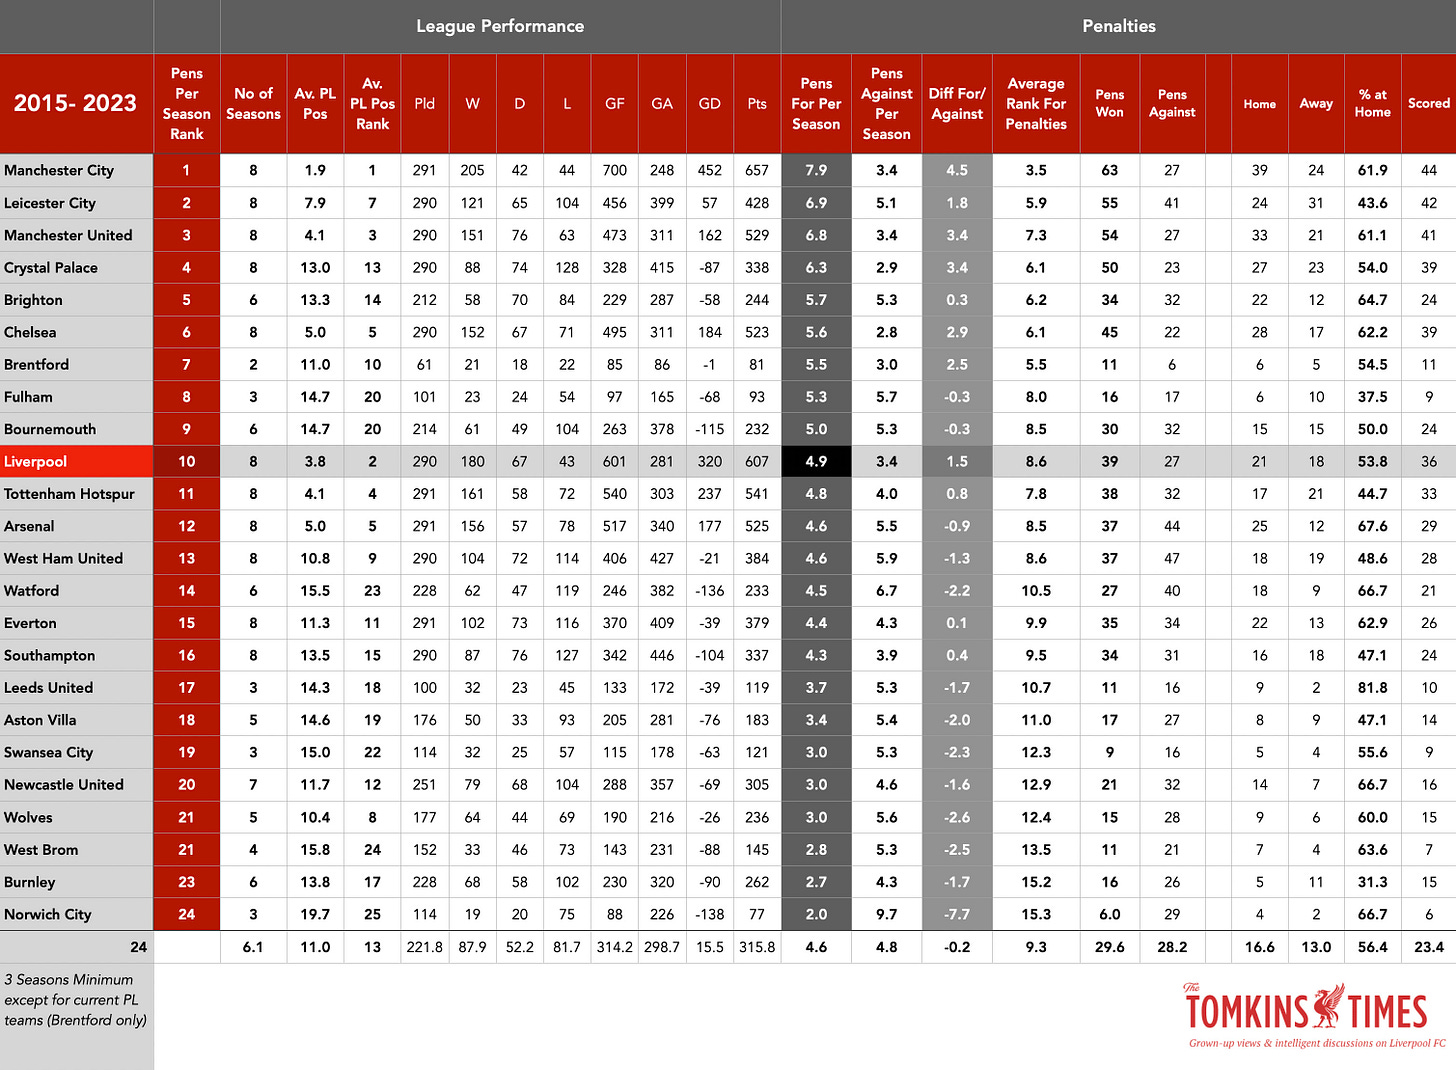
Over the Klopp era, as can be seen in the header table, Liverpool rank 10th for penalties won per season.
TENTH!
TENTH!
That's mid-table, for a team that averages 3.8th (if that's the way to express it) in the actual league table (including 6th at the time of writing for this season, but could be 5th tomorrow, and 4th if the game in hand is won).
And "3.8th" ranks 2nd, obviously, behind City's 1.9th. (Plus, it includes Klopp inheriting a mid-table side and improving it in his first season, to finish 8th.)
Indeed, if you ignore other teams, then as Liverpool fans you might want to just think about why Liverpool get so few penalties with foreign managers, but lots with British managers. (The data on that follows later in the piece.)
I will look at eight Klopp years of penalties won and conceded for all Premier League clubs*, and compare it to games played, games won, games lost, goals scored and goals conceded.
(* Minimum of three seasons, with the exception of any current top-flight teams, and there's only one - Brentford, currently in their second season.)
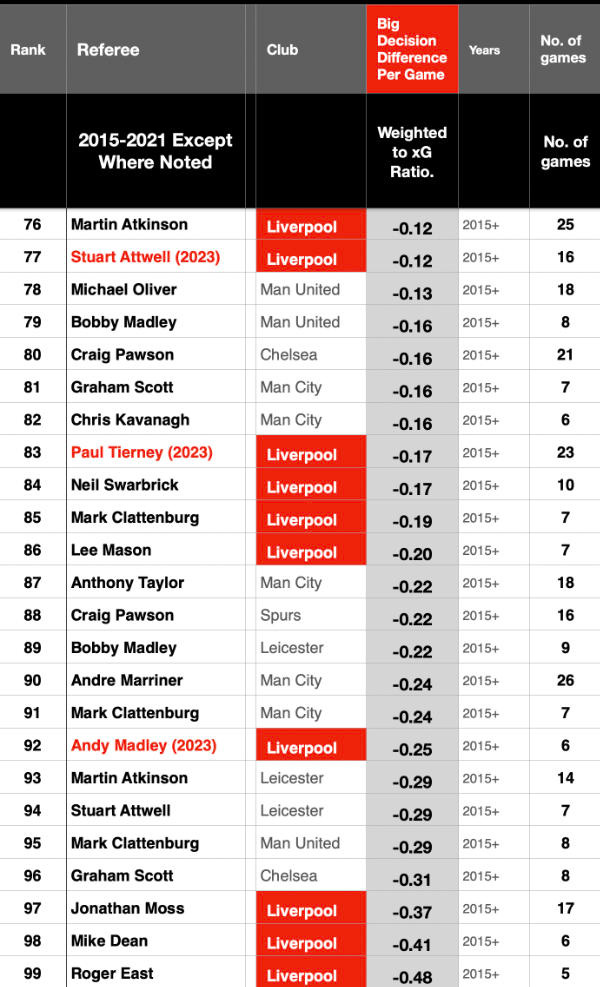
Then I will reference my extensive database on referees since 2015 that weighs their Big Decision balance against xG balance (for and against).
Again, objective.
Everything is added up and averaged out from August 2015 to 3rd March 2023.
City Spot-On
Whatever their 'alleged' off-field shenanigans that may mean they tipped the playing field, City are top of all categories, and expectedly so.
Man City have the best xG balance, and therefore you'd expect them to get the most penalties, and be the beneficiaries of the most Big Decisions.
Over the eight seasons, Man City rank top on all major metrics, and 1st for penalties won.
But Liverpool rank 2nd on all major metrics.
Games won, points won, goals scored, goals conceded, xG - City rank 1st/best on the average of nearly 300 league games.
(The same is likely true for touches in opposition box; it has been in recent seasons, with City and Liverpool way ahead of the rest.)
Yet the Reds win a shockingly low number of penalties, based on expected levels.
What shocked me was how few goals Man United have scored over the past eight seasons, and how many penalties they've won. (Liverpool’s goal difference is twice Man United’s over the past eight years, yet the Reds win far fewer penalties and concede the same number.)
Between 2015 and 2021 (the period I tracked for a previous piece of analysis), their xG balance was 1.2 to 1, miles behind Liverpool's 1.8 to 1 (which ranked 2nd), and even further behind City's 1st-place with 2.6 to 1. (So, for every 2.6 xG City created, they conceded 1xG).
Liverpool have scored 27.1% more goals than Man United in the period, and yet won 27.7% fewer penalties.
(And of course, United's goals include the extra penalties they've scored, meaning they actually scored even less.)
Man City have scored 16.5% more goals than Liverpool, yet have won 38.1% more penalties.
And remember, I'm saying that City's numbers seem reasonable; as do Chelsea's, Everton’s and Southampton’s (another penalty today that’s not included).
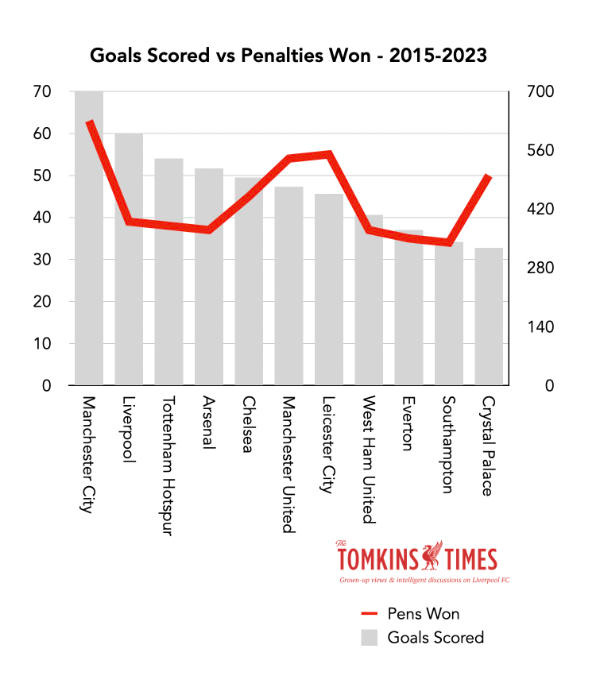
If you look at the graph below, you can see that where the red line and the grey bars are equal, you can say that the penalty count seems about right. Grey bars above the red line mean fewer penalties than you'd think a team should get, and below, more penalties than you'd think seems logical.
Attack More, Win More Penalties?
Talking on BT Sports recently, Peter Walton said that of course the teams that do more attacking should be winning more penalties. So there you have it. It's fairly logical, is it not?
Who are the two best teams, both great at attacking, over the Klopp/Pep Guardiola years? (The answer is in there somewhere.)
City seem to get a fair number of penalties. As such, City rank top for penalties won.
Certainly on goals scored vs penalties won, that seems absolutely spot-on; no pun initially intended, but once I hit upon it, I'm now gonna run with it.
Some clubs win way more that seems spot-on; Liverpool win way less than seems spot-on.
Since 2015, Man United clearly get way more penalties than seems spot-on.
(As do Brighton, who won another while I was typing this.)
Like Liverpool, but to a lesser extent, Arsenal and Spurs get fewer penalties than seems spot-on. All three clubs get a similar number of penalties, but Liverpool's attacking numbers are much better over the eight-year period.
EDIT/Addition - Penalty Difference (PD)
'Penalty Difference' (PD) – is much like goal difference: penalties won since 2015 minus penalties conceded, looking at clubs in positions 1-10 for penalties won from the above table.
Man City’s PD is 3x Liverpool’s, Man United’s is over 2x Liverpool’s, as is … Crystal Palace’s! (Roy “joyous attacking football” Hodgson was obviously their manager for the major chunk of that, following Sam Allardyce and Alan Pardew. They no longer win quite as many penalties under Patrick Vieira – albeit still more than Liverpool last season. Palace ranked #1 and #2 for penalties won during Hodgson’s first two seasons.) Chelsea also have a PD that’s roughly twice Liverpool’s.
Liverpool, Man City and Man United have all conceded 27 penalties, but the Manchester clubs have won many more.
Yet Liverpool’s Goal Difference is +320, behind only City’s 452, and almost twice Man United’s 162. Spurs’ Goal Difference also doesn’t turn into as many penalties as expected, albeit they had a big penalty-winning spell in peak Harry Kane/Dele Alli years (2016-17).
Addition: Goals Scored For Every Penalty Received
Obviously this is even worse for Liverpool, who rank bottom, given that the less penalties you receive, the fewer goals you will score in addition to the goals you score by other means.
On average under Klopp since 2015, Liverpool have to score 15.4 goals before they receive a penalty.
This ranks the Reds bottom of the entire pile for penalty frequency vs goals scored, below Burnley and Norwich.
Bigger clubs tend to fare worse in this metric, bar Manchester United. United have scored 473 for their 54 penalties, which include the penalties scored; Liverpool’s 601 goals with just 39 penalty awards means a penalty vs goals scored is almost twice as infrequent.
Research
Regular readers will know that I've found various weirdnesses with penalties over the years.
My research over the years – run past several academics and top-level data analysts who subscribe to the site – has shown that English players get a statistically significant 'benefit' in box boxes – based on a sample of 600+ penalties – compared against minutes played. (All published on the old Tomkins Times site, before the move to Substack.)
Brits concede fewer penalties than you'd expect, and win more than you'd expect.
Looking back at the major refs in a database I used to compare Liverpool against the other Big Six clubs (plus Leicester, who won the title in the same time period), those who gave Liverpool the fewest Big Decisions (2015-2021), or had a worse balance of Big Decisions, tended to be older, and be born on or live close to Merseyside.
(Hmm, bend-over-backwards-bias? Old-myths bias?)
Younger refs, from other parts of the country, were generally "fairer".
Liverpool also get a strangely low proportion of their penalties at Anfield (presumably where the 10-20 missing penalties vanished from), whereas the two Manchester clubs get a higher than normal rate at home.
Of the 711 penalties won by the clubs I'm looking at (so, excluding one-season wonders), the average is 56.4% to the home team. For Liverpool it's just 53.8%, but both Manchester clubs win over 61% at home.
This despite Liverpool's outstanding home form, bar 2020/21. Despite being good away from home under Klopp, the home form has mostly been sensational.
And when Liverpool do get home penalties, it's rarely at the Kop end.
(Now, if only there was a myth about Liverpool winning penalties at the Kop end that refs might be keen to avoid adding to, perhaps in order to avoid a social media scalding?)
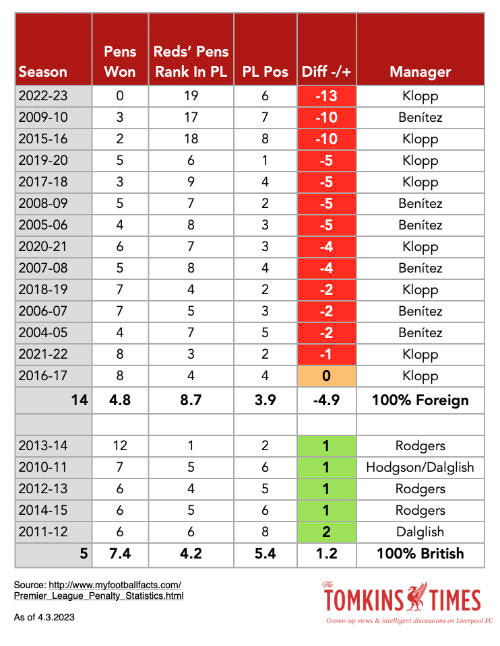
Another super-weird trend that continues: in 14 seasons with foreign managers since 2004, Liverpool have never ranked higher on penalties than they finished in the league table; 13 times they've finished lower on penalty rank than league position.
On average, with foreign managers, Liverpool finish 4.9 places below their league position when it comes to penalties-won rankings; but the British managers finish 1.2 places higher.
In five years (2010-2015) with three consecutive British managers, the Reds always finished with a better penalties-won ranking than league finish, and – incredibly – won 54% more penalties per season than compared to the teams of the Champions League-winning managers who sandwich them (and where the average league finishing position was much higher).
In part this was down to the British managers favouring British players, but it's still insane; as is that British players are treated better in both boxes.
And of course, last season I shared a viral piece about how few free-kicks Mo Salah gets awarded.
Yet of course, bar one season (2013/14, when Liverpool won a crazy 12 penalties), the Reds were much, much better under Rafa Benítez and Jürgen Klopp than the three Brits who managed a generally dour spell from 2010 to 2015.
Rodgers' Reds were only really rampant for six months, and penalties helped fuel that run (and vice versa).
Even Roy Hodgson's awful, awful Reds, won three penalties in 20 league games, stuck in the bottom half of the table, yet had won just one in the final 26 games of Benítez's league matches (when finishing 7th, which is where they were at the start of that 26-game run, in November 2009).
Again, Hodgson's Reds won three penalties in 20 games, and this current Liverpool side has none in 32. (See above addition to the piece about how many penalties Hodgson’s Palace won. It’s almost as if the refs like certain managers.)
I know it's random to a degree, but even so.…
Holes
In isolation, any decision can be said to be 'just one of those things'.
Penalties and red cards are obviously fairly random, and there can be games where there is clearly no valid claim for either. But five games, ten games, or 32 games as it now is for Liverpool in the Premier League?
Or, across 290 league games?
If certain refs have 'holes' in their data – where you'd expect to see numbers – across bigger sample sizes, then it's worth asking why.
It's not about persecuting the referees, harassing them, or any other stupid thing. It's a difficult job, and no one deserves to be harassed.
However, it's about calling them to account in a high-profile, super-well-paid job; just as you would hope people analyse the conviction rates of judges, for example (which can vary depending on how hungry they are; another good use of data).
As noted by Matthew Syed in 'Black Box Thinking', surgeons kept killing people during simple procedures and putting it down to "just one of those things" – until the data was studied, to find patterns of why people were dying on their operating tables. Turns out it wasn't just random bad luck.
Anything, in isolation – a ref who "didn't see" the penalty foul – can be listed as just one of those things; human error. But repeated human error, as seen in the data, is different.
As such, I feel there are some refs where Liverpool's hopes of a Big Decision go to die.
I then looked at Big Decisions: 2nd yellow cards, straight red cards, and penalties; for, and against.
(Obviously there are other 'big decisions' that cannot be gleaned from the dataset, such as disallowed goals, failure to send someone off for a clear red-card offence, etc., hence why I've called the above three categories Big Decisions rather than big decisions.)
I don't doubt other teams have refs who are not very generous for them (it's also in my data), but maybe they don't get them as often as Liverpool get their bêtes noires.
Indeed, Liverpool have the fewest number of refs who are generous to them, and the highest number who are "mean" to them. (Again, based on Big Decisions vs xG balance.)
I used to use Martin Atkinson as an example, as he gave a Big Decision (for or against Liverpool) at an average of every three games in charge until Steven Gerrard basically called him a useless wanker numpty in his 2015 autobiography, at which point Atkinson went into jobsworth mode: a meagre three Big Decisions in the next 25 games involving Liverpool (and just one of those for the Reds) – even though Klopp’s team had several clear claims in his games.
Basically, I ain't seen nothing, roight? (Now, where's my hefty paycheque?)
I chose the Big Six*, for obvious reasons – plus Leicester as a kind of control, in that they seemed to win a lot of penalties, and were a pretty good side, winning the title in the time period but also bobbing dramatically up and down the table.
(*Minus Arsenal, for some reason I cannot recall, but they were less successful than Leicester in the time period.)
Now, one caveat is that I need to do a lot more updating to the tables to add data since 2021, albeit I did update some specific refs (where stated). I accept that this is not 10%% 'fair' as a result; unlike the data used in the first half of this article, it's therefore not a complete dataset. (I'll update it and return to it in due course, but for now, I'm drawing on it as evidence, but not conclusive evidence. Also, all Big Decision data taken from transfermarkt.)
Another issue is VAR, and who actually made the decision. For this data, I've gone with the referee, who obviously has the choice of viewing the incidents on the screen.
Anyway, maybe an individual referee will just happen to get 5-10 Liverpool games where nothing happens; maybe Andy Madley, tomorrow's ref, has only seen one genuine penalty doing the Reds, and it was the one he awarded against Liverpool at Fulham this season.
(A fair penalty, in that Aleksandar Mitrović threw himself into Virgil van Dijk's tired dangled leg, which I think is fair enough – don't dangle legs for strikers to purposefully fall over – but there have been umpteen similar situations for the Reds, such as the Crystal Palace keeper taking out Cody Gakpo who got to the ball first – the weird inconsistency of how getting a shot away before being fouled can be a penalty, or just ignored. To me, it's a late tackle in the box. Equally, if a Liverpool striker falls over a dangled leg, he gets called a diver. But that's onto subjective stuff, clearly.)
Weighted to Liverpool's "standard" xG ratio of 1.8-1, Andy Madley has a balance of -0.25 per game, which means that over four games, he'll have a balance of one Big Decision against the Reds.
But as his sample size is small, it's not really fair to say that. (And I can't recall all the games he has done, and what decisions he should and should not have made, beyond the Fulham penalty.)
However...
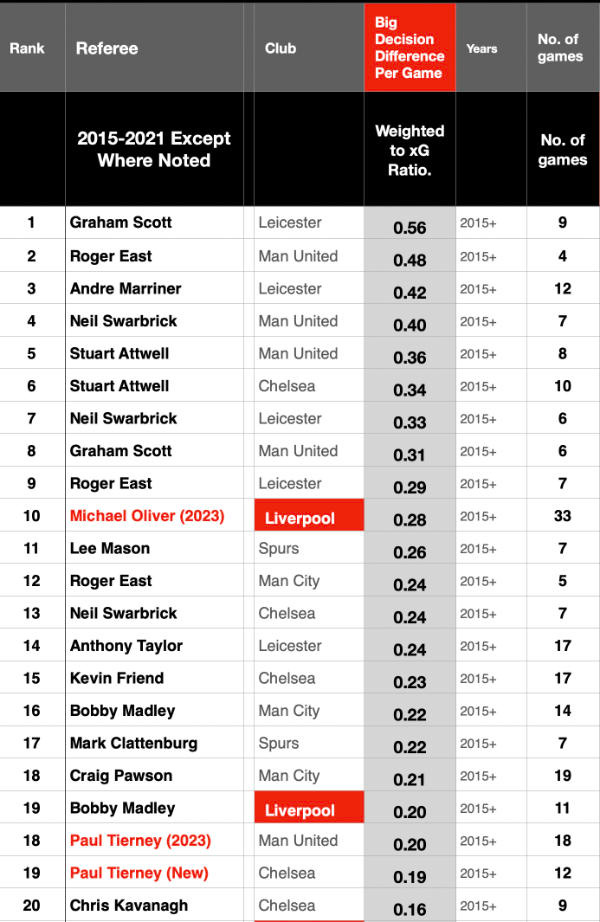
If you look at the 20 referee-and-club connections that are the most beneficial, then only two (10%) were referees giving more decisions to Liverpool than expected; whereas from positions 76-99 – the refs who seem overly harsh on a club and rank lowest in the database – there are TEN refs (41.7%) doing Liverpool.
“Best” Refs For Clubs
“Worst” Refs For Clubs
It suggests Liverpool get regularly given refs who, on average, rule against them and the expected decision rate.
And the best ref for the Reds (Michael Oliver, whom most consider the best ref) still only ranks 10th, behind four "Man United" refs, and behind a ref for every club bar Spurs, who had Lee Mason in 11th place.
(Oliver has also awarded a penalty every three games on average this season, albeit one was a very soft one against Liverpool, at Arsenal, where he and his VAR – the "unhelpful" Darren England, from South Yorkshire – missed a handball at the other end.)
Someone like Paul Tierney, from Wigan, has still only given Liverpool one Big Decision in 23 games, but has given three against the Reds.
He doesn't give many penalties in general (one every ten games this season), so whilst Liverpool should get more penalties on average than their opponents, he's not the man to give them. He also hasn't given a subjective VAR call to Liverpool, just offsides; but he has given subjective VAR calls against the Reds.
Funnily even, even the red card he gave an opponent (at Chelsea) as a ref saw him brandish a yellow, until he was told to view the monitor by Oliver.
Tierney is clearly not in the right frame of mind to referee Liverpool matches, given previous gaffes and clashes with Klopp, but he's done almost a quarter of the games so far this season, which is insane, given the number of referees out there.
(Interestingly, as a subjective red-card situation in midweek, Mario Lemina lost control of the ball and recklessly launched two-footed to win it back. Fabinho jumped, and then landed on Lemina. Fabinho was booked, and some people – perhaps smoking crack – said Fabinho should have been sent off. Anyone who understands football can tell that Lemina was at fault, in that he initiated with an illegal launch after a miscontrol – as players do, which is always a bad sign – and if Fabinho doesn’t jump he’s in hospital today. Fabinho may have made little effort to not land on Lemina – but that’s not his problem. You could see the Liverpool players’ reaction that it was another terrible piece of officiating from Tierney, and you can spot who knows about football by judging the decision. It should have been a red for Lemina, for a launch that was similar to the one from which Harvey Elliott had his ankle dislocated. Tierney and Attwell then chalked off a perfectly legitimate Liverpool goal where Diogo Jota was pushed in the box, and then caught a Wolves defender. But again, this is subjective territory, but to me, booking Fabinho and disallowing the goal were peak Tierney/Attwell.)
Do other clubs regularly get given refs the manager seems to rate as the worst?
Managers shouldn't choose the refs, but you should have a veto if one seems especially incapable of the task, for whatever reasons.
I’m not saying Tierney is definitely biased against Liverpool, but the data suggests someone who may be problematic – and that’s before analysing things like not seeing Jota taken out at Spurs last season by the most blatant foul of the whole season, and disallowing ‘good’ goals as the VAR.
Madly
In addition, I just added Andy Madley and his Liverpool games to the database, given that he's doing the game this weekend, but only added his Liverpool stats.
I have no idea what he's like with other clubs, but all the other referees in the dataset are the ones who did the most games for the major clubs between 2015 and 2021 – and that in some cases the data is 2015-2021 and a few cases, 2015-2023. It's not ideal, but I was trying to get this piece out ASAP.
So far, Darren England, whose VARring has worried me (he didn’t alert Michael Oliver to the goal-stopping handball at Arsenal amongst other decisions) is even worse as a ref for Liverpool, but I haven't added him to the spreadsheet yet. As a ref, he’s given Big Decisions against Liverpool, but not yet one for Liverpool.
Again, his dataset is small, but when all added together, the pattern is clear.
Liverpool also get refs this season who, on average, award slightly fewer penalties than the norm; but have still awarded three against Liverpool, and none for.
The good news is that Martin Atkinson, Neil Swarbrick, Mark Clattenburg, Lee Mason, Jonathan Moss, Mike Dean and Roger East – the bad old guard – have all retired. (Dean, from Merseyside, was largely bad for Liverpool.) Mason went to VAR, but left in ignominy.
But the Reds keep getting given Tierney, and the similarly "unhelpful" Stuart Attwell and Darren England, and now Andy Madley too.
Of the 24 games so far this season, five have been by "helpful" referees according to Big Decisions vs xG, and 19 by "unhelpful", albeit four of the 19 were only very slightly in the "unhelpful" camp, and thus I'd say their numbers are virtually neutral (Anthony Taylor for three games, Craig Pawson for one; Taylor being a ref I've used data to accept as a fair official, despite his Mancunian connections and a couple of high-profile iffy decisions. Liverpool have had Pawson and Andre Marriner in just two games this season; but Tierney in five, in addition to his VARring).
So this could be the issue: certain kinds of refs (maybe ones who the PGMOL love standing up to terribly one-eyed Kop) are given to Liverpool. Weaker refs will no longer crumble to a terrace, but to the millions on social media.
Some of those refs, if they live close to Liverpool, may try too hard to not look biased. Some may genuinely hate Jürgen Klopp, who shouts at them, but generally doesn’t throw them under the bus each week.
As I've said before, to be truly fair, the Premier League needs to mix up its refs as much as possible between clubs and stadia, so that there is no unintended disparity; especially as some refs are very card-and-penalty-happy, and others the complete opposite. That skews the system.
It made sense to have shorter journeys for refs during the height of Covid, but journey times need not be convenient for refs – they need to do all possible clubs, unless they have a connection to them (Kevin Friend, in my study, has never done a Leicester game).
Next, just try to improve on the clearly substandard quality of English referees, and make them aware of things like trying too hard to not look biased. Have their conversations with the VARs for all to hear, and have them explain decisions after games. If they mess up, admit it. We all make mistakes. But in addition, spot patterns of mistakes; don’t just say it’s one of those things. Study their data.
Also, try to create more consistency, as it feels like refs are getting even less consistent, and decisions more confusing.
Again, whatever the reason, Liverpool get much fewer penalties than expected, and have referees who, on average, treat them harshly on all Big Decisions when compared against xG – and against rival clubs.
This is clearly far from ideal.
(This is a free piece, but commenting is behind the paywall.)
Keep reading with a 7-day free trial
Subscribe to The Tomkins Times - Main Hub to keep reading this post and get 7 days of free access to the full post archives.


