Homer Sapiens: Refs, VARs, and Proving Clear and Obvious Biases and Fallibilities (Declassified Data Dossier)
FREE READ MEGA-STUDY
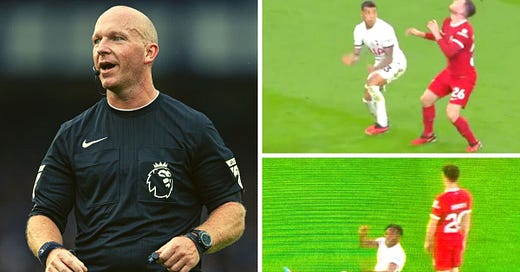
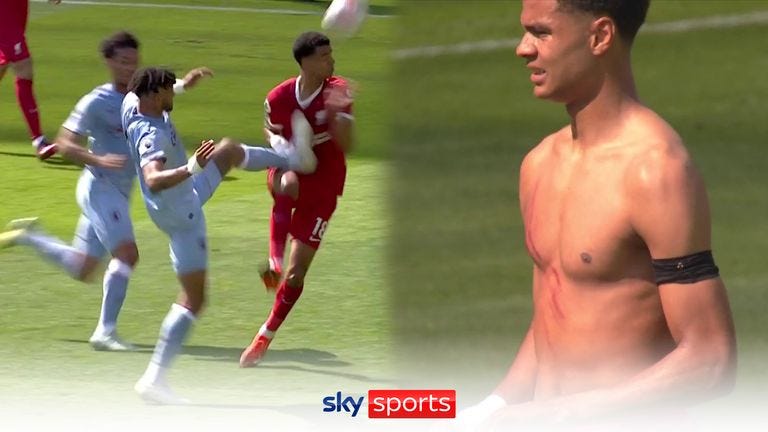
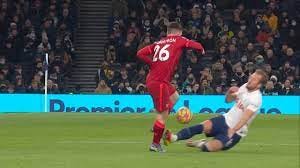
(Image from this This Is Anfield article.)
*Declassified by me.
Eight full years of refereeing data, four years of VAR
The four best teams, 1,200 games. The data is in.
It’s never been clearer: referees (and even VARs) often don’t give decisions as to what the correct call should be, but what they feel under pressure for it to be.
But the term sapiens fits: a lot of the time, it’s human error; but also, avoidable human error. But there are Homers, anti-Homers, Avoidants, Crowd-Pleasers, and the just plain weird.
And there’s stuff like yesterday, that was well beyond acceptable human error. And that happens too often.
This is a free read, and I’m gonna see how much I can get into one article without breaking Substack. (The email version will be automatically abridged.)
Key Findings – Summary
Paul Tomkins, 1st October 2023
Study of Officiating of Liverpool, Man United, Man City and Chelsea, 2015-September 2023.
Well, that escalated quickly.
After months working on this piece (constantly updating the data, finding new things to check and fine-tune, going back for more data, and so on) I was almost ready to publish this in-depth study, with all officiating decisions in the Premier League correct up to a couple of weeks ago.
Then the latest officiating farce happened, and I’ve brought publication forward.
Most of this study is objective data. I add some analysis, but the data should mostly speak for itself.
After this brief intro I’ll start with bullet points of the summary of the findings to this, my biggest (and final!*) refereeing analysis, based purely on objective data with my subjective takes that you can dismiss as biased if it pleases.
(* I want to go out with a bang on this, as the best study I can possibly do, and then leave it all behind. It feels more like doing a PhD in refereeing pressures, biases, shortcomings and crowd pleasing; at the very least I expect to receive an honorary BTEC diploma in woodworking.)
I want to acknowledge, yet again, that refereeing is a tough job, but also a professional role worth up to £200,000 a year, and some refs have taken money to do one-off games elsewhere, too.
Apparently hailing from Yorkshire gets you a job, mind, with the last four heads of refereeing from Yorkshire, and senior training positions giving to Martin Atkinson (from Yorkshire) and Jonathan Moss (lived in Yorkshire for decades), while the ex-player who works with them is from Yorkshire. Darren England, the VAR who was negligent yet again, is like several other officials, from Yorkshire, just like the head of the PGMOL, Howard Webb. I noted all this some time ago.
Otherwise, 13 referees since 2015 have been from the Northwest, and zero matches have been reffed by someone from London. That in itself is extremely odd.
We also saw Mike Dean recently admit he refused to make a decision as a VAR as Anthony Taylor was his mate. He was slammed for saying this, but he spoke a clear truth about conflicts of interest. Again, it shows in the data.
Main Four
For reasons that I will explain in more depth later, I focused on all Premier League matches involving what I call the Main Four (Man City, Liverpool, Man United and Chelsea) since 2015, with the data correct up to the start of September 2023.
These four are the most successful clubs during that period, as I will show; and thus, the most comparable.
So, 1,200 matches, 638 of which also had VAR. And across those 1,200 games, 88 referee/club combinations.
I’ve also focused on 2015 onwards because that was when Jürgen Klopp took charge of Liverpool, and when Liverpool got better; but their Balance of Big Decisions got worse. It’s far enough back in time to give eight years of data, but not so far back that we’re talking about whether or not Ian Rush was offside.
While I clearly have a Liverpool FC bias and focus, this is all objective data.
Liverpool obviously suffer more weirdness from officials, as I’ve shown for years, but this is the fairest, most detailed analysis, to look into factors like home vs away, and opposition quality, to create a more accurate Expected Big Decisions model; as well as creating an Objective Ref Rater coefficient, which compares referees to the ‘norm’, and how far they stray from that in three separate metrics that I combine into one overall figure.
I also use only data, and make no subjective calls about what should or should not have been a red card or a penalty, except in a couple of cases where I go into more detail. We can argue all day long about what should or shouldn’t have been, but when there are giant gaps in the data, or massive skews, it tells the story in a way that arguing over one or two decisions does not.
Some of the key findings involve all referees (and VARs) and averages, and others focus on the outliers, whose data seems unusual.
I don’t like to suggest active corruption, but there are some patterns that, as I’ve said before, would be investigated if it involved betting. At the very least there is some serious human failures, beyond the acceptable errors you used to expect.
All refereeing data is via Transfermarkt’s excellent match-by-match rundowns, and VAR data is via Andrew Beasley and ESPN.
On average, a Main Four team gets 1.68 Big Decisions For for every one Big Decision Against, across the 1,200-game sample (with some double-counting for head-to-heads between the Main Four).
1.68:1
Note: I’m capitalising Big Decision to make it clear that it’s a penalty, red card or second yellow, and nothing else. As ever, we can’t count Big Decisions not given, just those that are, unless it’s not given by the ref but then given by the VAR. I’ll also capitalise For and Against. Plus, I’ll also call subjective VAR overturns Big Decisions. And ‘Homer' means what it sounds like, not a reference to The Simpsons. When I say ‘generous’, that’s in comparison using data and not a subjective judgement on any of the decisions.
1.68:1
The key findings from the study are as follows, with all caveats and full explanations later in the piece:
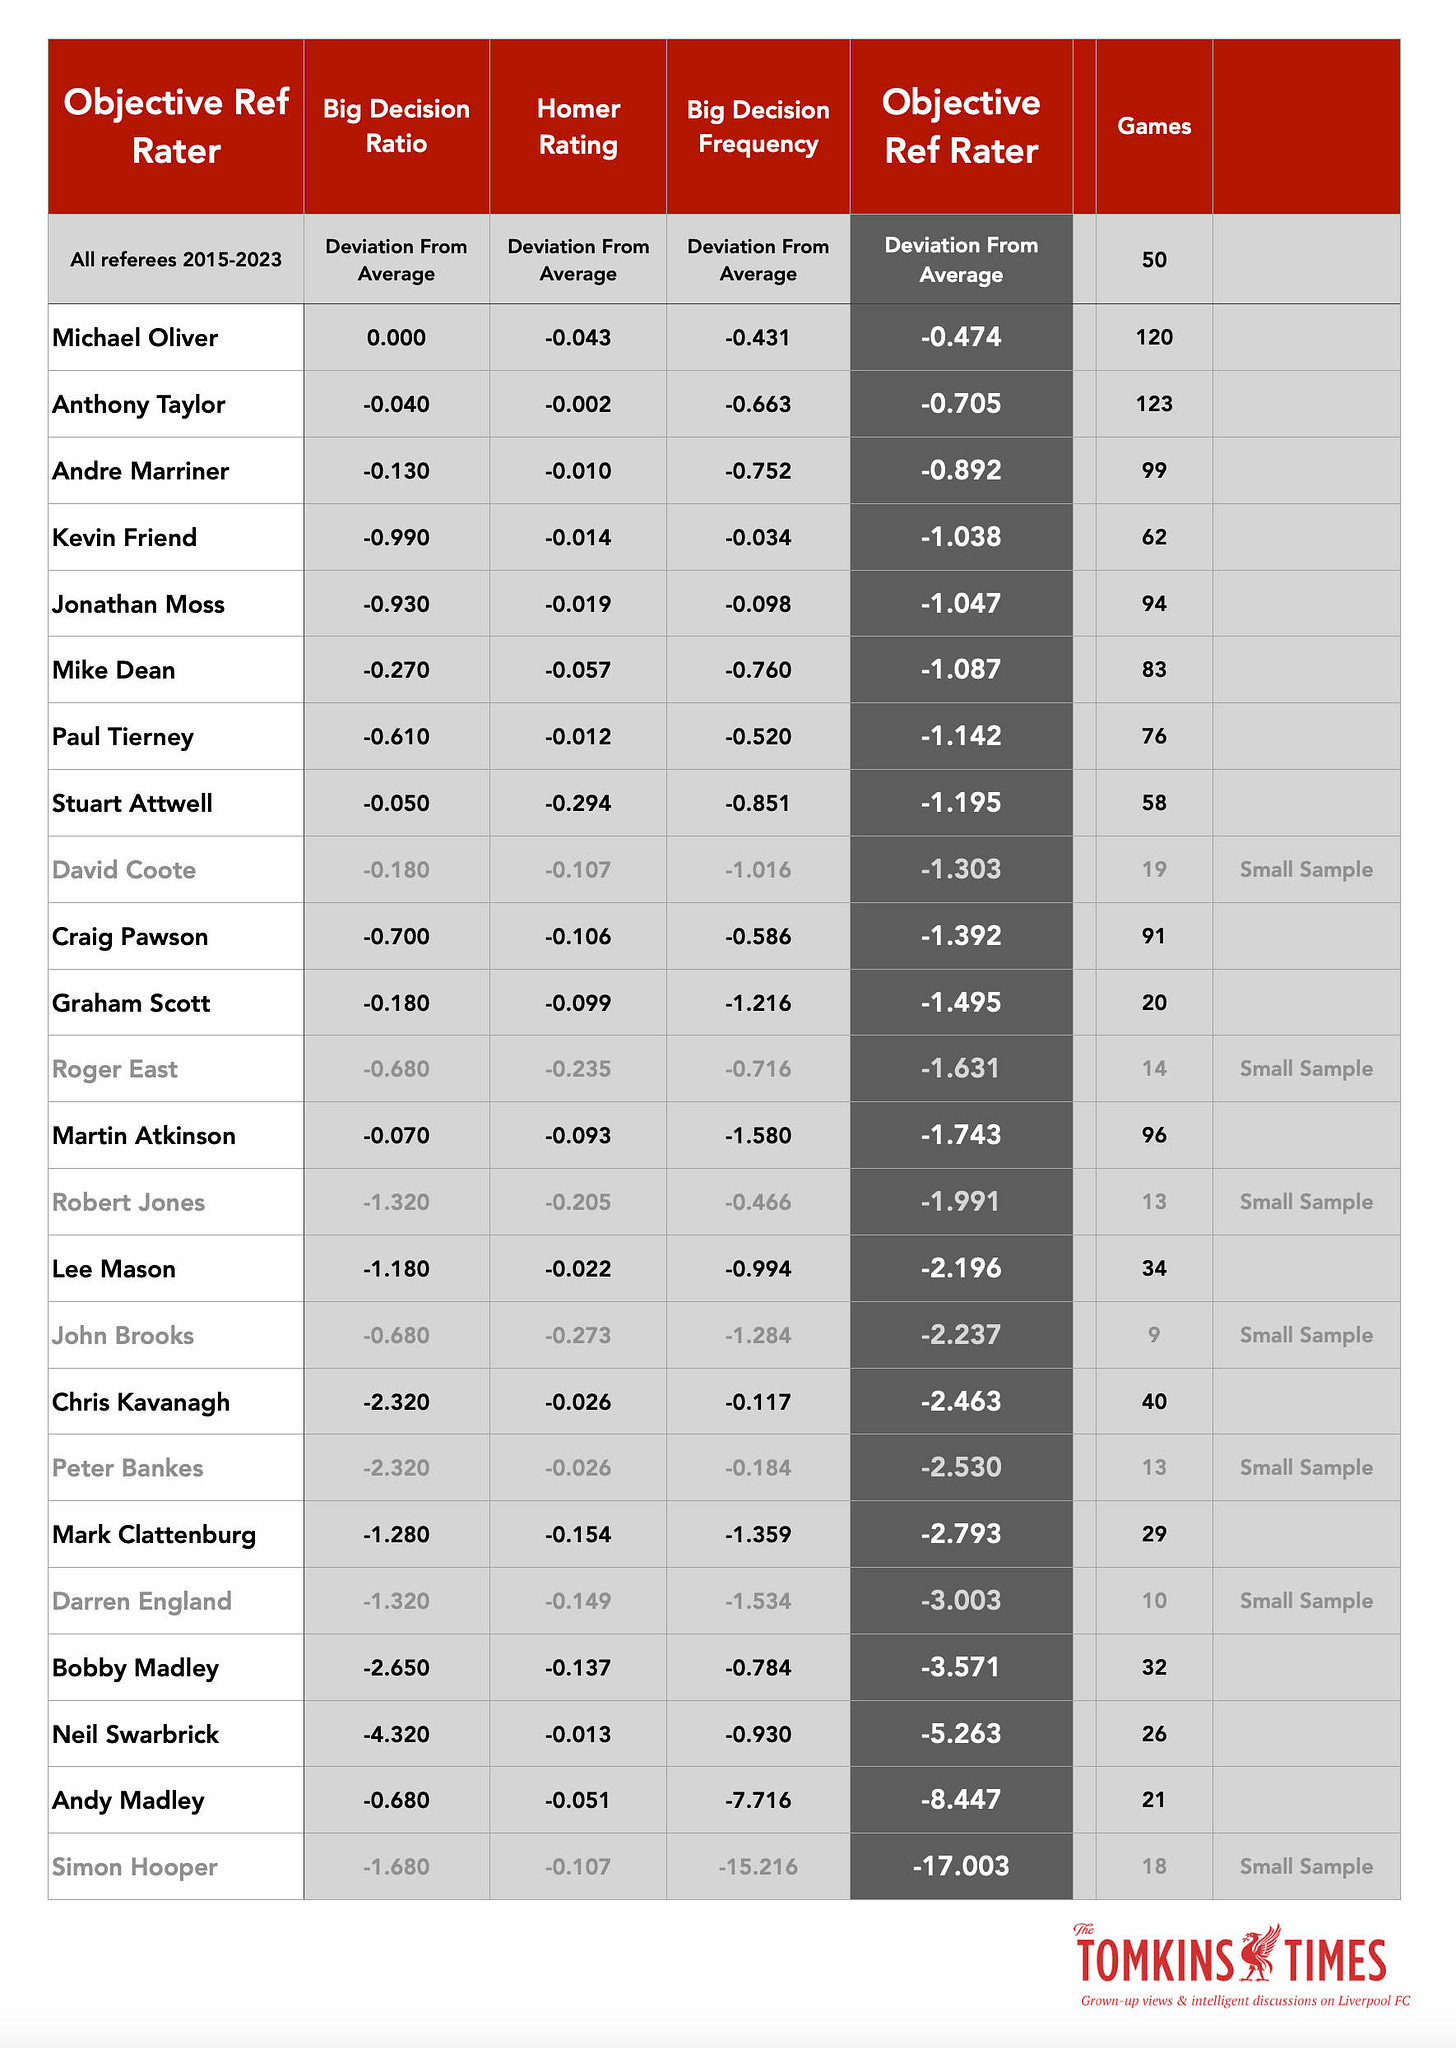
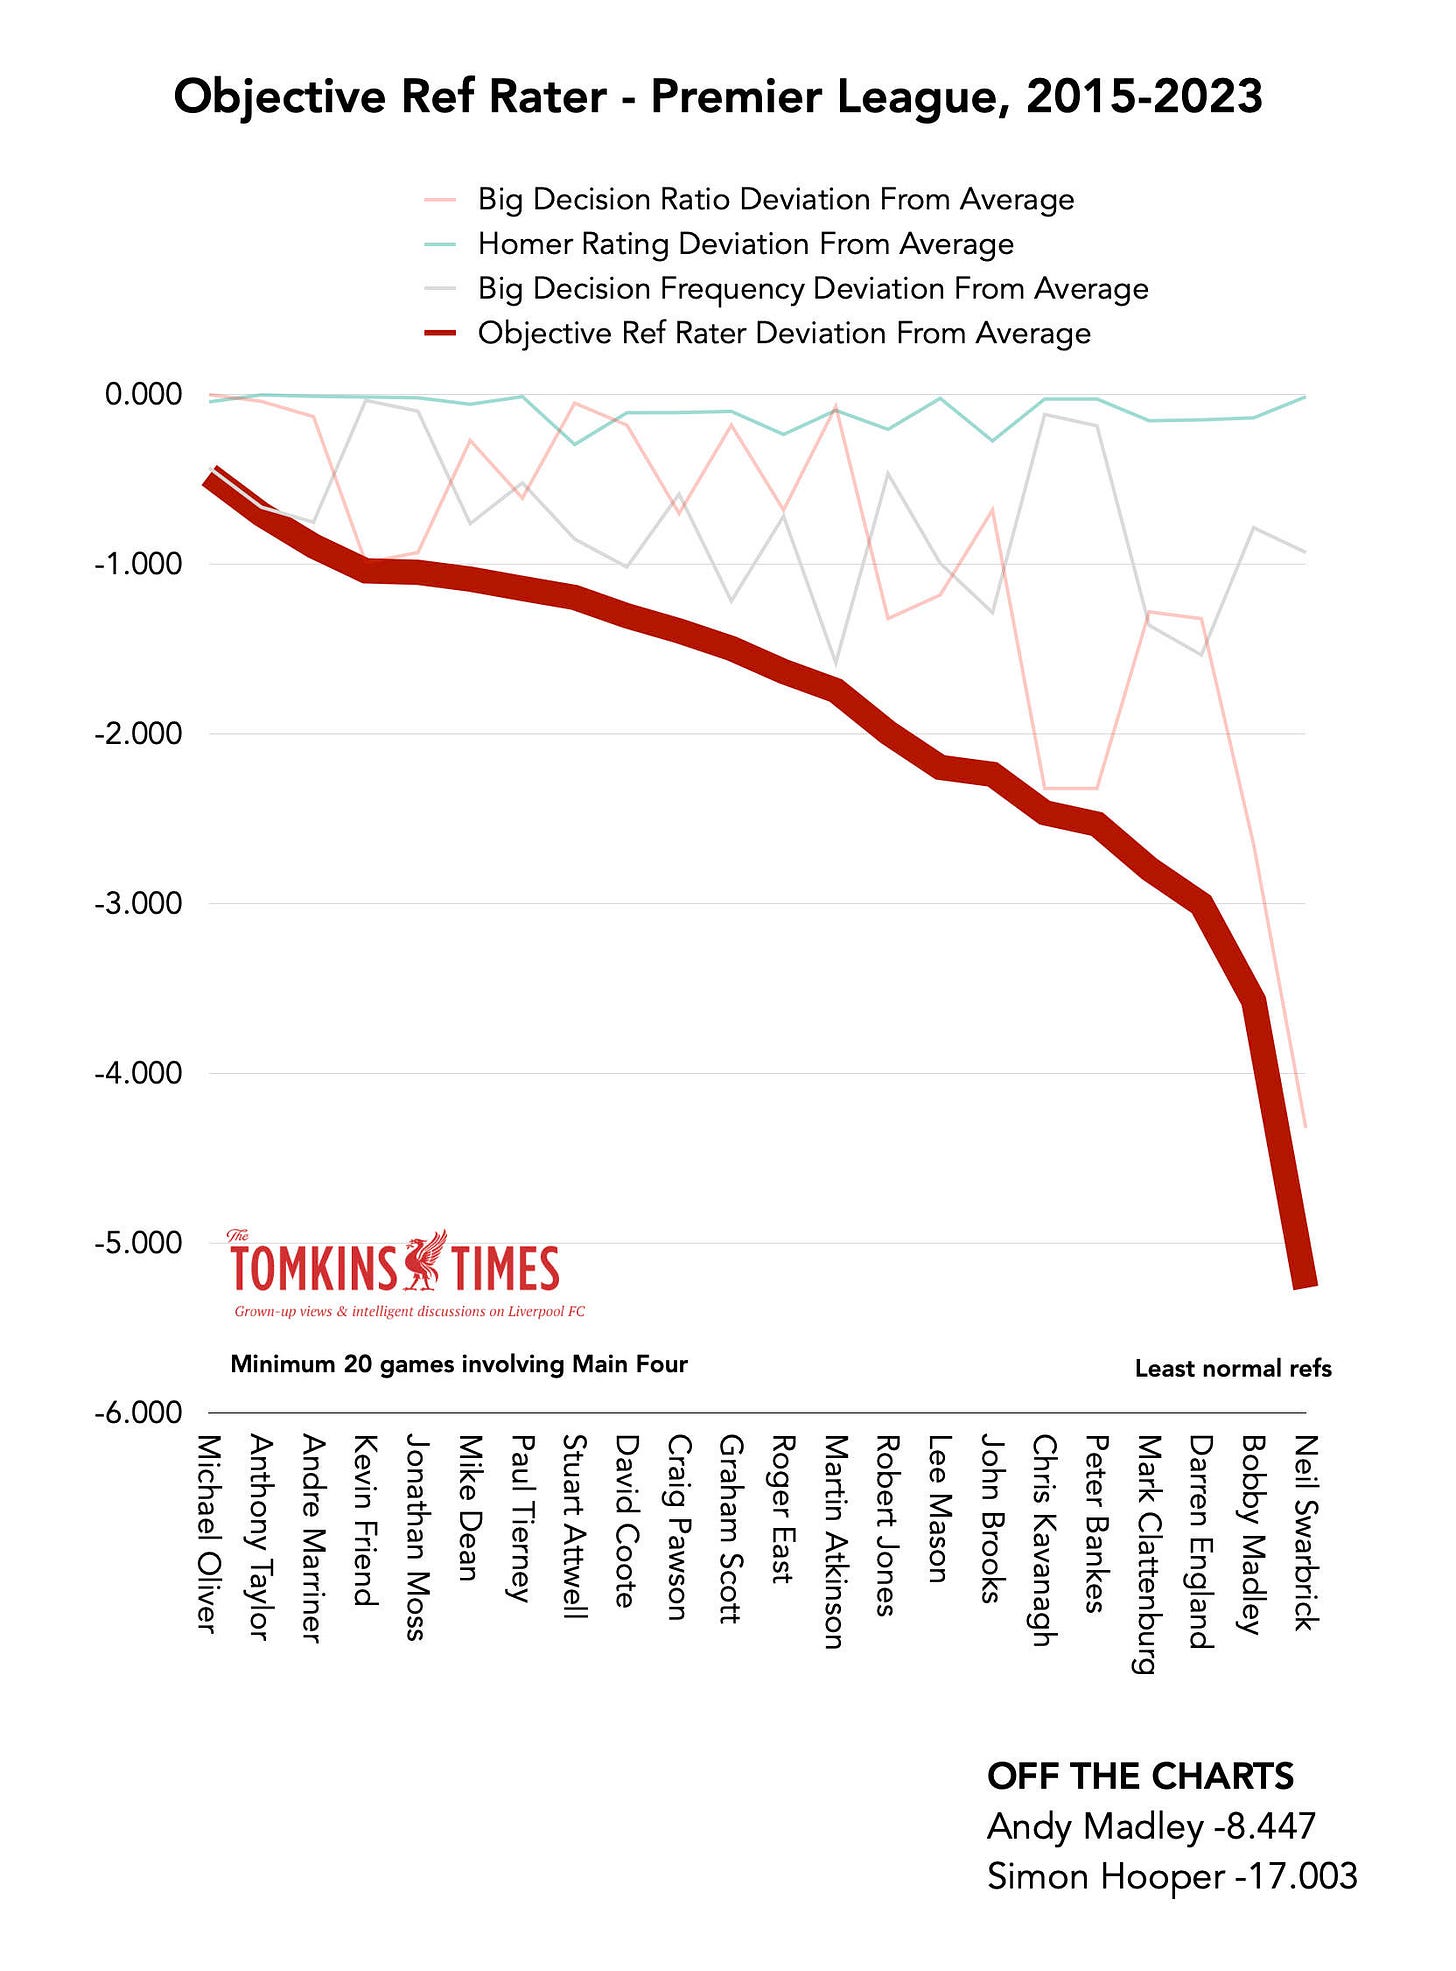
The best two referees via my Objective Ref Rater coefficient are Michael Oliver and Anthony Taylor; the two referees generally described, subjectively, as the best. This pair are very close to the expected norm, and I had no idea who would emerge as the top two. So it’s a good sign that the model is on the right tracks, even if no model can capture every aspect.
Those ranked 3rd and 4th are Andre Marriner and Kevin Friend respectively. (Both recently retired.)
Manchester City, with the best xG ‘GD’ by a reasonable distance, get the best Balance of Big Decisions. This is to be expected.
Liverpool, with the 2nd-best xG ‘GD’ by a reasonable distance, get the worst Balance of Big Decisions, at roughly 14 fewer than expected. This makes zero sense, which is why I’m looking into the reasons behind it, such as the following point:
If Liverpool only had the refs objectively ranked as the best, or ‘most normal’, the Reds’ figures would be less freakishly bad; the worst (weakest?) refs, who do more games than the better refs, are extra-bad for Liverpool, it seems.
Several of the worst-ranking refs from the model now work as VARs or for the PGMOL, training the current referees.
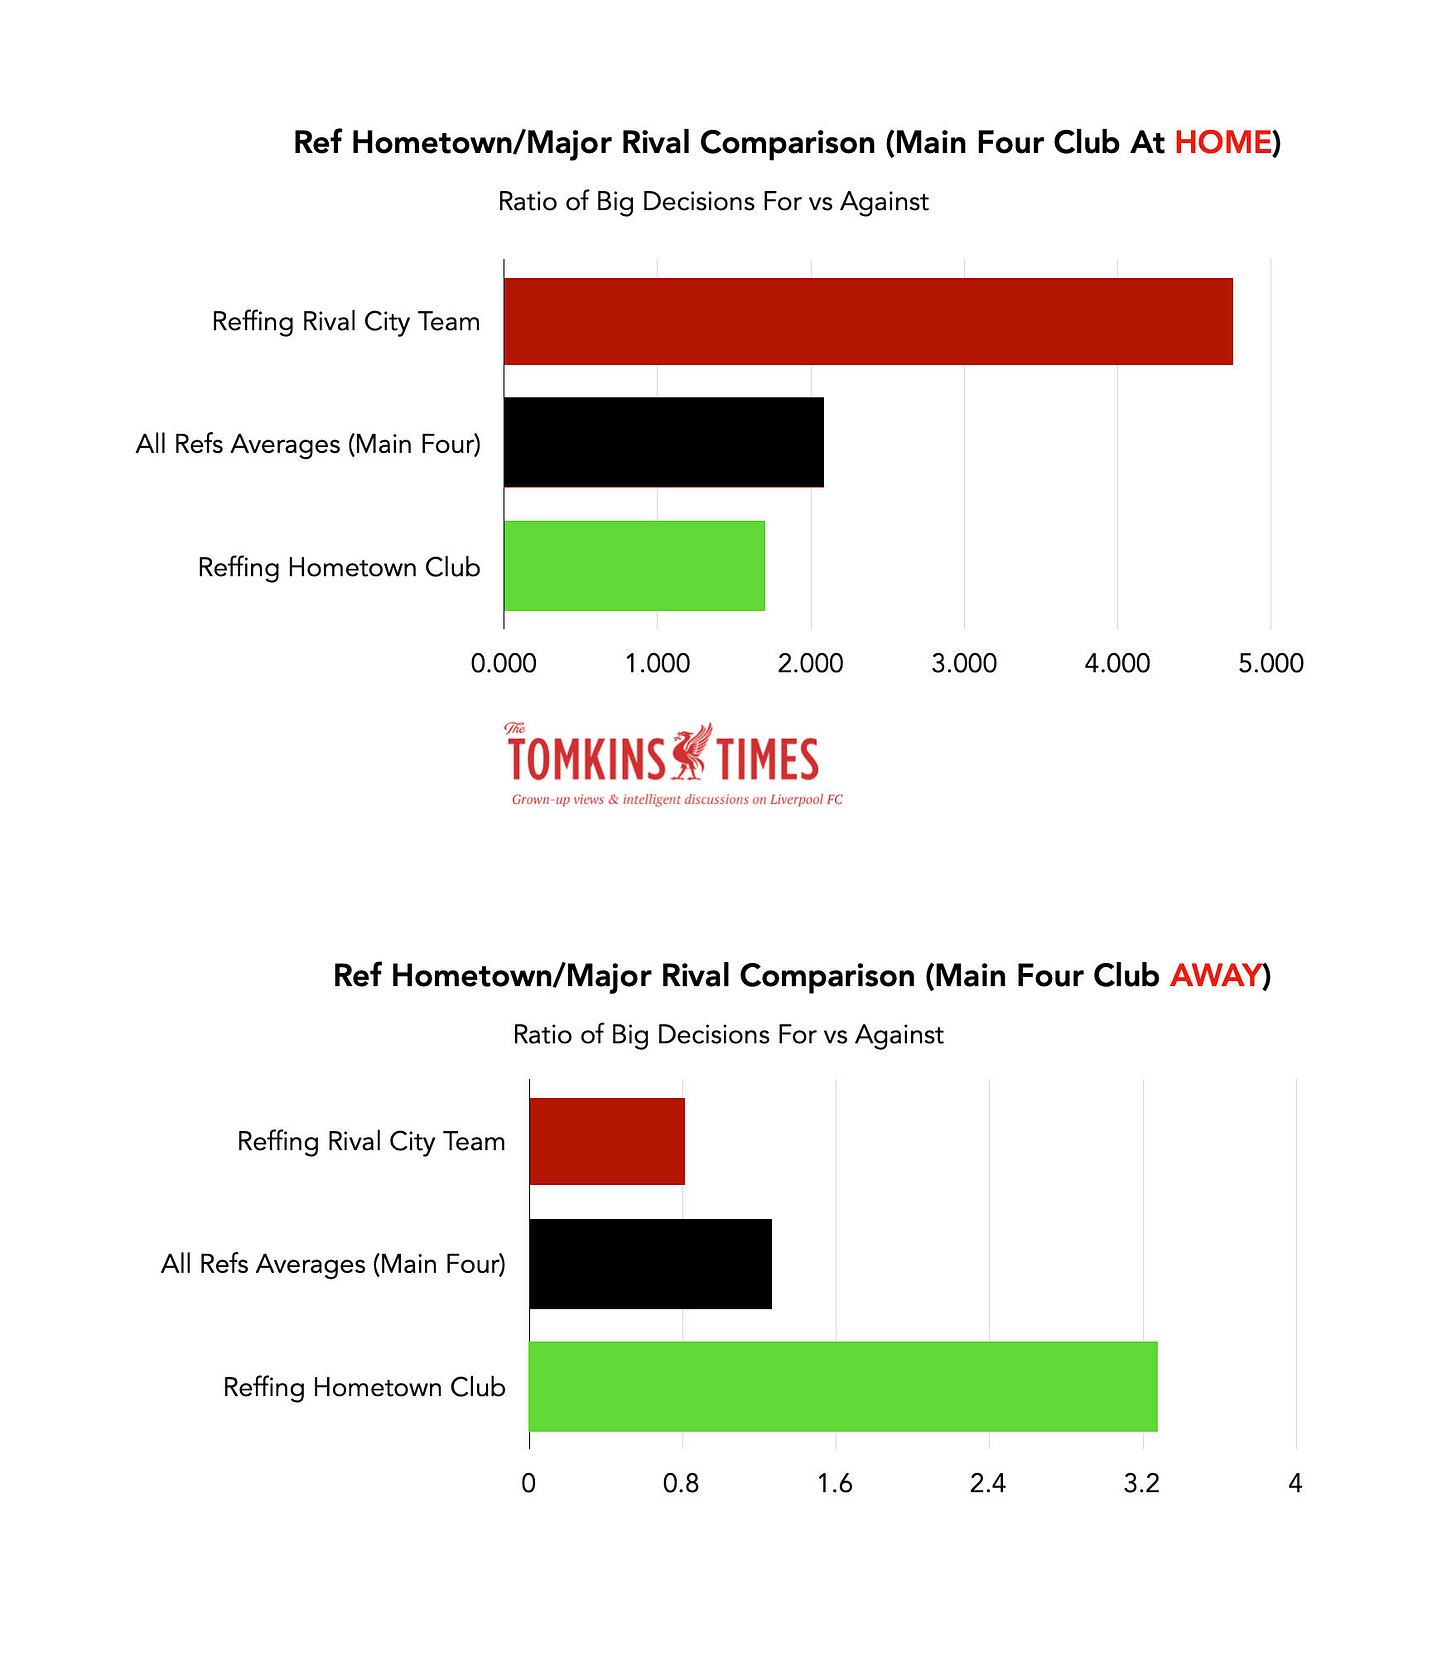
A finding of real interest is that, in general, Liverpudlian refs (or from Merseyside in general) are much more likely to give a Big Decision to Mancunian clubs in Manchester, but much less likely to give a Big Decision to Liverpool at Anfield (albeit the only Liverpudlian ref who has done Liverpool is Mike Dean.)
Similarly, showing the exact same bend-over-backwards-bias (which is why this is an alarmingly predictable problem!), a Greater Mancunian ref, in general, is much more likely to give a Big Decision to Liverpool at Anfield than to give a Big Decision at Old Trafford or the Etihad to the home Manchester club.
Conversely, a Liverpudlian ref is much less likely to give an away Big Decision to a Manchester club, and a Mancunian referee is much less likely to give an away Big Decision to Liverpool.
So, on this part of the study, we can say that “rival” refs are overly generous when at the home of the “enemy”, but then extra harsh on those clubs in away games, when not feeling the pressure to try and look as unbiased as possible.
Whatever the reason beyond my subjective theory above, the data involving Liverpudlian and Mancunian refs in games involving Liverpool, Man City and Man United suggests an inability to referee “normally”. These are the kinds of issues I’ve been concerned about for years, including the feuds officials have that they cannot disguise (unless really forced to).
Referees who have done c.100 Main Four games since 2015 see their data cluster more tightly together around ‘normal’, with no extreme outliers – but still quite a reasonable divergence, from c. +0.3 extra Big Decisions For per game for some club/ref combos and -0.3 for others. This is roughly half the levels reached by the positive and negative outliers.
As a general fact, the home/away split for all Premier League penalties 2015-2023 is: 461 home (56.77%), 351 away (43.23%). Home clubs have the advantage of their fans, a familiar pitch, less travel, etc., and you would expect some home advantage that is not indicative of a ref being a Homer. That normal split can be said to be c.57:43.
A referee will make a Big Decision in a match involving a Main Four club every 2.74 games, with the ratio, as noted, 1.68:1 in favour of the Main Four club.
At home, Big Decision likelihood For a Main Four club doubles on a trendline, from playing the best teams (0.10 extra Big Decision) to worst teams (0.20).
However, at home, the Main Four between 2015 and 2023 averaged 2.2 Big Decisions for every 1.0 against. These are the strongest teams, so should be above the general league frequencies.
Away, Big Decision likelihood For a Main Four club also doubles on a trendline, from playing the best teams to worst teams; but it starts from a lower expectancy rate (just under 0.0), and rises to an expectancy rate very similar with playing the better teams at home (0.10). The trendlines for home and away Big Decisions for the Main Four are absolutely parallel.
Only five referees out of the 22 to officiate Liverpool games since 2015 have given Liverpool a positive Balance of Big Decisions vs expectations. These just happen to include the four ranked objectively as the most ‘normal’ referees (Oliver, Taylor, Marriner and Friend); plus Bobby Madley, who hasn’t done a game for the Reds since 2017 due to suspension for inappropriate behaviour.
For the other three Main Four clubs, at least ten referees have given the club a positive Balance of Big Decisions vs expectations. (See scatterplot to follow.)
Of the refs who are way below expected Big Decisions for each of the four clubs (88 ref/club combinations), no fewer than ten of the harshest 17 are “referee/Liverpool” combinations. (This has now gone to 11 of 17, if adding Simon Hooper’s data from Spurs; a small sample size, as some of these are, but it’s a lot of similarly bad small sample sizes that add up to over 200 games.)
Without Oliver and Taylor, Liverpool’s Big Decisions Balance (in the remaining 200+ games) would be more akin to a team below mid-table.
A VAR will make a subjective Big Decision intervention (so, not including offsides, etc.) every 8.38 games, or three times as infrequently as a referee on the pitch. (Which makes sense, as the ref should be seeing the obvious things with no need for the VAR to do anything other than confirm.)
Liverpool get by far the fewest subjective VAR Big Decisions of the Main Four, perhaps to counter the misleading #LiVARpool narrative. (They do get the most offside overturns, as incorrect offside decisions involving Liverpool by a lino are massively higher than for the other three clubs. Again, this is interesting given what should have happened at Spurs this weekend, as is why assistant referees are so eager to flag.)
Stuart Attwell is also by far the biggest Homer, with almost all of his decisions going to whoever is at home: the Main Four team, or if an away game, the team at home against the Main Four side.
By some distance, Liverpool games feature the fewest Big Decisions. Also, the fewest VAR overturns. Also, the fewest yellow cards. Plus, the fewest penalties. (And no second yellow card for an opponent since 2015, when all other regular Premier League clubs have at least five, and Spurs are nearing 10.) At times it seems like referees and VARs are totally passive during Liverpool matches; this season it’s been like they’ve not actually been on duty when it comes to obvious errors.
Refs do not make anywhere near as many bookings at Anfield. At Anfield, away players are booked only 93.4% as often as they are at Old Trafford, 85.2% as often as they are at the Etihad, and 78% as often as at Stamford Bridge. This may partly explain why no opposition player ever gets a second yellow card (a Big Decision) when playing Liverpool, as they more rarely get the first.
Teams’ win percentages can still be high with ungenerous refs, and low with more generous refs. But on average, Big Decisions change results by a big margin.
Rankings for Premier League penalties won per season since 2015: 1 Manchester City; 2 Leicester City; 3 Brentford; 4 Manchester United; 5 Crystal Palace; 6 Brighton; 7 Nottingham Forest; 8 Chelsea; 9 Fulham; 10 Liverpool. Dispels myth that smaller clubs don’t get Big Decisions. (Palace, like some other clubs, also beneficiaries of lots of opposition red cards, and are the biggest beneficiaries of 2nd-yellows.)
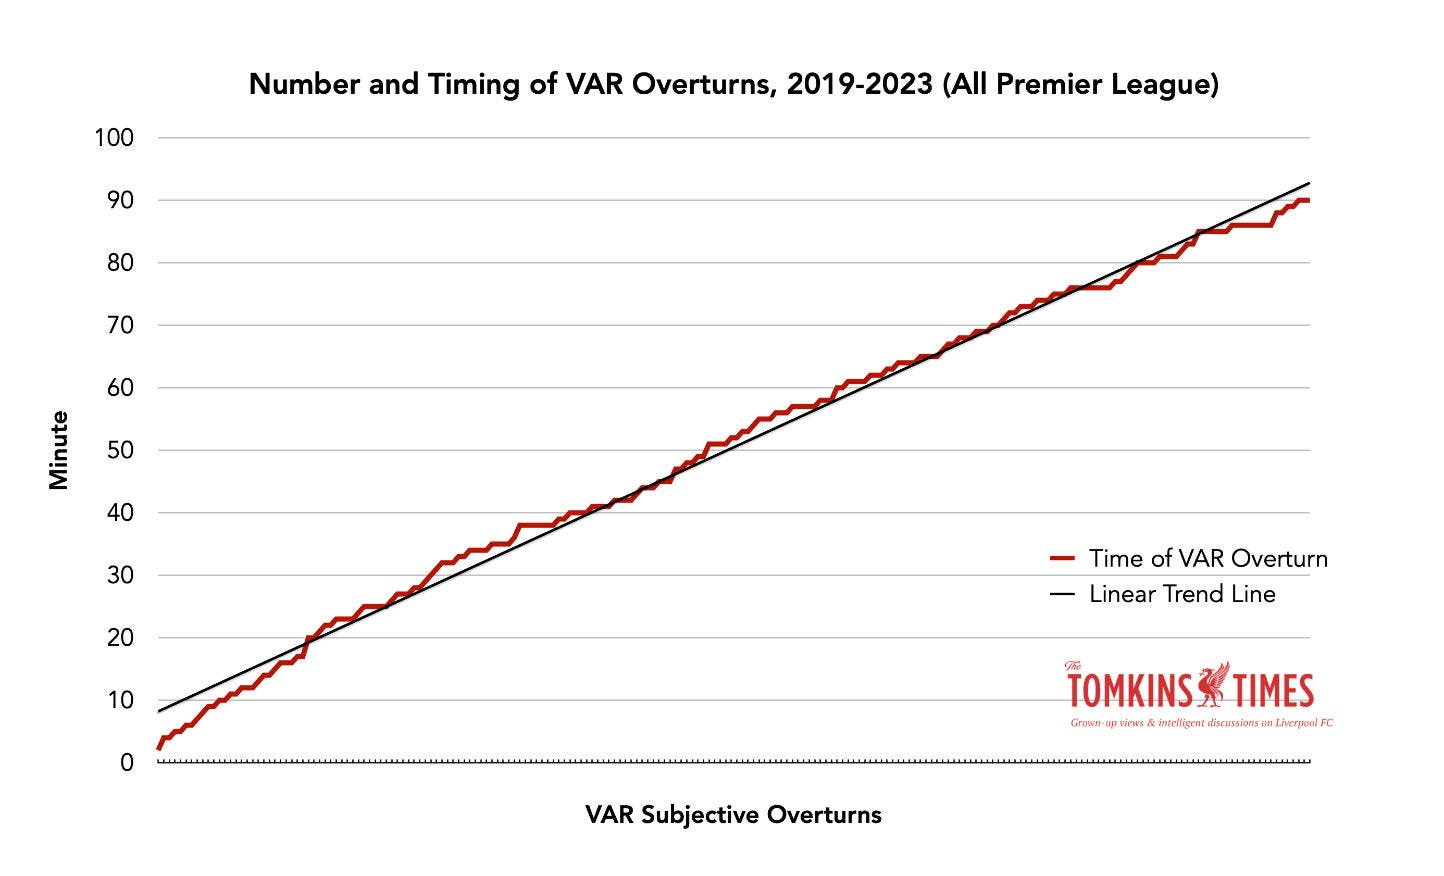
VAR Big Decisions tend to be consistent and steady within the timeframe of a match, with 2.62 overturns for every minute-time of the game (1-90); 236 subjective overturns in total as of early September 2023. (Involves some double-counting in Main Four head-to-heads.)
Subjective overturns have a natural distribution that makes for a lovely logical graph – but only after the first 20 minutes; the first ten minutes sees very little action, as if it’s deemed too early to intervene (just as a bad early tackle is more likely to be given as a yellow card by the on-field ref).
Liverpool games involve fewer VAR subjective calls than the average of the other three Main Four teams.
Excluding offsides and handballs, so focusing purely in fouls and other physical player-to-player decisions (“Subjective Player-To-Player Big Decision”), Liverpool’s VAR balance is -2. All the other clubs have a positive balance.
Only Chelsea have to wait longer than the Reds for a Subjective Player-To-Player Big Decision, at 45 minutes to Liverpool’s 43. Man City have to only wait 12 minutes for their first For; as do Man United.
The average time of Subjective Player-To-Player Big Decisions For for Chelsea and Liverpool is over the 60-minute mark. For the Manchester clubs, it’s under 50 minutes.
As such, the treatment by VAR of Chelsea and Liverpool is vaguely similar, but Chelsea do better. The treatment of those two clubs in contrast to the Manchester club is alarming. What is going on?
Anfield has seen Liverpool have just three VAR Subjective Player-To-Player Big Decisions For the Reds.
The other Main Four clubs have a subjective VAR Big Decisions balance of between +5 and +11. Liverpool’s was zero, but is now -1.
Penalties vary in relation to quality of teams involved; red cards do not.
One thing I showed a couple of years ago was that over a seven-year period and 600 Premier League penalties, foreign defenders were penalised more than expected (based on share of minutes played), and homegrown attackers won far more penalties than expected (again, based on share of minutes played). So it’s not helpful to have foreign strikers and foreign defenders if you want Big Decisions.
… And, much more. But ironically for a study on referees, I’ve started to go blind whilst researching and writing this. (Perhaps the PGMOL will invite me to join them?)
Please forgive any typos, and any factual errors will be corrected (if someone is awake on the TTT VAR).
In truth, I wanted to spend a bit longer honing this, after months of work, but the longer I took in completing it, the more out of date the data would then become, which would then need reworking, and it becomes a never-ending cycle.
And then the staggering, unprecedented events at Spurs meant it was better to publish and be damned while the iron is hot and before the horse has bolted from Goldilocks’ barn of mixed metaphors.
What follows next are the data, the graphs and some analysis.
The Full Monty
New Details for Calculating Refereeing Performance
As with previous refereeing analysis, I collected all data from Transfermarkt’s expanded view on each referee’s data. I went back and recollected it all.
(This is Simon Hooper’s page for Liverpool, albeit I’m only focusing on Premier League games since 2015. Interesting to see that he’s given one penalty in a match involving the Reds, and that was for … Shrewsbury. But it’s not counted in this study.)
This time, rather than just looking at a referee’s overall record, I wanted to split it down into four different sections:
Home games against teams 1-10 in the table at the time of the game*
Home games against teams 11-20 in the table at the time of the game*
Away games against teams 1-10 in the table at the time of the game*
Away games against teams 11-20 in the table at the time of the game*
* This is generally less accurate earlier in the season, for obvious reasons, but it can flip both positively and negatively in each category. Occasionally a ‘weak’ team will be in the top ten and a ‘strong’ team in the bottom half, but this tends to be for the first few weeks of the season. It still evens itself out, as I will show in a later graph. This is used simply because Transfermarkt lists the league positions at the time of the game in their data, and it’s therefore a very helpful piece of information already in the dataset.
From this, I was able to create an Expected Decisions tally that correlated with fixture difficulty; and easier games generally mean more Big Decisions For. On average, there Balance of Big Decisions when facing a top team away will be just under 0.0 per game; then the odds of a Positive Big Decision Balance rise all the way to 0.20 per game for home games against the worst teams; or an extra Big Decision (Balance) every five games.
What I found is that some refs do pretty much only the ‘easier’ games for the Main Four, and some do pretty much only the ‘harder’ ones. So they need to judged on the games they do; if a ref only does Man City at home versus the worst teams, more Big Decisions for City are to be expected.
All refs are then judged against Expected Decisions, with the total number of those compared to the Actual Big Decisions. Any deviation from the norm can then be highlighted.
As noted elsewhere, there is some double-counting, in that if Anthony Taylor does Man City vs Man United, he is only reffing one game; but he is reffing two teams. And if he gives a penalty to one team, that goes down as a Big Decision For that team, and a Big Decision Against the other.
Why the Main Four
Some things I considered:
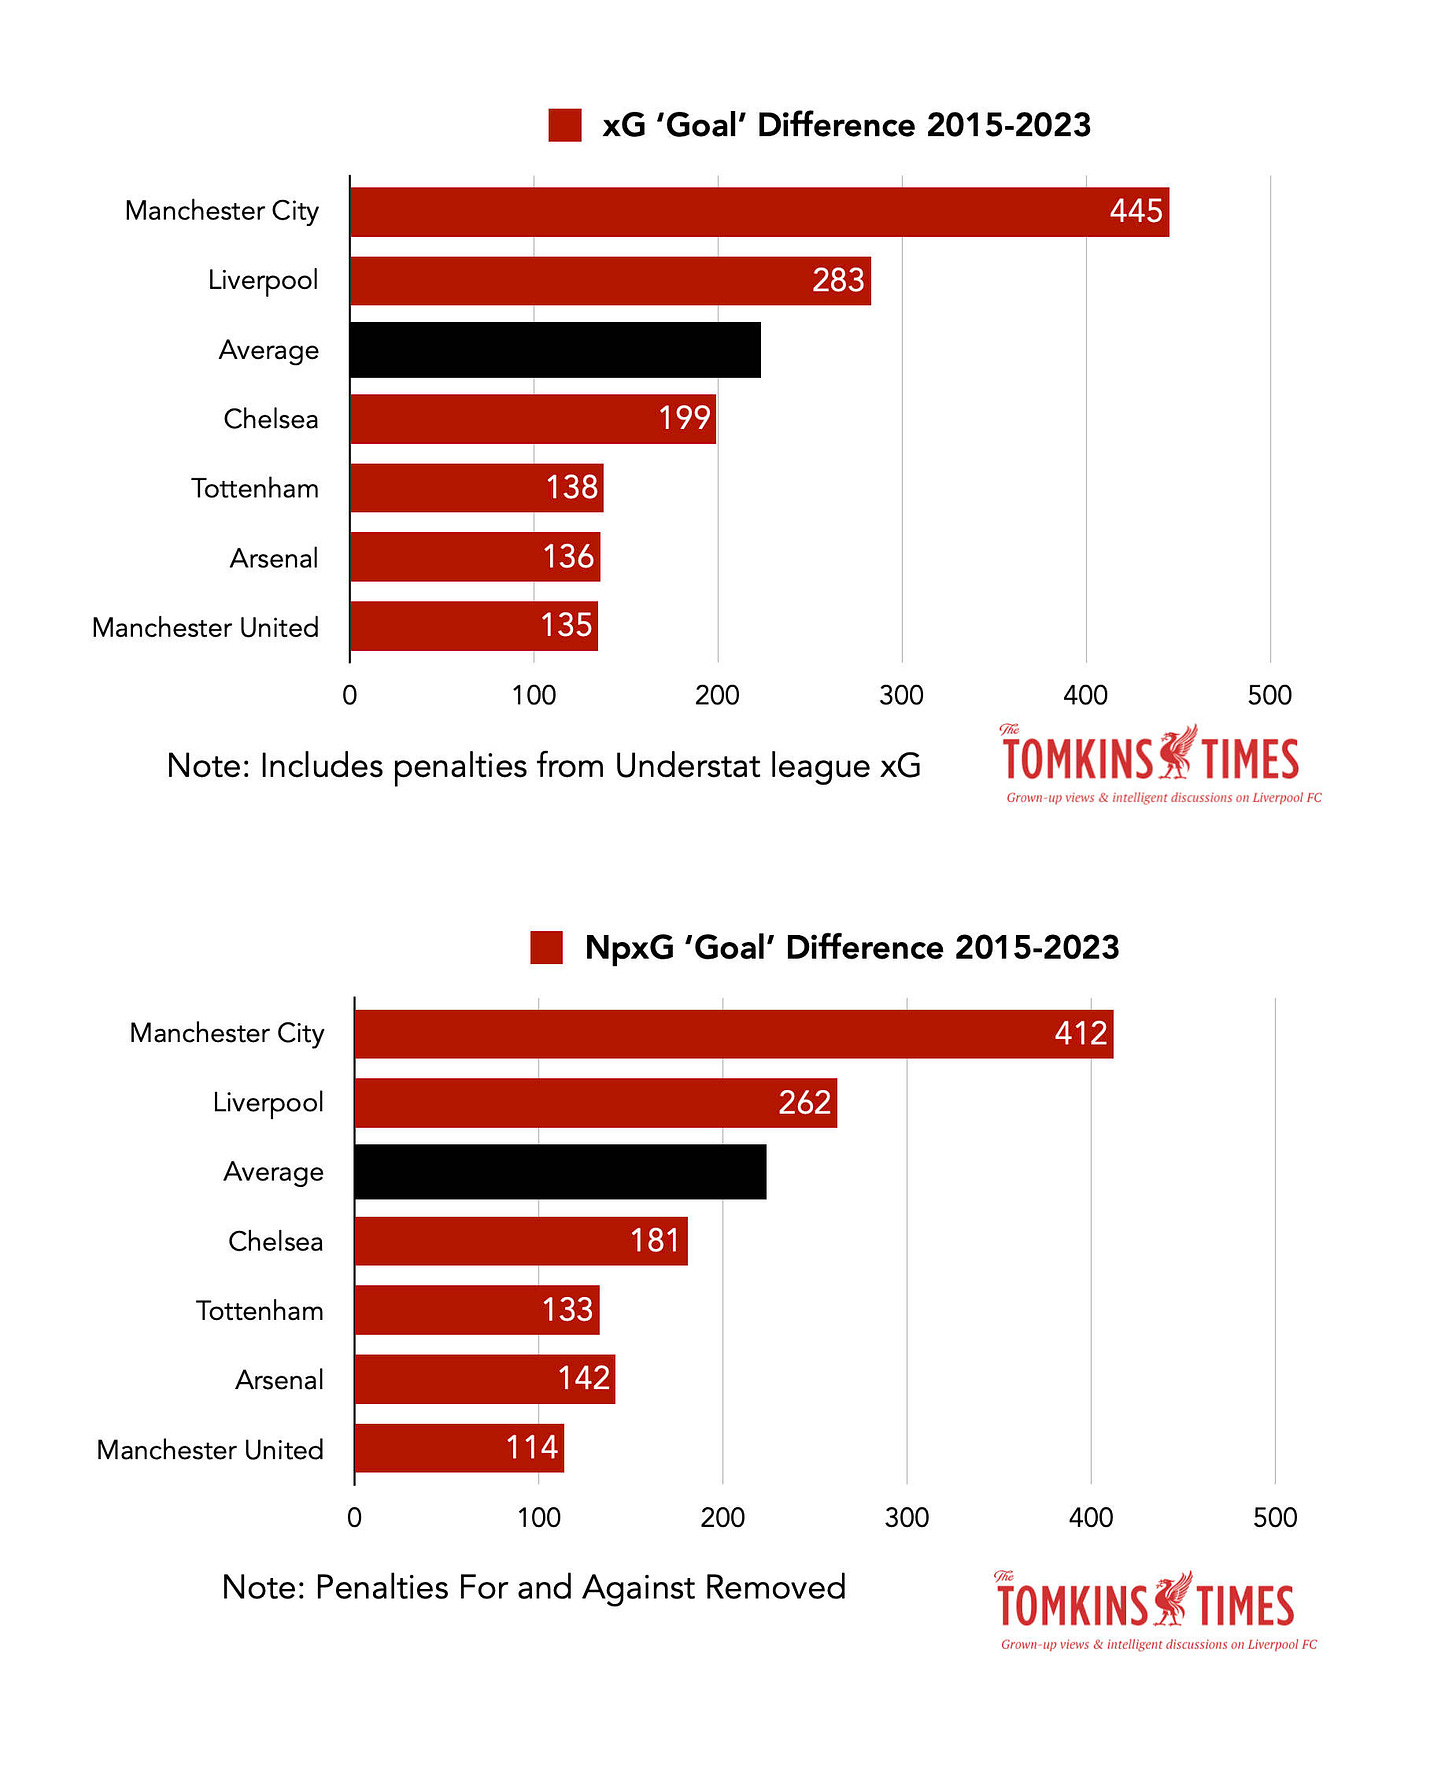
Who had the best xG Balance, to suggest they should be getting the most penalties and conceding the fewest?
Who got a lot of penalties, and thus needed including, to try and work out why that might be?
Who were the best clubs between 2015-2023, to be able to group together the strongest quartet, given that less-good sides should be receiving fewer Big Decisions if they aren’t very good?
Then, whose qualities can be measured in other ways? While Arsenal and Spurs are part of the Big Six, I stuck with the Main Four, as I called them.
Excluding the qualifying rounds, the Champions League games played by the clubs since 2015 at the time of writing are: Man City (90), Liverpool (65), Chelsea (57), Spurs (43), Man United (39) and Arsenal – more recently on the rise as a team – way down (17).
I think league results can be damaged with the extra demands of Champions League football, albeit it also brings greater financial reward.
Next, given the proliferation of referees from the northwest (13) and zero from London, focussing on the Manchester clubs (as well as obviously on Liverpool) made extra sense, to investigate any potential bias for their hometown club or what I’ve long called bend-over-backwards-bias against it.
To me, npxG is the best metric, as unlike actual goal difference, it counts all the chances each game has; so it’s a better reflection of dominance, and less likely to be skewed by 1-0 wins where someone had a shot from 45 yards that deflected in off six players. But I’ve supplied graphs of both xG and npxG.
To be clearer, xG (npxG = without penalties) means a lot of in-box action is captured, including efforts that may be blocked with handballs and potential to trip players.
Ex-ref Peter Walton stated on BT Sport that you’d expect the better teams to get more decisions, and that applies to Manchester City. But it doesn’t apply to Liverpool, which is why I wanted to get to the heart of the issue..
Average league finishing position works against Chelsea as a Main Four contender, but they are significantly ahead of Spurs and Arsenal on xG, and have played 3x as many Champions League games as Arsenal, and over a dozen more than Spurs at the time of writing. These are the average league finishing positions:
Manchester City 1.75
Liverpool 3.63
Manchester United 4.13
Tottenham 4.63
Arsenal 5.13
Chelsea 5.25
Only Manchester United outside of the Main Four I have chosen haven’t won the title in the period 2015-2023.
All told, the Main Four make sense to focus on, and someone is welcome to redo the study including other teams, most notably Arsenal and Spurs.
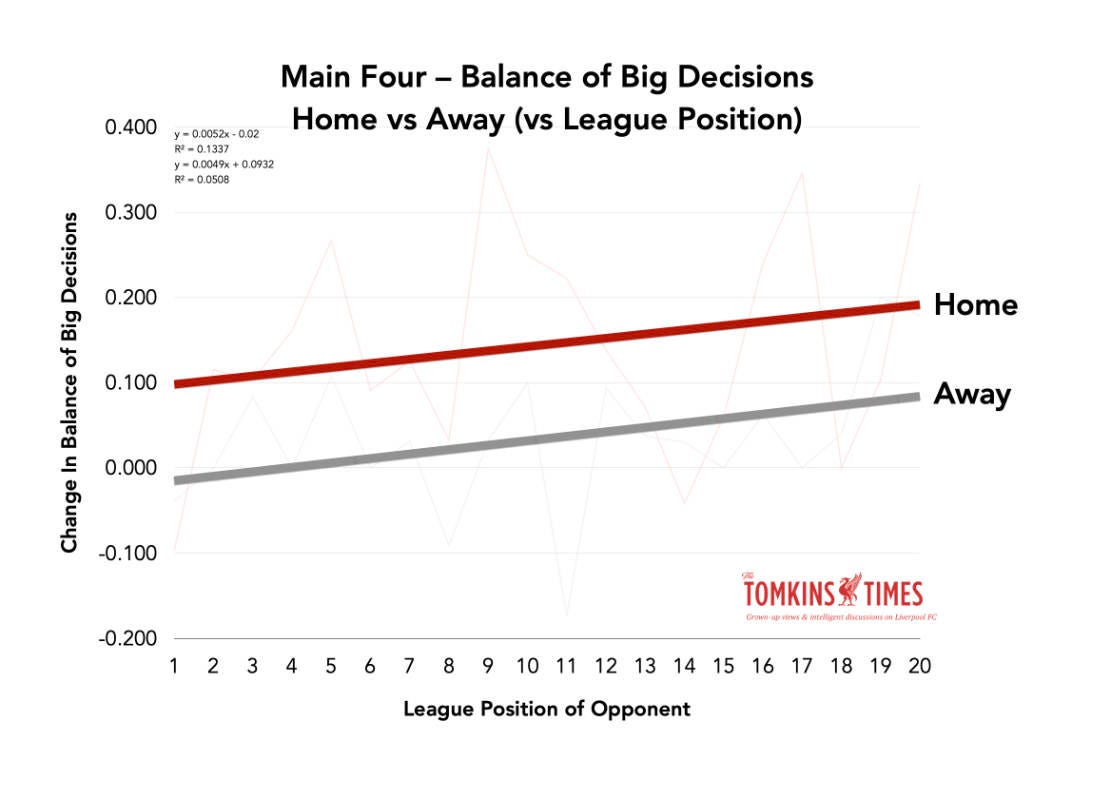
Main Four – Balance of Big Decisions – Home vs Away (vs League Position)
As mentioned earlier, this is the frequency of Big Decisions relating to home and away, and against better and worse teams.
The change in Balance of Big Decisions increases (using a linear trendline) for the Main Four at virtually the exact same rate home and away when the average league position of the opposition at the time of the game is factored in.
The worse the opposition, the better the Balance of Big Decisions per game. From +0.1 balance of big decisions at home vs team that’s higher in the table to +0.2 for teams 20th. And for away, from just under 0 to just under +0.1.
This means that a Main Four club should be getting 0.2 extra Big Decisions per game home at relegation fodder, or a Balance of Big Decisions of +1 every five games, and away against the same opposition, 0.1, or a Balance of Big Decisions of +1 every 10 games. Yet at away to a lower side will see a similar Balance of Big Decisions to when at home to a good side.
This makes it possible to create four different groupings for fairer expected Big Decision Balance: home vs teams 1-10 in the league, home vs 11-20; away vs 1-10; away vs 11-20.
This is important to establish as a base-rate for decision-making.
Big Decisions Change Results
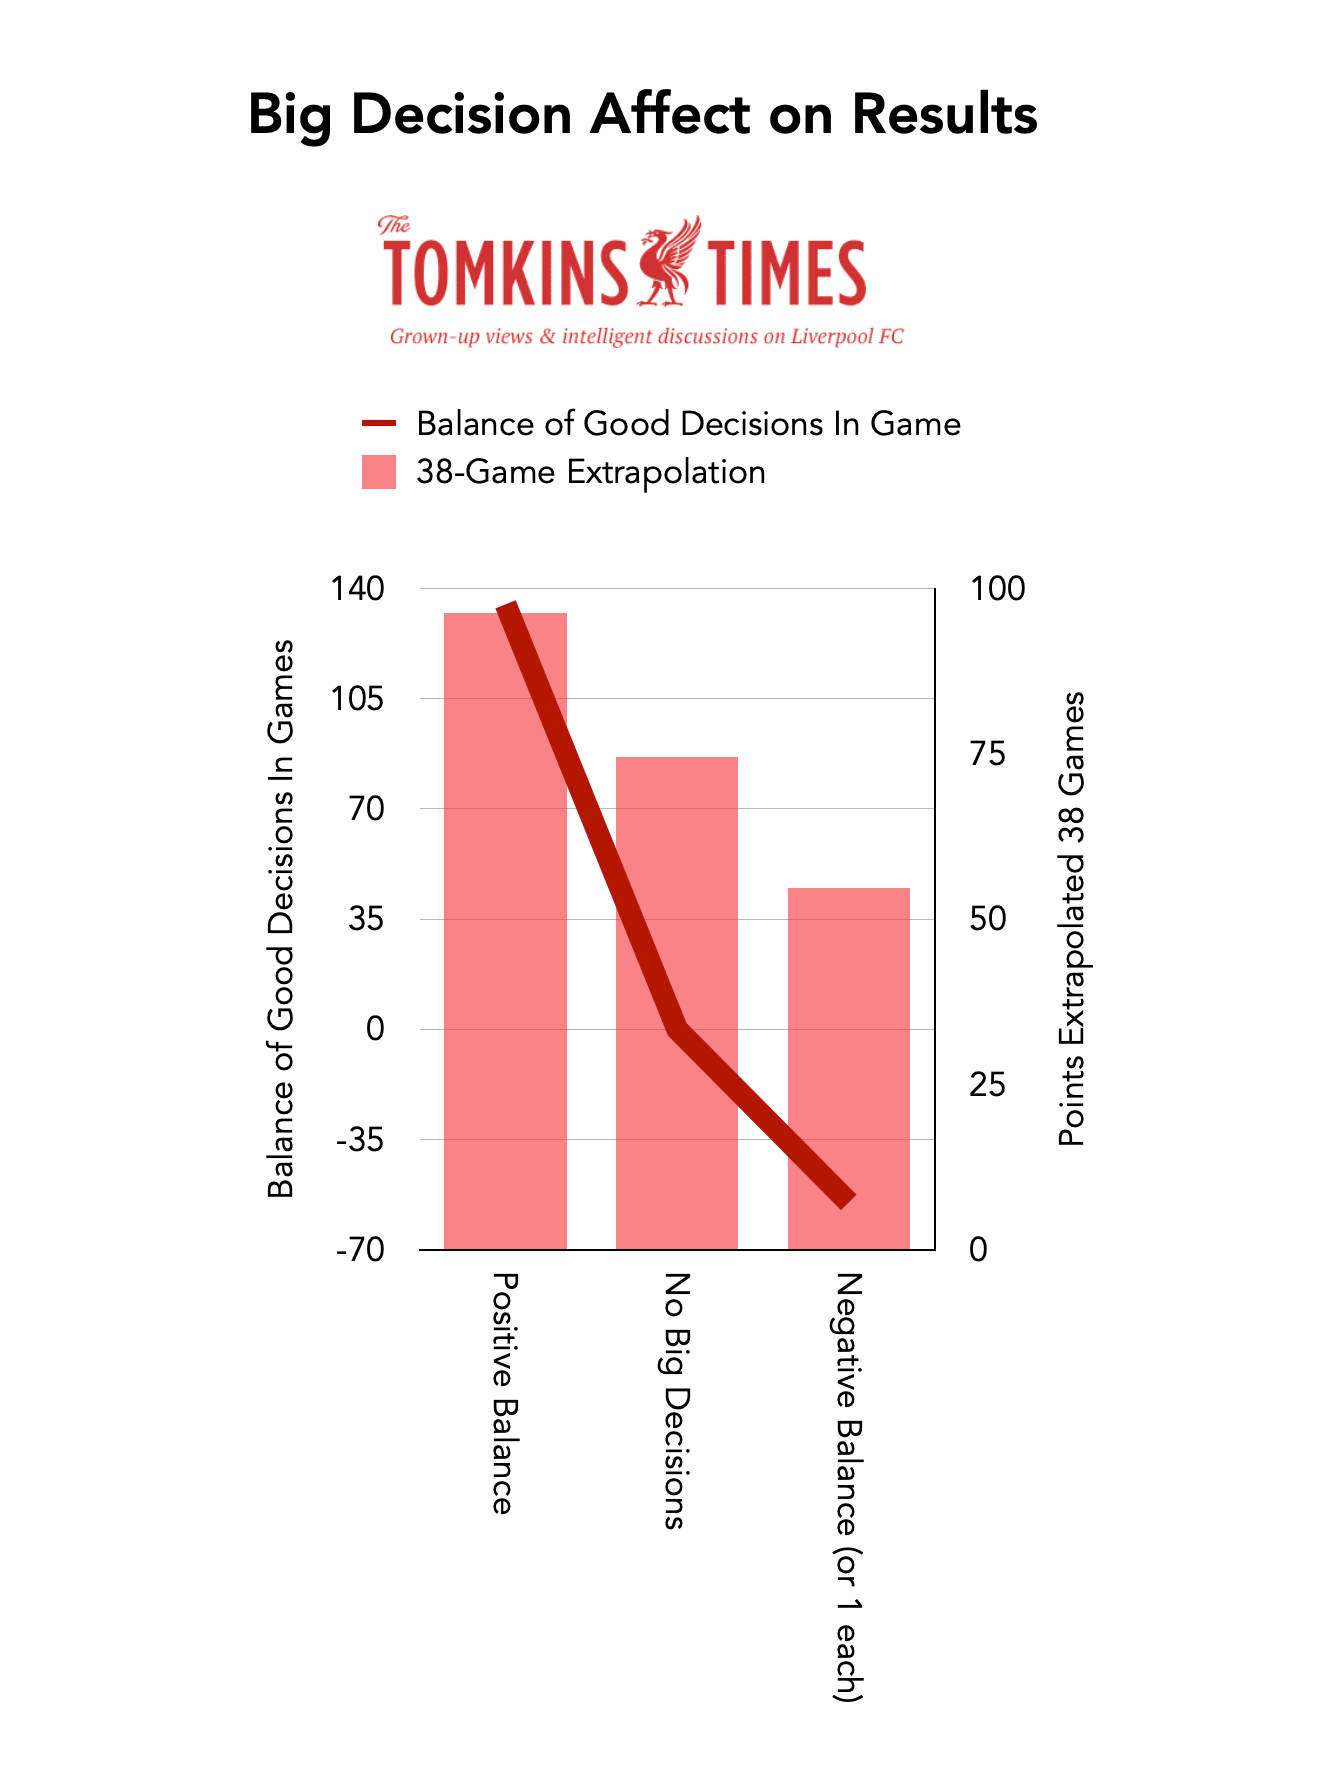
So, on average, what is a Big Decision to your team worth, and what does one Against cost?
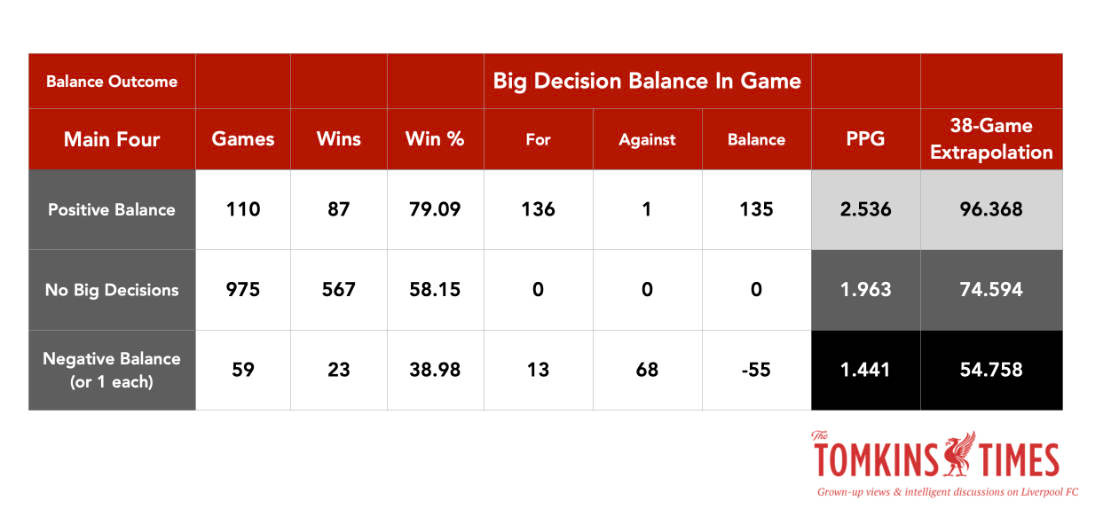
In a sample of 1,144 games for the Main Four, 975 matches had no Big Decisions, while 59 had a balance of Big Decisions within the game that was negative for either Liverpool, Man City, Chelsea or Man United. (For some reason this dataset excluded Kevin Friend, but his decision rate is fairly normal. He’s in all the other datasets.)
Almost twice as many games, 110, had a Positive Big Decision balance within the game for the Main Four.
In the For category, 136 decisions were made in favour of the clubs in 110 games; so sometimes multiple penalties, or a penalty and a red cards. There was one single Big Decision against a Main Four club in a game where the Main Four club still had a positive Balance of Big Decisions (so two or more for them, vs one against).
There were 13 games when a Main Four club had a Big Decision, but still had fewer or the same number of Big Decisions in the matches (68 went against them in those 59 games).
Note: I didn’t look into if any of the Big Decisions that were penalties were missed or scored (but presumably c.80% were scored given the sample size, and would thus be close to the mean for the league and football in general). I also didn’t look at the timing of any red cards, where one after ten minutes would have a much greater effect than one in the 90th minute. (This all seems horribly topical.)
This is just the data. The score at the time of any decision is also not factored in, but these are things that could obviously be looked into in more detail (if someone has the time).
The difference between a Main Four club with no Big Decisions in their favour and a positive balance is 0.6 of a point. A negative balance of Big Decisions in a match costs a Main Four club -0.5 of a point when compared to no Big Decisions either way.
And the difference between having a Positive and a Negative Balance of Big Decisions within a match is -1.1 point.
When extrapolated, basically, a Positive Balance of Big Decisions in a match comes out at virtual title-guaranteeing form; no Big Decisions For or Against is likely to see a team finish around 4th; while facing a Negative Balance within games would mean mid-table at best.
1.441 ppg – 54.8 season pro rata 38 games
1.963 ppg – 74.6 season pro rata 38 games
2.536 ppg – 96.4 season pro rata 38 games
So Big Decisions are huge. They are indeed Huge Decisions.
Expected vs Actual
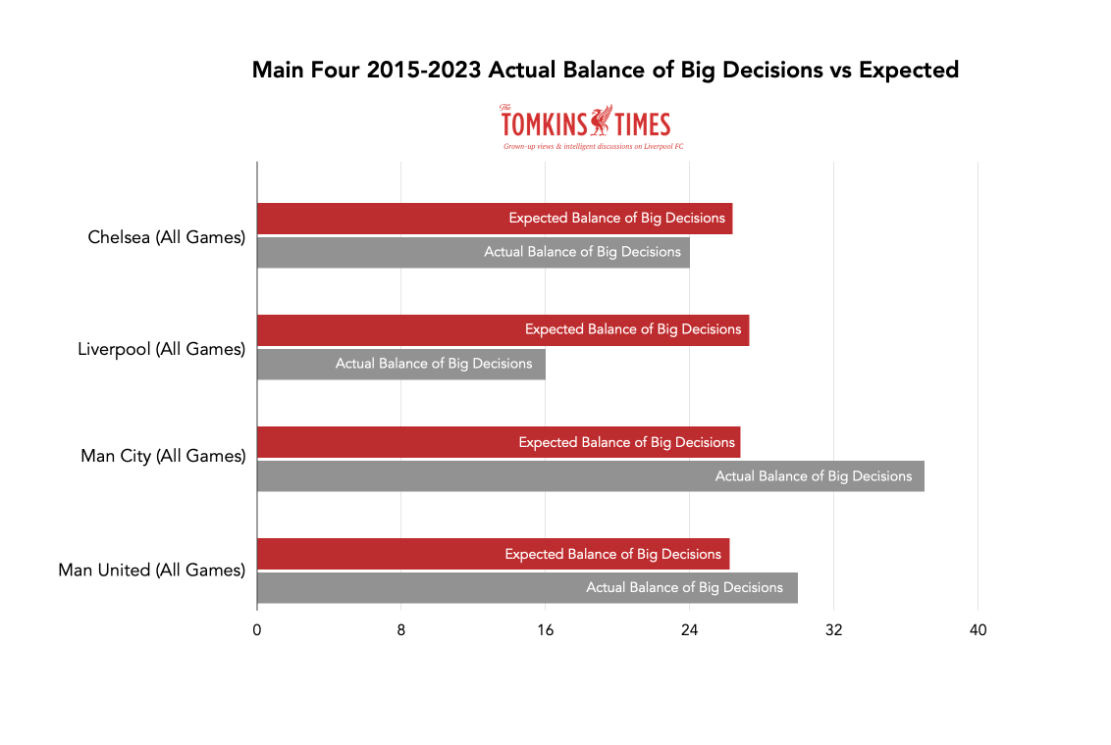
Since 2015, and based on the averages for the Main Four, Liverpool ‘should’ have had 68.82 Big Decisions For, and 41.51 Against.
The Against is spookily accurate: 39. (Now over 40 after the two at Spurs.)
But the For has 14 missing Big Decisions in the Reds’ favour. These are penalties, straight red cards and second yellows.
Indeed, all of the Main Four, with all refs, have very similar Against data, when judged against the benchmark of average Big Decisions for the Main Four.
(All clubs have the same expected Big Decisions For and Against per game, as it’s the average; but the slight variation comes from a different number of games they have played, with referees who have only done a couple of games excluded from the study. But pretty much everything in this study is to a per-game basis.)
Expected Big Decisions Against vs Actual
Liverpool 41.51 (39 actual) -2.51
Chelsea 39.67 (39 actual) -0.67
Man City 40.53 (44 actual) 3.47
Man United 40.46 (40 actual) -0.46
Only Man City are out by a few percentage points, to their detriment.
But when it comes to Positive Big Decisions, or Big Decisions For, this is where the Liverpool curse kicks in. Most just don’t like giving Liverpool Positive Big Decisions.
Expected Big Decisions For vs Actual
Liverpool -13.82
Chelsea -3.03
Man City +13.67
Man United +3.35
Almost 14 missing penalties to Liverpool (and/or red cards to opponents) over an eight-year period, or getting up towards two per season. That the Reds have been punished by 2.51 fewer decisions Against than expected (again, until the trip to Spurs!) still means a net harm of over 11 missing Big Decisions in the Reds’ favour.
As noted elsewhere in this study, a positive balance of 11 Big Decisions for your team is worth an average of seven points (0.6 per Big Decision Per Game), but it all depends on when they were given.
Considering that Liverpool lost two titles by 1-2 points, and missed out on the top four in 2022/23 by four points, this could be massively costly in terms of league titles and, less likely but not impossible, Champions League participation in 2023/24.
Seven points might not sound a lot across eight seasons, but if just a couple of those points were distributed in a tight-run campaign, a lot could have changed.
That said, looking at Decisions For, Man City are at +13.67 since 2015, but they are that far ahead of the average of Chelsea, Man United and Liverpool in xG (and pretty much all other metrics) that they should probably be well ahead in the pack of four, from which the benchmark average is set. So that seems fair enough.
However, Liverpool are also ahead, on average, of the combined average xG differences of Chelsea, Man United and City.
Yet the other three clubs’ combined average of Big Decisions For is 4.66 more than expected; Liverpool’s is -13.82. That’s the issue - the smoking gun, the magic bullet, the bombshell and the rug ripped from right underneath the Reds.
And it’s not just the Reds’ negative figure, but Man City’s positive Balance; much of which they merit, but this:
Liverpool -13.82
Man City +13.67
… in terms of Balance of Big Decisions 2015-2023 (with Chelsea and Man United in between) is still seriously flawed.
That said, Liverpool won the league with 99 points and just five penalties in 2019/20, so in stark contrast with the title bid of 2013/14 (when Brendan Rodgers’ team won 12), not with the help of officials.
(As I’ve noted many times, Liverpool win more penalties with more English players, and every single season since 2004 that either Rafa Benítez or Jürgen Klopp has managed, the Reds rank lower in the penalty league table than the actual league table; but for the other years, the Reds finished higher in the penalty table.)
Man United won 14 penalties in 2019/20 and 12 the season before, albeit City’s distribution is more steady.
And of course, red cards is another area where the Reds are weirdly treated; especially 2nd-yellows for opponents, which is basically no longer a thing for Liverpool opponents. (I’ll keep repeating: the last, at the time of writing, was eight years ago: Sadio Mané, for Southampton.) Refs seem to have little problem giving Liverpool players a second yellow.
Even now, during Klopp’s tenure, Man United have had 15 extra Big Decisions For, compared to Liverpool. And Anfield seems to play a big part in the weirdness.
So anyway, let’s get on to the Objective Ref Rater, now that I’ve explained the frequency of Big Decisions.
Objective Ref Rater - Premier League, 2015-2023
My thinking: take 1,200 league games since 2015 involving a Main Four club (Liverpool, Man City, Man United and Chelsea), and then the VAR records since it was introduced in 2019, and you should find that the ‘average’ for referees and VARs in terms of Big Decisions should be the ‘best’; or certainly ‘the norm’.
Outliers will continue to out-lie, and the normal results will cluster to the mean.
As such, a lack of deviation from the mean can be used to measure which referees are the best, or most consistent, or most ‘normal’; as such, I combined three different metrics to create an objective coefficient from the 1,200 games:
Difference to the team’s Ratio (Big Decisions For vs Against);
Difference to Homer Average;
Games Per Big Decision (For or Against) Deviation From Average, to show overactive or under-active refs.
To restate an earlier fact, on average, a Main Four team will get 1.68 Big Decisions For for every one Big Decision Against. Or, 1.68:1.
So, this is the Big Decision Ratio.
There is also a standard rate of home/away for Big Decisions, which is 1.3 to the home team for every 1.0 for the away team; irrespective of who is home or away.
In terms of penalties for all clubs in the Premier League since 2015, it’s 57% to the home team, 43% to the away team.
• 461 home (56.77%), 351 away (43.23%).
Both of these increases from the lower figure to the higher figure (1 to 1.3, and 43% to 57%) are around 28%. So in this study, that frequency holds true.
(An online percentage calculator says the difference of 1 and 1.3 is a 26.086956521739% increase, for those who like their after-decimal-point action.)
Interestingly, in 95 Main Four head-to-heads, there have been 14 Big Decisions For the home team and 11 Against. That seems seems quite close, but the gap is once again an increase of 27.7%
However, overall, the Main Four between 2015 and 2023 at home average 2.2 Big Decisions for every 1.0 against.
That’s to be expected with a gulf in class in at least half the games (if not more), as well as home advantage. A relegation-zone team will not likely win more Big Decisions at home than a mid-table team, and ditto a Main Four side, but all clubs go into the 57:43 ratio.
As such, I have created a Homer Rating, again to see who deviates most, by giving fewer or more than Expected Big Decisions home or away (and home decisions are more frequent, naturally, but there’s a point beyond which a referee starts to look like a total Homer).
Finally, how often does a ref make a Big Decision? Is he overactive, avoidant, or like the proverbial bowl of porridge, just right? Big Decision Frequency is the final objective measure of the three.
Taking the differences to the norm for each of these three metrics to combine them into one coefficient gives us the Objective Ref Rater.
Note: the differences to the norm were all converted to minus figures, as an indication of how much from the norm they deviated, rather than if they were above or below the norm (in order to standardise the three components together, and to avoid two deviant figures equalling each other out, albeit that sentence sounds like a night out in some weird suburb).
The results follow below, in a table then a graph.
(Simon Hooper had by far the most deviant score, at -17.003, but had only done 19 Main Four games at the time of data collection, giving one single Big Decision. He has since done Liverpool at Spurs, to reach the 20 milestone, and boy did he do that in “style”. I won’t update the chart here.)
In the next section I’ll focus in on the more regular refs, with 40 or more Main Four games.
Minimum 40 Games Involving Main Four
The more games a ref does, the better his sample size will be; and a lot of the noise is from smaller sample sizes. But you can find refs who have given as many Big Decisions to the Main Four side at home in six games as in 40; Darren England with five in six for Man City, Martin Atkinson with five in 40.
(Weirdly, as the most active referee per game, England is the least active VAR per game. Again, I wrote all this before Spurs, FFS!)
As such, you wouldn’t have wanted Martin Atkinson as your home ref if you were a Main Four club, before he retired. Simon Hooper, the least active ref, has yet to give a Main Four side a Big Decision in 11 home games (and just one away). Indeed, of the refs to do over 40 Main Four games, Atkinson’s Big Decision rate is twice as infrequent as the next-worst.
Michael Oliver is virtually bang-on with Big Decision Ratio and Homer Rating, and only a little off on Big Decision Frequency.
The best three refs have also done the most games, albeit there is some chicken and egg here, as the best refs should be chosen to do the Main Four more often. (Not that the refs are likely judged by any metrics like this, but instead, on something far more arbitrary and perhaps subjective.)
But two refs with 90+ games (the refs in this section average 85.6) rank near the foot.
Jonathan Moss scores better than expected, as he gave a relatively normal balance of Big Decisions to home teams, but in a whopping 94 games between 2015 and his whistle-hanging in 2022, he gave a scarcely believable 15 Big Decisions to the Main Four and a whopping 20 Against.
Still, it’s a good job Moss isn’t involved in refereeing anymore.
(Checks: “He is currently the Select Group 1 Manager at the Professional Game Match Officials Limited PGMOL.”)
Martin Atkinson has a perfectly logical ratio at 1.75, but he also shows why it’s not wise to ever just focus on one metric (which is why the Objective Ref Rater combines three).
Still, it’s a good job Atkinson isn’t involved in refereeing anymore.
(Checks: “He is currently the Select Group 1 Coach at the Professional Game Match Officials Limited PGMOL.”)
By contrast, Oliver and Taylor average a Big Decision (For or Against) at a rate of just over every second game.
Of all the refs with the most logical ratios, Atkinson becomes a massive outlier at a Big Decision award at a rate twice as infrequent as the main two (one every 4.36 games), and of course, in Liverpool games he was even more of an outlier: one every 8.67 games (as I noted many times, after Steven Gerrard lambasted him in his 2015 autobiography and Klopp took charge at Liverpool, Atkinson may as well have been wearing a blindfold when doing Liverpool games. Prior to that book in 2015 he had a very normal rate of Big Decisions in Liverpool games.)
In addition, one thing I started to delve into but which was proving too time consuming, was to work out every single referee’s actual decisions adjusted for those made by the VAR. (I did this for a handful of refs – the most immediately interesting ones – before running out of time and energy.)
Five of the penalties awarded ‘by’ Martin Atkinson were actually called by VARs. So of the already-low 22 Big Decisions he made between 2015 and 2022, only 17 were ‘his’. (He also didn’t do much as the VAR, either; just one single overturn in 11 Main Four games.)
Still, at least the awful Lee Mason, ousted as a VAR after some glaring errors, is not involved with referees anymore. Mason once tried to give a penalty as the VAR against Fabinho for a clean tackle in the Fulham box, which was dismissed by the referee when sent to the monitor, for a rare rejection of an overturn.
(Checks: Mason “is currently Referee Coach at the Professional Game Match Officials Limited PGMOL.” Holy mother of God!)
But almost every referee will have areas (and/or clubs) where in smaller sample sizes their data is more extreme.
Chris Kavanagh just meets the 40-game cutoff, and his Big Decision Ratio is what works against him, a 4:1 in favour of the Main Four (since the data was collected he’s also given a penalty to Liverpool, albeit a stonewaller).
Meanwhile, Stuart Attwell’s Homer rating is almost 3x the figure for the next-highest Homer. Attwell is not particularly harsh on Liverpool (albeit he’s more generous to the other three clubs), but he’s worth his own section.
Michael Oliver, Anthony Taylor and Andre Marriner are significantly more normal than the rest of the pack, with a reasonable gap between each, and Kevin Friend who follows in 4th.
Paul Tierney’s overall data is fairly normal, but in his case, the contrast between his record for Liverpool (as both a ref and a VAR) and the other Main Four clubs is what leads to my constant questioning of his suitability.
(And that’s without various other incidents, albeit again, Tierney has his own section to follow.)
Scatter Thy Seed!
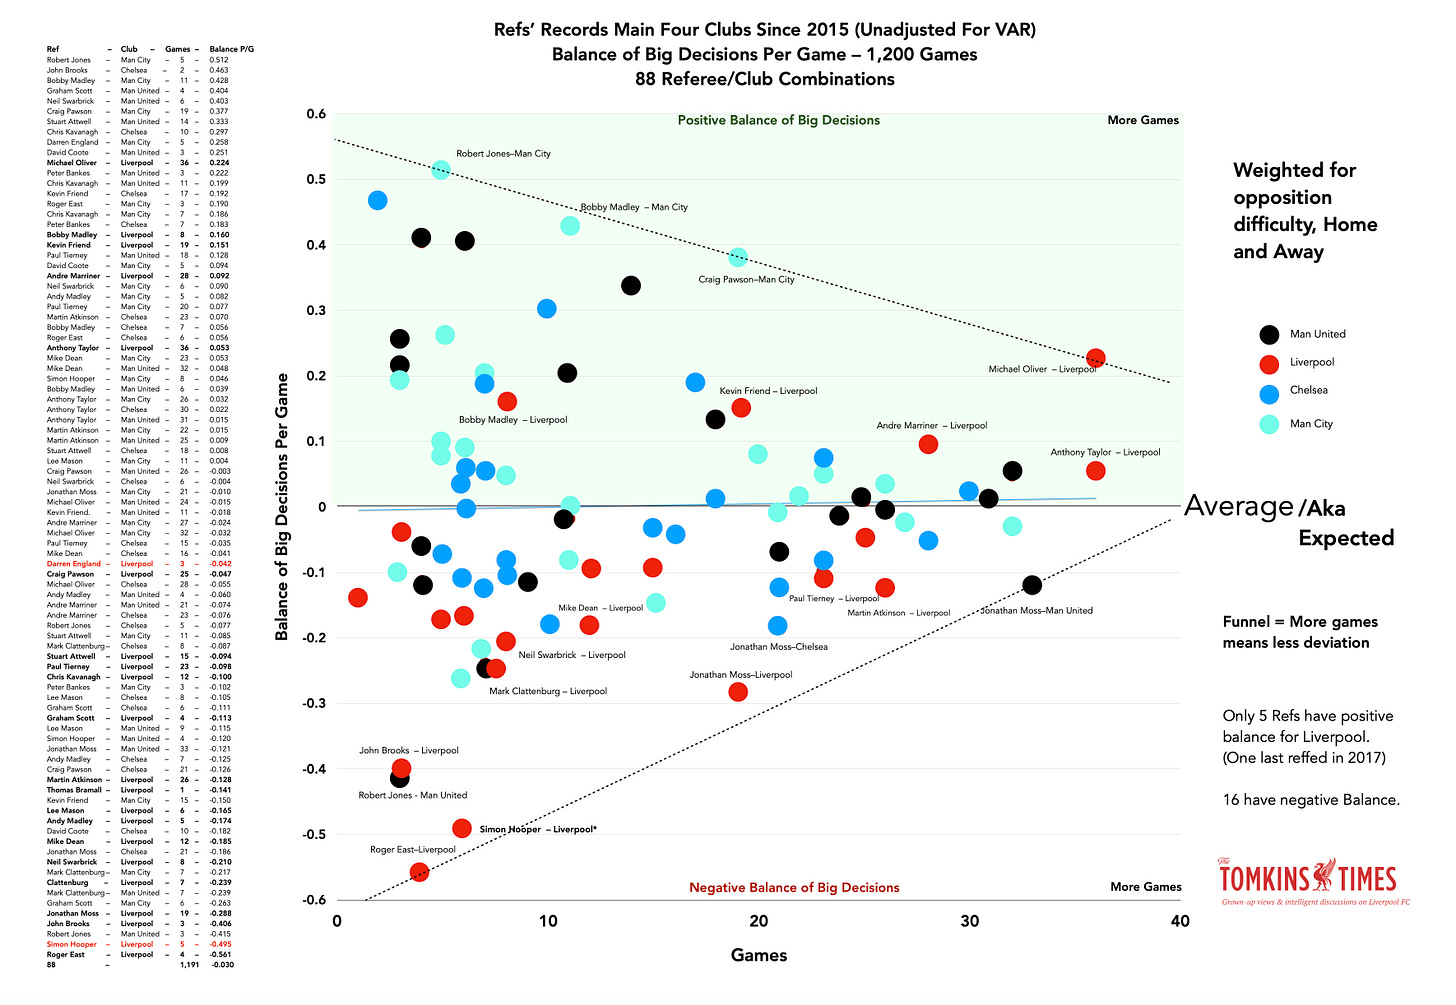
Okay, a scatterplot of all the referee/club combinations, with the detail to follow in the next scatterplot, which is busier due to more detail.
Before getting on to which refs the dots represent, and for officiating which clubs, it seemed sensible to provide a simple version, with just the 88 ref/club combos.
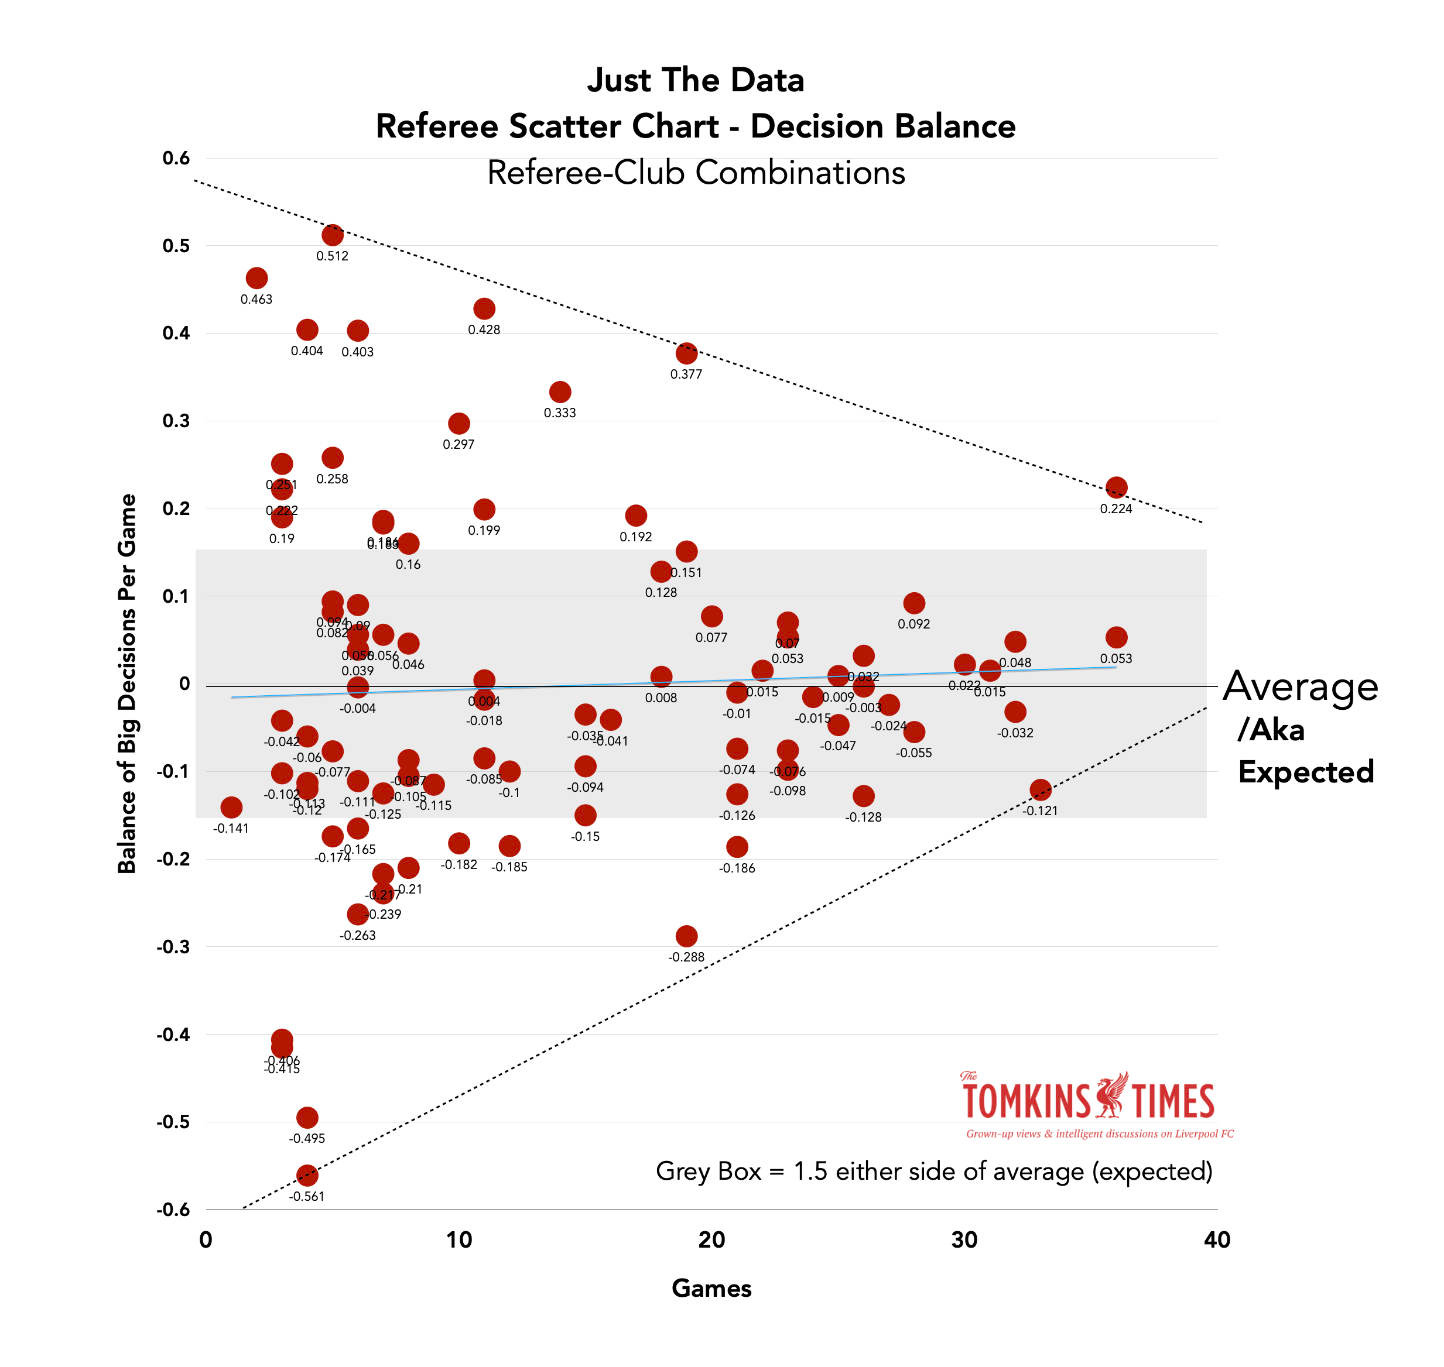
While I haven’t calculated actual standard deviations, the grey box represents +/1 1.5 either side of the average, which is also the expected tally for each ref with each club.
Next I’ll show who is who, and you can see a different pattern. Note: hopefully you can click to see a high-res version of the scatterplot below.
The scatterplot shows the most extreme Balances of Big Decisions in fewer then 20 games for ref/club combinations, at around 0.6 extra Big Decisions Against expectations (expectations being the ‘average’ line), and the same For.
As things funnel in towards the centre of the plot, then the right side, the real extreme numbers disappear. Get to almost 20 games (19 in both cases), and the most extreme data For and Against are Craig Pawson, for Man City, +0.377 and Jonathan Moss, for Liverpool, -0.288, so getting towards half the initial figures at the far left of the chart.
By the right side of the plot, when refs have done over 30 games, the variation is much smaller; but most refs are nearer to the mark of meeting expectations than the less experienced refs (or, those with smaller sample sizes).
While Michael Oliver’s overall career has seen him exactly on that centre line, for Liverpool he ranks as generous, albeit a bit less so in recent times.
(Were people to focus only on Oliver and not the truly odd results of this scatterplot, that would somehow feel typical.)
Only five Refs have positive balance for Liverpool; above the Average/Expectation line. Two have now retired, and the other hasn’t done the Reds since 2017 and may never do so again (as he’s a B-lister due to losing his job for many years).
Of the rest of the 22, SEVENTEEN have a Negative Balance of Big Decisions for Liverpool vs expectations.
Individually this can happen with any ref at any club, but that means of the 12 active refs who have done the Reds in recent seasons, 10 have a Negative Balance of Big Decisions.
(Chris Kavanagh’s balance following a penalty to Liverpool after the data cutoff point would still be negative, but around -0.25; he has gone up, while Simon Hooper has sunk down.)
Even Anthony Taylor looks good – just from being a fraction better than expectations.
John Brooks was also part of the Tierney fallout in the Spurs game (the Anfield one, not the recent one), as the 4th official berated by Jürgen Klopp after Mo Salah was dragged back by Ben Davies, then hauled over, and nothing was given (and Klopp knows how few free-kicks are given for fouls on Salah after the research I did in March 2022*).
Brooks’ one penalty to Liverpool was given by the VAR (a clear handball of Diogo Jota’s goal-bound shot, albeit prior to the fallout), and so his actual decisions in just three games are a penalty to Aston Villa in the game in which he failed to send off Tyrone Mings for six flying studs into Cody Gakpo’s upper chest (Shockingly Bad Decision), and sending off Virgil van Dijk at Newcastle, in a game in which he booked Trent Alexander-Arnold for throwing the ball back on the pitch but let Newcastle players kick the ball away, and also allowed various card-waving gestures (who knew that would be a thing for just the first two games of the season?).
The fallout then saw Anthony Taylor uncharacteristically anti-Homer to Liverpool at Anfield in the game after, as if he was taking up the fight for Tierney, albeit more in odd game management that is subjective, such as booking Ibrahima Konaté for kicking the ball away while the game was still ongoing.
This ties in with my theory that a lot of what refs do – since 2015 but more recently – is petty revenge on Klopp, who doesn’t tend to slate refs before or after matches, but does get in their face during games.
While Klopp can now be more heavily punished for that (and I have no problem with that), officials should be judging what happens, not what they feel they want to give, or not give.
Also, David Coote was not included on the plot due to doing one Liverpool game with no Big Decision, but that still meant a deficit as it was a home game for Liverpool, and so no Big Decision cost -0.137. Ironically, there was a clear trip on Andy Robertson in the box, as yet another missing penalty. Coote then famously, as the VAR, failed to send off Jordan Pickford and give a penalty to Liverpool for putting van Dijk out for a year, and has not reffed Liverpool since. Thomas Bramall gave Liverpool a penalty then ludicrously sent off Alexis Mac Allister.
Simon Hooper’s four games with zero decisions (his usual pattern for all clubs, it seems) cost Liverpool almost 0.5 of a Big Decision in total, but then shit got crazy, as the kids say. Two be at a Big Decision Balance of -2 after five games is alarming; and again, not unusual in and of itself, but all part of an overall pattern of newer refs who seem to be trained not to give Big Decisions to Liverpool, or who are unable to handle Klopp.
Basically, Liverpool need experienced referees who are not from Manchester, unless the game is at Anfield; and preferably, no one from Yorkshire.
Active Refs – Positive for Liverpool In Bold, negative in italics.
Ref – Club – Games– Balance P/G
Michael Oliver, Liverpool 36 +0.224
Anthony Taylor, Liverpool 36 +0.053
Darren England, Liverpool 3 -0.042
Craig Pawson, Liverpool 25 -0.047
Stuart Attwell, Liverpool 15 -0.094
Paul Tierney, Liverpool 23 -0.098
Chris Kavanagh, Liverpool 12 -0.100
Graham Scott, Liverpool 4 -0.113
David Coote, Liverpool 1 -0.137
Thomas Bramall, Liverpool 1 -0.141
Andy Madley, Liverpool 5 -0.174
John Brooks, Liverpool 3 -0.406
Simon Hooper, Liverpool 5 -0.495
(Data for Kavanagh, which is better, and Oliver, which is slightly worse, does not include latest game, but does for Hooper.)
* https://tomkinstimes.substack.com/p/incredible-mo-salah-stats-that-suggest
Liverpool and Good Refs vs Bad Refs
A lot of what I’m showing in this study results in lovely logical patterns where, over a period of eight years, things even themselves out to some reasonable degree, roughly in line with expectations; and then a few really weird outliers that make no sense in terms of averaging out to normality.
Most of these anomalies apply to Liverpool, hence my interest, but some other outliers, good and bad, apply to other clubs (just not as often).
Here’s the thing, as noted earlier. It’s widely accepted by opinion and rankings that Michael Oliver and Anthony Taylor are the best two English referees; and the best two during the period of 2015-2023 covered by this study.
They are also two of the only refs to be regularly active with Main Four games from the start of the study to the current day. (Several others retired in the past two years, while some of the others are relatively new. The data is correct as of early September 2023, unless where I’ve adjusted it for something like the Spurs’ debacle.)
The Marriner’s Friend
As noted in the Objective Ref Rater, Andre Marriner and Kevin Friend (who could almost combine to make a strong menthol lozenge) rank 3rd and 4th respectively in terms of how their record in games involving the Main Four.
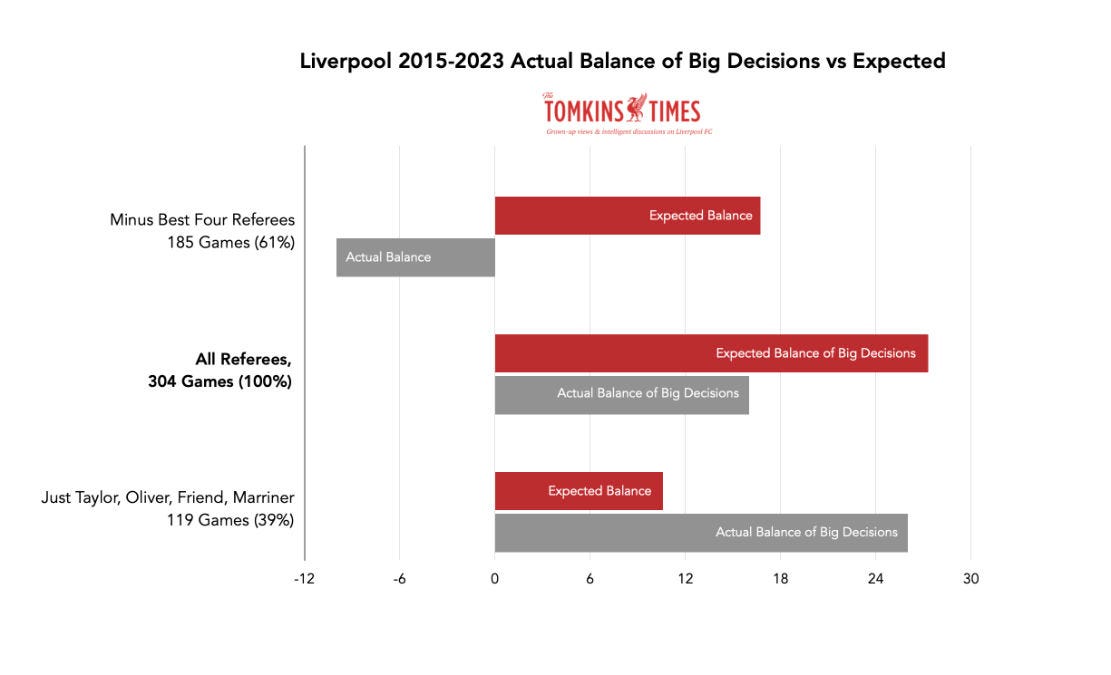
These are therefore the Best Four refs, and this is how often they did Liverpool:
• Just Taylor, Oliver, Friend, Marriner – 119 Games (39%)
Minus the Best Four referees – 185 Games (61%)
Again, we’re not talking about random splits of groups here – we’re talking about the best refs, and the rest.
What If Liverpool Had Better Refs?
What would happen if Liverpool had only the best referees via the Objective Ref Rater?
The Best Four are four of only five refs (out of 22) to give Liverpool a better Balance of Big Decisions than expected (Bobby Madley is the other).
The duo of Oliver and Taylor – officiating Liverpool – are the ref/club combination with the most games, with 36 each at the time of the study cutoff point (Oliver has since done one more for the Reds, with no Big Decisions).
Jonathan Moss with Man United games is the next most regular ref/club combination, albeit there is some double-counting involved, as in other parts of this study.
(Weirdly, as an aside, seven of Marriner’s 28 Liverpool games in the Klopp era were against Newcastle. Fully 25%.)
Michael Oliver has reffed Man City on 32 occasions, and Liverpool on 36 (now 37), but that also doesn’t mean 68 separate games, given that several were head-to-heads. Equally, every Big Decision For either Liverpool or Manchester City is a Big Decision to be counted against their opponents.
Michael Oliver, Liverpool, 36 games
Anthony Taylor, Liverpool, 36 games
Jonathan Moss, Man United, 33 games
Mike Dean, Man United, 32 games
Michael Oliver, Man City, 32 games
Anthony Taylor, Man United, 31 games
Anthony Taylor, Chelsea, 30 games
So generally it’s been good that Liverpool have had Oliver and Taylor so often, even if they’ve been less generous in their last few outings, and Taylor isn’t great for Liverpool away from Anfield.
Take away Oliver, Taylor, Marriner and Friend, and Liverpool have close to 30 missing Big Decisions on balance, in the 185 games (61%). I mean, that’s seriously bad.
The four best referees then add back around half of that missing balance, leaving it still almost 15 short of where it should be.
The Best Four seem generous to Liverpool at Anfield, albeit Anfield still has a lower Big Decision quota overall.
The Best Four have given 20 Big Decisions For Liverpool at home, and only two Against.
But in the 61% of the games done by other refs, the balance is 10 For the Reds at home, and 14 Against. (50% more games, half the Big Decisions For Liverpool, far, far more Against.)
From 92 home games, that is ludicrous. Those same referees then gave almost twice as many Big Decisions Against the Reds away than expected, where the balance should be narrowly in the Reds’ favour.
(In all games for Man United and Chelsea, the Balance of Big Decisions away from home is +4.)
Of course, Oliver and Taylor are more likely to give the Reds Big Decisions at Anfield, and fewer Against. They partially help redress a clear Anfield issues for referees, but it would be nice if there were fewer Homers and anti-Homers, and a more logical distribution of decisions.
Oliver, Taylor, Marriner and Friend are objectively the most normal refs, and also generally the most experienced refs.
Indeed, in the old days, refs used to have to please the baying crowd; now they have to please the watching world and social media, where 95% of ‘neutrals’ will likely be annoyed at Liverpool getting a Big Decision, believing in old myths perhaps borne of truths from the scary Kop of old.
As such, I’ve long felt there to be a “play it safe” attitude by most refs and VARs in terms of being avoidant, especially at Anfield; Big Decisions not made are generally less controversial than Big Decisions made, as what isn’t made cannot be as easily counted.
But Liverpool and Homers? More like a stream of Anti-Homers.
In 81 Anfield games since 2015 officiated by the collective of 17 refs that follows, the Reds have been given just five Big Decisions For:
Paul Tierney, Chris Kavanagh, Graham Scott, Thomas Bramall, Darren England, Craig Pawson, Simon Hooper, Martin Atkinson, Lee Mason, David Coote, Andy Madley, Mike Dean, Neil Swarbrick, Mark Clattenburg, Jonathan Moss, John Brooks and Roger East.
(Note: Kavanagh added another one vs West Ham.)
… Yet somehow those referees, in their only games during the Klopp era, when giving five Big Decisions to the Reds, gave a staggering THIRTEEN Against.
THIRTEEN!
THIRTEEN!
Some of these decisions For and Against may have been VAR-driven, but it’s still a hugely alarming disparity. And no matter how it is balanced out, the Reds are still treated shabbily at home in almost all metrics.
And again, as the Best Four, it’s not a case of randomly removing and splitting the data of Oliver, Taylor, Marriner and Friend. They were, objectively, the top referees during this period.
This is how the Main Four compare for Expected vs Actual Balance of Big Decisions, prior to the most recent rounds of games.
Hope? (Small Font)
The situation – at Anfield, at least – has changed a bit in the last nine league games, albeit the Reds being awarded some absolute stonewall penalties. It’s now five Anfield penalties since April, albeit Alexis Mac Allister was also comically sent off, to dent the good record, and Aston Villa given a penalty late last season.
(All five for the Reds were as clear as day, with generally little complaint by the foulers. Gakpo was scythed down against Spurs; Arsenal’s Rob Holding clearly took out Diogo Jota; Núñez robbed the Fulham player in the box who, not seeing the striker, kicked Núñez instead of the ball; and this season, against Bournemouth, a foul on Dominik Szoboszlai where he perhaps exaggerated his fall, but where his ankles were taken from underneath him with the defender nowhere near the ball; and most recently, Mo Salah, wrong-footing West Ham’s Nayef Aguerd in the box after Núñez initially wrong-footed him with the ball deflecting off his heel, meaning the defender, put his whole knee/thigh into Salah’s body – the first penalty won by Salah since late 2021. This latter penalty is not counted in the data as it occurred after the cutoff point, but the other four are.)
None of these four (or the more recent fifth) penalties were given by the Best Four refs, so the data would have been much worse for some of the other refs but for that shift.
Maybe this signals a change for the better (a run of five penalties in nine games is likely unsustainable, that said); albeit it all began minutes after Paul Tierney’s assistant had elbowed Andy Robertson, and with the officials on the back foot, and under the microscope. Until April, the record for Liverpool penalties at Anfield was very poor, and it remains well under par.
It’s too soon to say that there’s been a change of approach, but at least the most recent nine home games are seeing some overdue Big Decisions. (But away – boy, did you see Spurs away?!)
I’d always assumed that VAR would rid refs of the fear of giving decisions to Liverpool in front of the Kop, but as I will go on to show Liverpool remain the club with the fewest VAR interventions (offsides aside). Subjective decisions are not really made by VARs in games at Anfield, either.
Tight calls – 50/50s – are where Liverpool lose out, especially at home. Another bugbear of mine is that “seen them given” can be a penalty to one team on a ref’s whim, and for others he’ll basically tell them to fuck off.
Even 70/30 calls get ignored. It really could be that it has to be stonewall or nothing.
That’s the issue: what referees feel they can get away with ignoring, because they don’t want to be seen to be the weak referee at Anfield who gives #penaltypool yet another spot-kick, just as the VAR doesn’t want to give #LiVARpool another Big Decision; even though the data suggests Liverpool get the fewest penalties and the fewest VAR overturns of the Main Four, and even more so in home games.
But let’s look at perhaps the most ‘morally corrupt’ section: the data that screams, “I’m doing this to please people, rather than giving things I’m seeing on the pitch”; and, “I dare not give this one”. (Without getting onto “I can’t give this, he’s my mate, the bald bastard.”)
The Most Damning Data Pt1
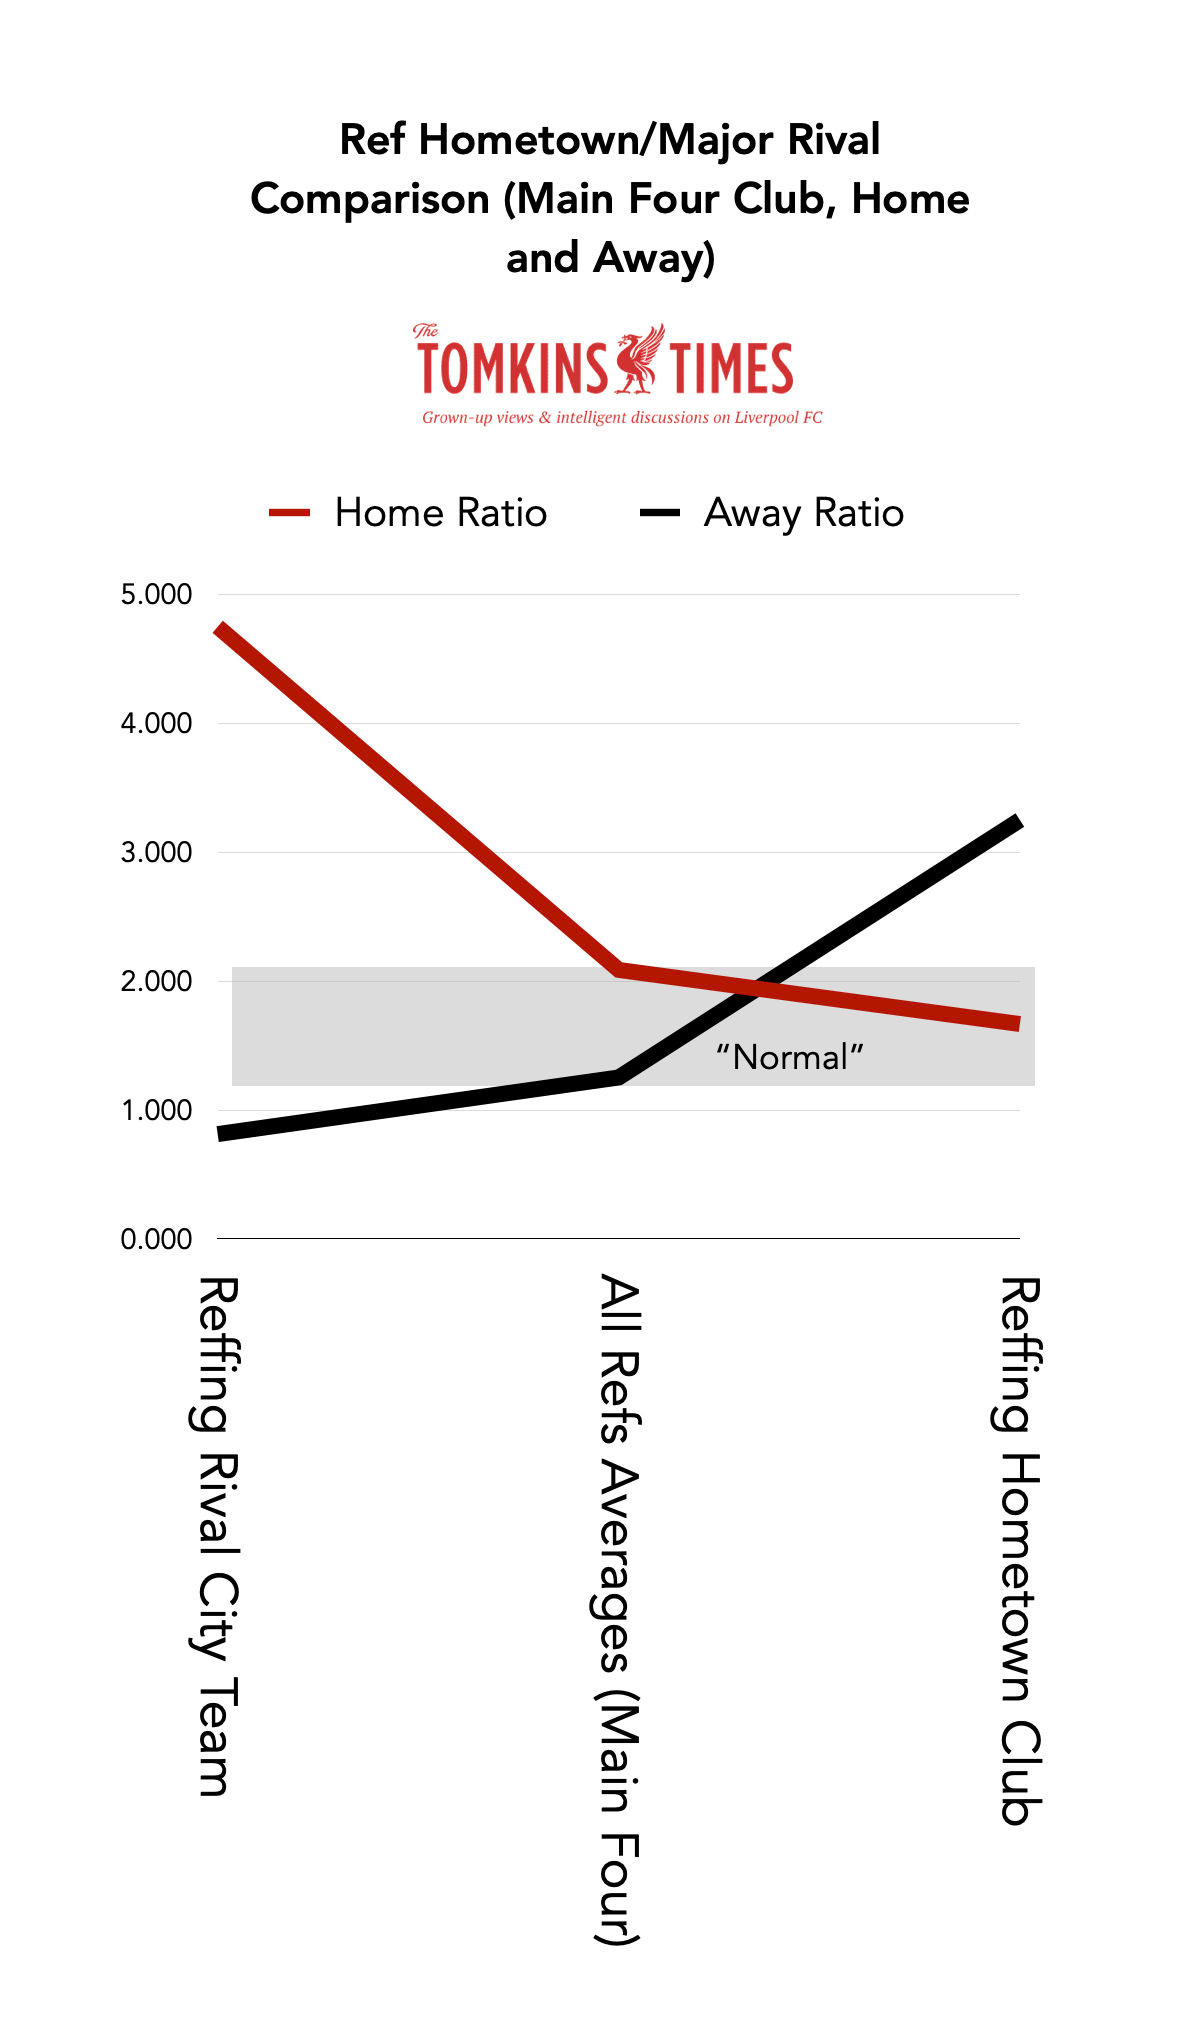
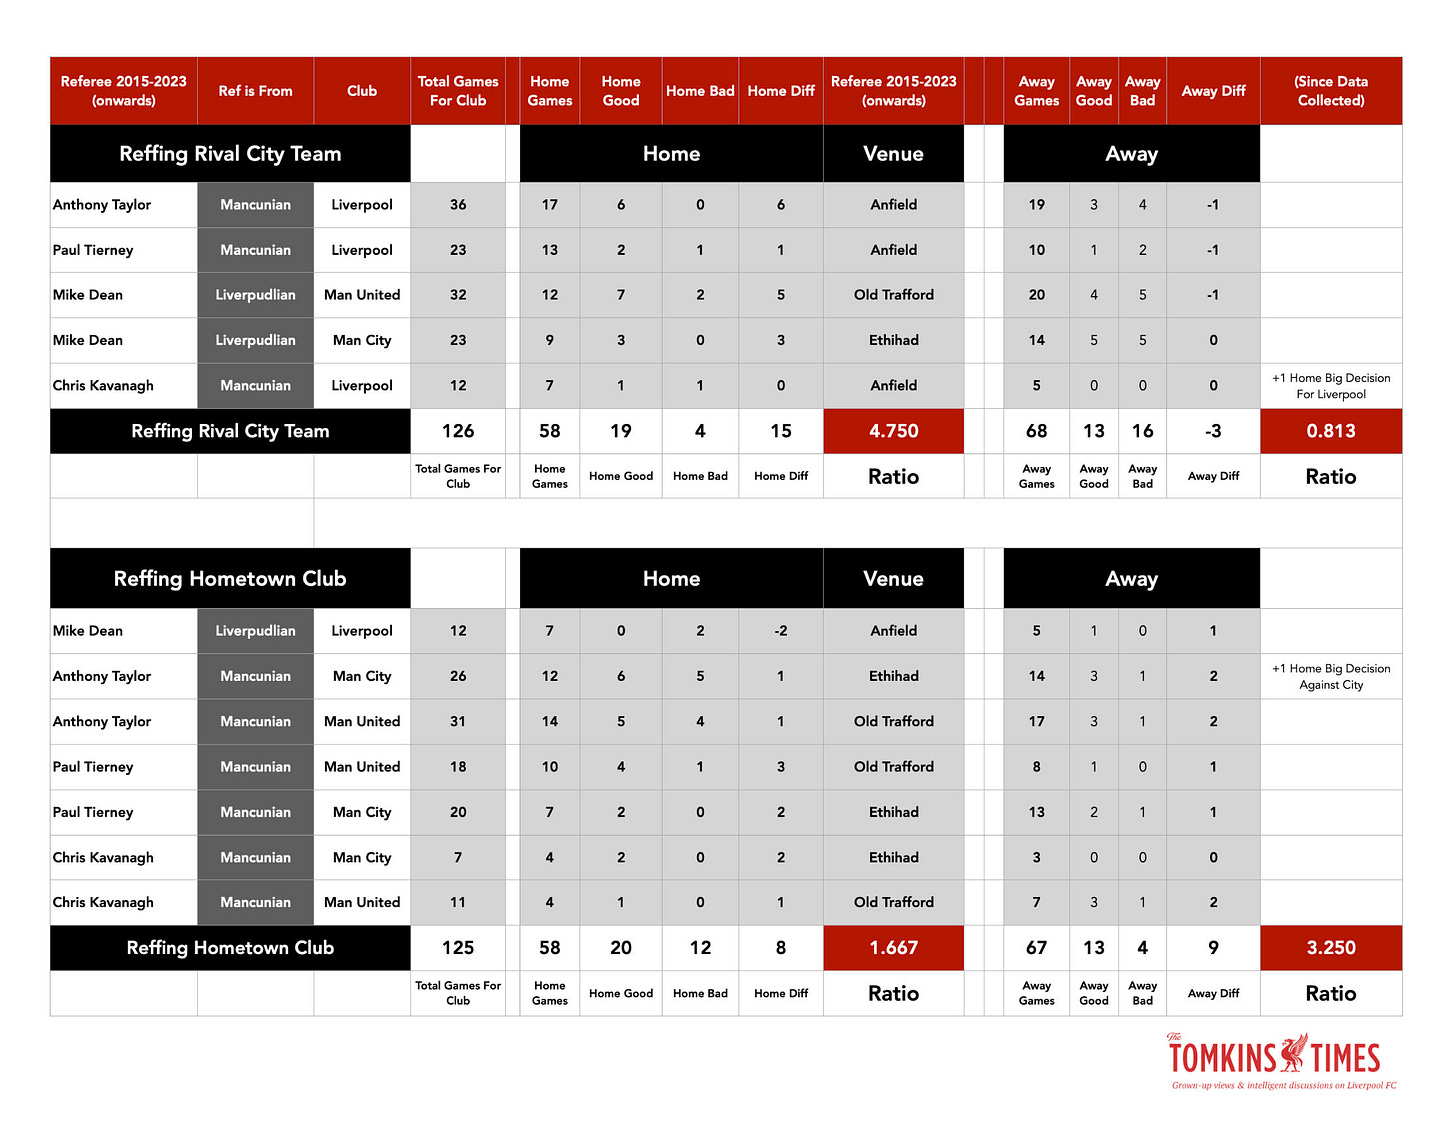
Liverpudlians and Mancunians, at Anfield, Old Trafford and the Etihad (Unadjusted for VAR).
A Story of Fear and Loathing
You might think, as a Liverpool or Man United fan, that having a referee from up the M62 is a bad thing.
But you’d be wrong. Generally speaking, it’s quite the opposite.
And this, above all other data I’ve looked at, smacks of a ref who corrupts himself to the situation.
The difference between an official reffing a game at a stadia in his hometown to him reffing a game at a rival’s stadium is massive.
Homer bias (which I’ve shown does exist, at least in terms of more Big Decisions going to home teams) goes out of the window. This is not about doing a good job; but being seen to do a good job. About being seen as unbiased, to the point of trying too hard. (Remember, it’s often not what we actually do, but what we’re seen to be doing, that matters most in modern life.)
A Mancunian at Anfield and a Liverpudlian at Old Trafford are going to be ultra-generous (bar the odd exception).
When these same refs do those same teams but it’s not in Manchester or Liverpool, they seem extra punitive.
Anyone reffing their hometown club and their home stadium is also much less generous.
In terms of ratio of Big Decisions For vs Big Decisions Against, the ref is virtually THREE TIMES more generous when a Liverpudlian is in Manchester or a Mancunian in Liverpool, to if the ref was hometown/home club.
Note: only refs who do both sets of clubs were included. Also, I chose not to go and look at Everton’s data as they are not in any way comparable to Liverpool, Man United and Man City in the period in question.
(But it could be interesting to see if the trend continues versus their Big Decisions from other refs and in other locations. Someone else can have that pleasure, but I suspect Everton are also not seen as fierce rivals to the Manchester clubs, to remove another layer of spice.)
So, only Mike Dean out of any refs connected to Merseyside, as Robert Jones, Jarred Gillett and Peter Bankes do not do Liverpool (two possibly support Liverpool, but Gillett is an Australian!).
Even Dean did not do Liverpool regularly until 2020, and yet he was a Tranmere fan. Dean also never did a single Big Six opponent, let alone Main Four, in his 12 Liverpool games. The average league position of the team Liverpool faced with Dean as the ref was 14th.
Also, Chris Kavanagh doesn’t do City very much, and did so mostly during Covid, which is an interesting if perhaps meaningless observation. He gave them two Big Decisions in four home games.
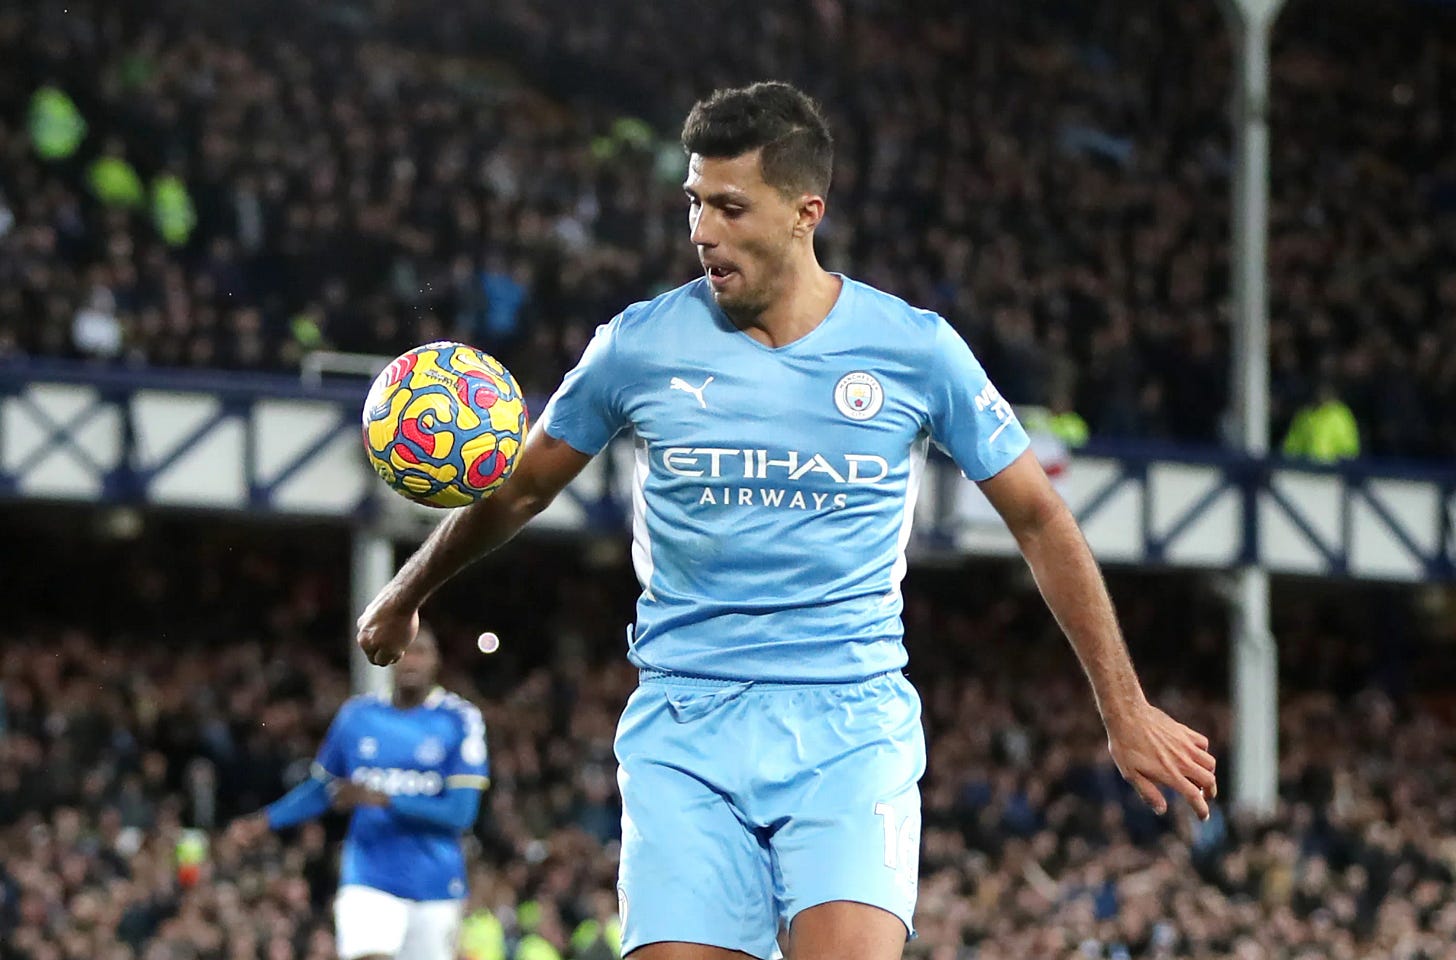
Since collating the data in early September 2023, Anthony Taylor sent off Rodri at the Etihad, to continue the trend I spotted in the data: hometown ref, hometown club, and ref will be harsher (unless Liverpool are the visitors to the Etihad and Vincent Kompany is on the lunge!).
Then Chris Kavanagh gave Liverpool a penalty at Anfield – the first Premier League penalty for a foul on Mo Salah in almost two full years; two decisions that could almost be predicted with hindsight via the data, albeit both seemed clear and not controversial.
Both fit the pattern of hometown ref punishing hometown team, and rival city ref away at rival’s home giving home team a Big Decision; and while obvious to give, refs with different profiles will still make Shocking Decisions in similar situations, or just be avoidant.
So the pattern has only got stronger so far in 2023/24, so far, from what I can tell.
The Most Damning Data Pt2 - The Homer
Homer!
In 58 games, Stuart Attwell has given more than twice as many (balance of positive) decisions to the home team than any other ref. That said, his balance of +20 Big Decisions drops to +17 when adjusted for VAR interventions, where the VAR made the overturn.
In a recent home game for Man United, Attwell gave two borderline decisions for the home team. The penalty was ‘soft’, but probably fair; it doesn’t take much to trip someone at speed, just the slightest clip. But the last-man DOGSO was also very tight, with a Forest player on the cover.
However, having seen the data, I’d have bet good money on Attwell giving the tight calls to the home team. (If it was Man United away at Forest, he’d likely have given them to Forest.)
While a very small sample size, Darren England – suspended as I write this (so he can’t do other teams but will probably be back to do Liverpool in his next game) – has done all five of his Man City games as a ref at the Etihad, and already given four Big Decisions For, and two Against. (Expected: 1.31 For, 0.60 Against.)
This is weird when considering he is the VAR least likely to make a subjective overturn (just two in around 50 games that were not handballs); or at least was before his shitshow at Spurs.
Mark Clattenburg, before quitting and becoming Saudi Arabia’s head of referees, seemed to spend his final period in England given Big Decisions mostly Against the Main Four; he also famously admitted that he reffed a vital game by ignoring red card offences.
“If I sent three players off from Tottenham, what are the headlines? ‘Clattenburg cost Tottenham the title.’ It was pure theatre that Tottenham self-destructed against Chelsea and Leicester won the title. I helped the game. I certainly benefited the game by my style of refereeing. Some referees would have played by the book; Tottenham would have been down to seven or eight players and probably lost and they would’ve been looking for an excuse.”
Surely his job was simply to apply the laws of the game? The situation has to be weighed, but the laws are the laws. Again, there are too many examples of referees with agendas.
Mark Halsey, who refereed in the Premier League for 14 years, also admitted that he was told by his bosses to say he hadn't seen incidents that had occurred during games. And that was before things got even more fraught and high-profile; before the England game was owned by half of the Arab nations, it seems.
(Michael Oliver, objectively the best ref and a huge Newcastle fan, was really dumb to go to Saudi recently to ref, for a pot of cash, when the Saudi state owns the club he supports. The PGMOL were dumb to let it happen. Even if above board, it’s not good for integrity. He won’t referee Newcastle games, but now they’re a top four contender each season, he will ref their rivals.)
Ditto to Mike Dean calling Anthony Taylor a friend who he couldn’t make an overturn on when acting as his VAR; saying the thing you should never say if part of Ref Club.
These are insights into the human failings that officials are prey to.
You can see them everywhere in the data in this study; it’s just odd for it to be admitted in public. (Dean was castigated for doing so, having been told that actually, he hadn’t done what he said he did, despite him saying he did it, did he not?)
Nowhere – other than perhaps the Manchester/Liverpool weirdshow – is the moral failing more obvious than in the Homer. The Homer takes the usual 57:43 ratio of home advantage and turns it into something far less balanced.
There will always be the anti-Homer, too; Clattenburg sticking two fingers up.
Of course, there was over a year (half a decade ago) when Spurs won the most penalties at Anfield. And by that, I mean including Liverpool. The Homer principle doesn’t always apply at Anfield, for some reason.
Anyway, smaller sample sizes never help, but the following three charts tell a story, before I move on to look at some VAR data, and then a few individual refs.
Stop, Coffee Break: Hammer Time!
Part Two (Or Is It Part 79?)
On average, 2.62 VAR overturns are made at each minute-mark of a match, with 236 to date (as of mid-September 2023). Plus a further 34 made in injury time: see notes.
But the trend is below average for the first 20 minutes. Is this proof of a reluctance to make early decisions? No overturns in minutes one or three.
Only 11 overturns in the first 10 minutes of games.
Then 18 in minutes 11-20.
Then 20 in minutes 21-30
Then big jump to 28 in minutes 31-40. Basically, almost three times as likely to see overturn in that period of match than first 10 minutes.
Is this to compensate?
Second half data is much more in keeping with the trendline, but eight overturns in the 76th minutes and again in the 86th minute. And only six overturns in minutes 46-50, when ‘expected’ would be 16; so five minutes after the break seems to be a time to get away with more. Even with excess at 45/90 minutes removed, 50.5 mins is the average time of the overturns.
Notes: Removed most of 45 minutes entries, as any added time logged as 45 minutes (15 were listed as 45+); changed to three decisions for minute 45 as in keeping with times at 44 minutes. Ditto added time at 90+, with 19 Big Decisions in injury time; reduced again to three, to match 89 minutes. So instead of 34 entries, there are just six.
VAR Subjective Foul-based and Violent Conduct Audit
For the Main Four and VAR, I decided to focus on purely subjective decisions, so ignoring offsides (assuming that whoever is the VAR is not playing Angry Birds on his phone).
(All VAR data via Andrew Beasley and ESPN.)
Liverpool are rescued by VAR on offsides far more than any other club, as the lino will often get it wrong, in part due to Liverpool’s offside trap at one and, and just because … well, who knows at the other. (This happened at Spurs, and the VAR may have ben playing Angry Birds on his phone.)
All clubs have various handball decisions For and Against, and they seem messy to me. No one knows what a handball is anymore, and the emphasis changes season to season; whereas a foul in the box should always be a foul in the box, and violent conduct or dangerous play remains much the same since 2019, even if it’s changed since 1963, when you could headbutt someone and get told to calm down or you might get a yellow card.
But as with fouls and violent conduct meted out to Liverpool players, this data shows weirdness too.
I’ll call this Subjective Player-To-Player Big Decision.
Subjective Player-To-Player Big Decisions
Again, this is where the data even shocked me, such was the extreme nature. Remember, Liverpool don’t get anywhere near as many Big Decisions from referees as they should. So the VARs should help fill that void.
Except they don’t. It only gets worse.
There have been just three subjective Player-To-Player Big Decisions favouring Liverpool at Anfield since VAR was introduced in 2019.
Now in its fifth season, Liverpool have had just seven Subjective Player-To-Player Big Decisions overall, and far more against; the only Main Four club to have a negative balance.
As such, incidents where Cody Gakpo had six studs put in his chest was deemed not worthy of review, or Alexis Mac Allister’s red card for violent conduct was not worthy of a review in Liverpool’s favour (that had to come not from Paul Tierney, who was possibly playing Angry Birds on his phone, but an independent panel).
I mean. Seriously.
And away is not much better, with Harry Kane’s lunge on Andy Robertson one of many ignored by both ref and VAR. These are stonewall examples of Subjective Player-To-Player Big Decisions that should have been made, and were not.
Now there’s a freeze frame!
I mean. Seriously.
And that’s not even counting the penalties that weren’t given by the VAR, such as for the foul on Diogo Jota in the same game at Spurs two seasons ago, when Paul Tierney, as the ref, was possibly playing Angry Birds on his phone.
Or the foul on Mo Salah in the box at Villa at 2-1 down in what ended 7-2 to the home side, when ‘Check Complete’ was stated before Sky had even shown an immediate replay (which Jamie Carragher, having instantly said it was not a penalty, then saw the other angles and said ‘stonewall’; but also noted the check had come up as complete within three seconds, so several angles could not have been viewed. Ref, Martin Atkinson, VAR, Jonathan Moss).
There are countless other examples, too numerous to list, but which happened; but don’t show up in the data, other than as holes.
A VAR will almost never give Liverpool a penalty for any kind of foul; but Tierney took a stonewaller away at Old Trafford, and also disallowed a Liverpool goal at Anfield against Man United for what even Roy Keane and Gary Neville said was madness.
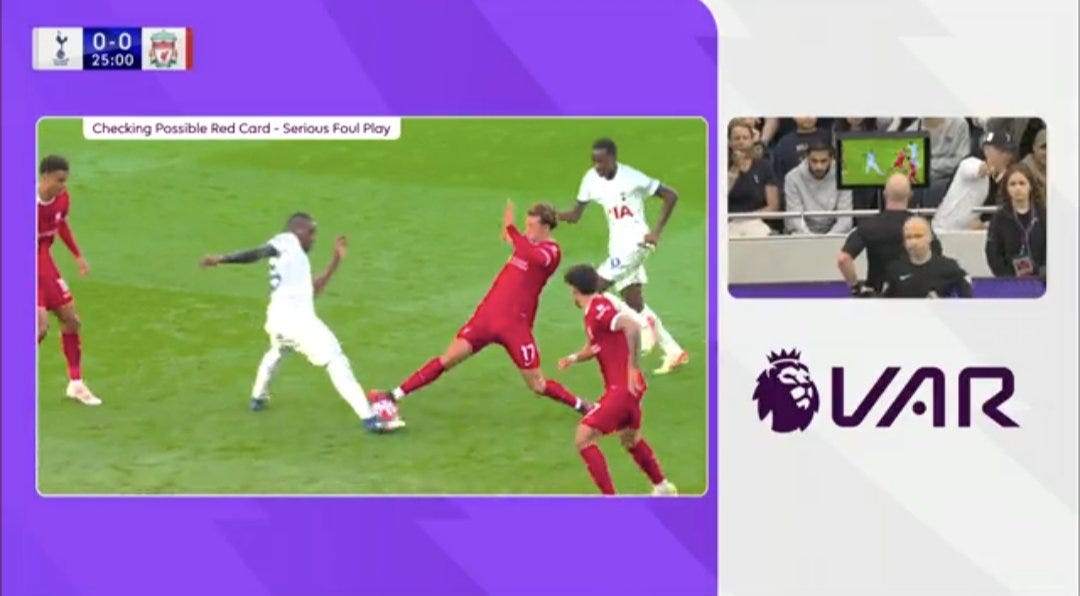
Even before Curtis Jones was harshly sent off at Spurs for a tackle where he had one foot on the ground and the other foot bounced off the ball (for which the VAR, Darren England, used priming to show Simon Hooper the worst and most misleading image to start with on the review), the Reds had nine VAR decisions go Against them on Subjective Player-To-Player Big Decisions. (So it’s now 10.)
Excluding offsides and handballs, so focusing purely in fouls and other physical player-to-player decisions, Liverpool’s VAR balance is -3.
Only Chelsea have to wait longer for a Subjective Player-To-Player Big Decision, at 45 minutes to Liverpool’s 43.
But Chelsea only have two Against them before their first; Liverpool have four Against them before their first.
Man City have to only wait 12 minutes for their first For; as do Man United.
City have two Subjective Player-To-Player Big Decisions For before any Against.
United have four Subjective Player-To-Player Big Decisions For before any Against.
The average time of Subjective Player-To-Player Big Decisions For for Chelsea and Liverpool is over the 60-minute mark.
For the Manchester clubs, it’s under 50 minutes.
As such, the treatment by VAR of Chelsea and Liverpool is vaguely similar, but Chelsea do better. The treatment of those two clubs in contrast to the Manchester club is alarming. What’s going on?
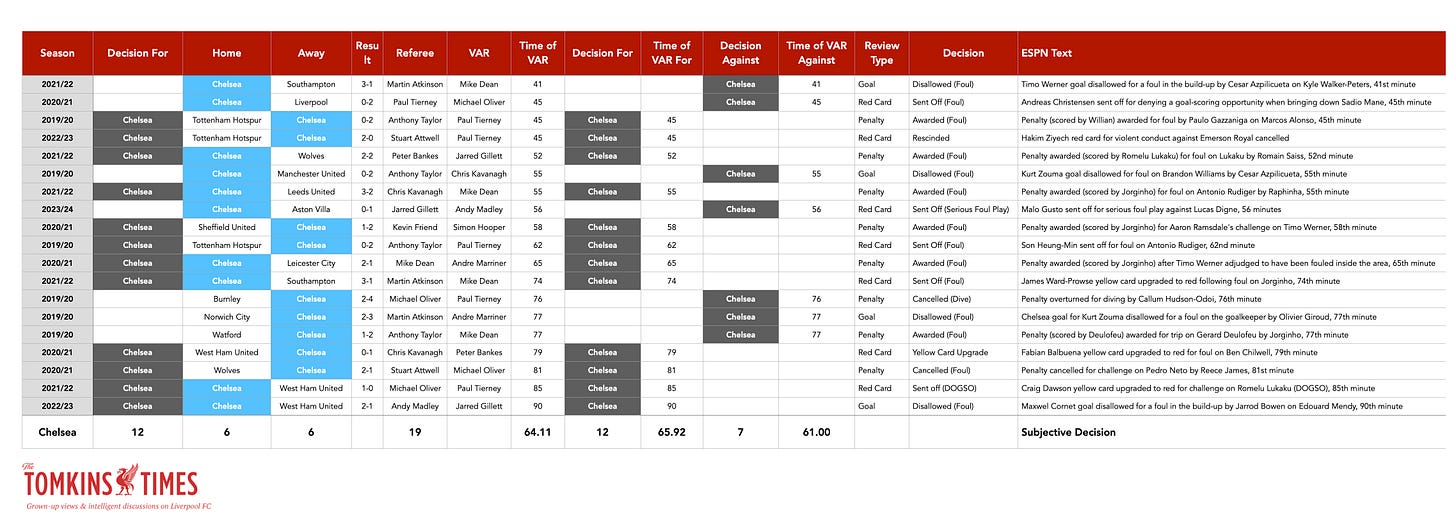
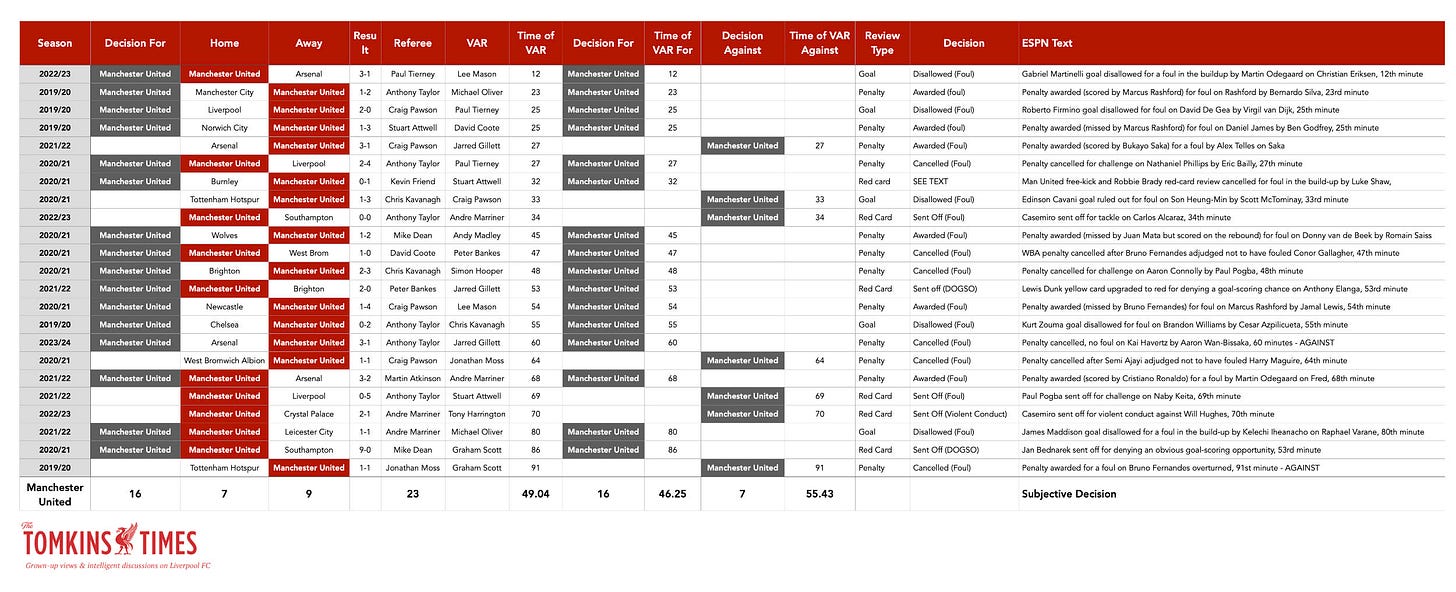
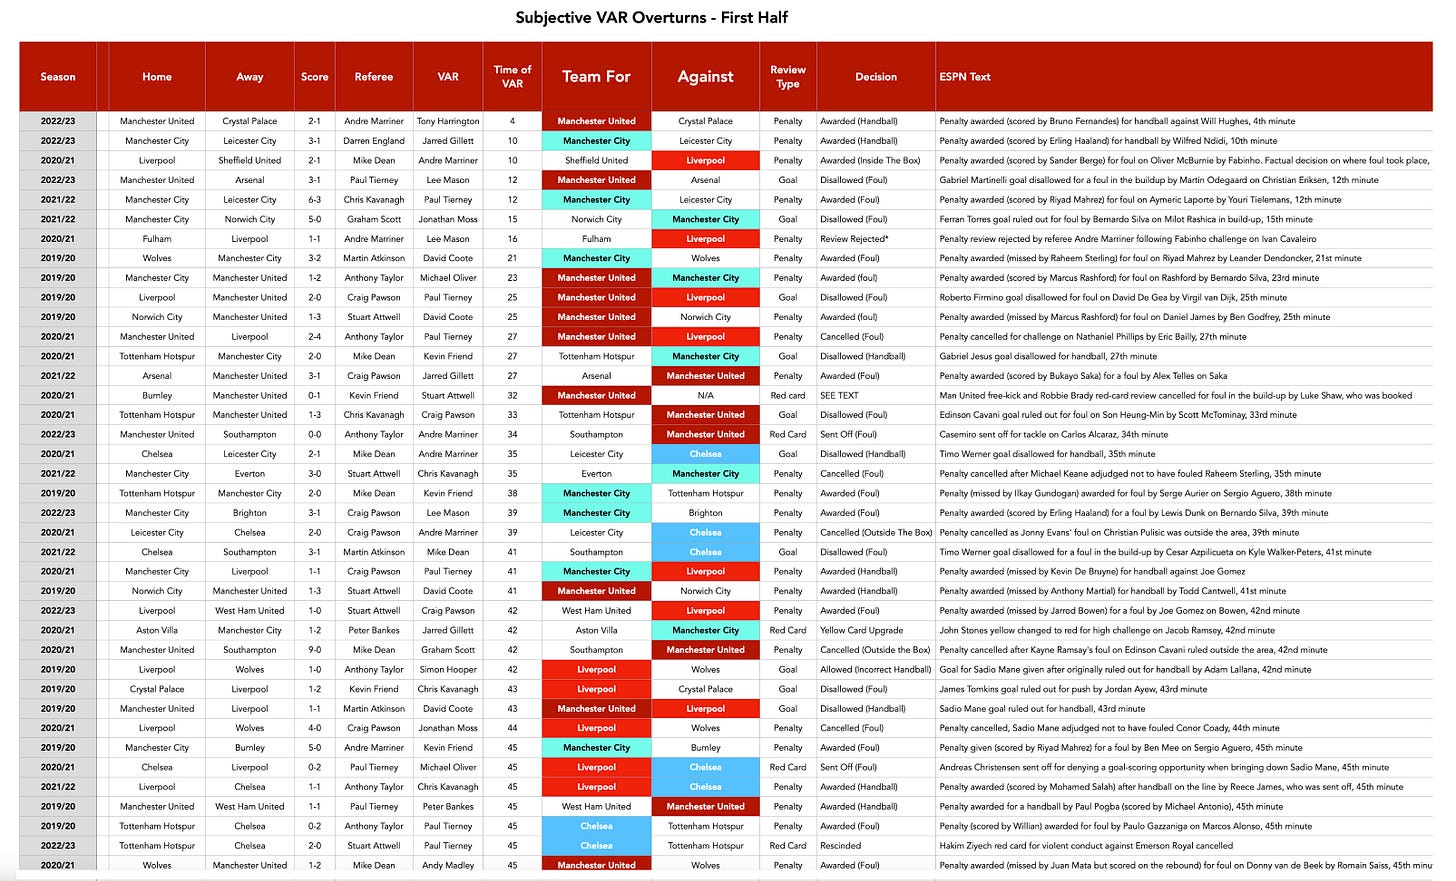
The following Tables show each club’s Subjective Player-To-Player Big Decisions separately, and then there’s a list of them in chronological match-minute order, for just the first half, to show when first decisions occur.
Again, hopefully the text (with descriptions via ESPN) will be legible if the image is clicked upon.
The table above shows clearly the time teams have to wait to get a positive overturn, or be punished by a negative one. (This list includes handballs but not offsides.)
A quick word on Darren England, who did the Arsenal away game last season, in which Michael Oliver had a poor game as the ref.
This is from Sky’s refereeing analysis with Dermot Gallagher.
INCIDENT: Diogo Jota crosses into the Arsenal box and the ball strikes Gabriel's arm. Oliver and the linesman on the side choose not to give a penalty and VAR agrees after looking at it.
DERMOT'S VERDICT: Incorrect decision.
DERMOT SAYS: All I can think is that the referee and VAR felt it was too close a proximity. What we've seen this season is if the arm is out - in this case at shoulder height - then it's been penalised. When I saw it and saw the VAR being used, I expected it to be overturned.
They felt it was too close, that's why it wasn't given. I anticipated the VAR would recommend a review. All I can think is the VAR felt it was too close so wouldn't recommend it. If he doesn't do that then the referee can't look at the screen.
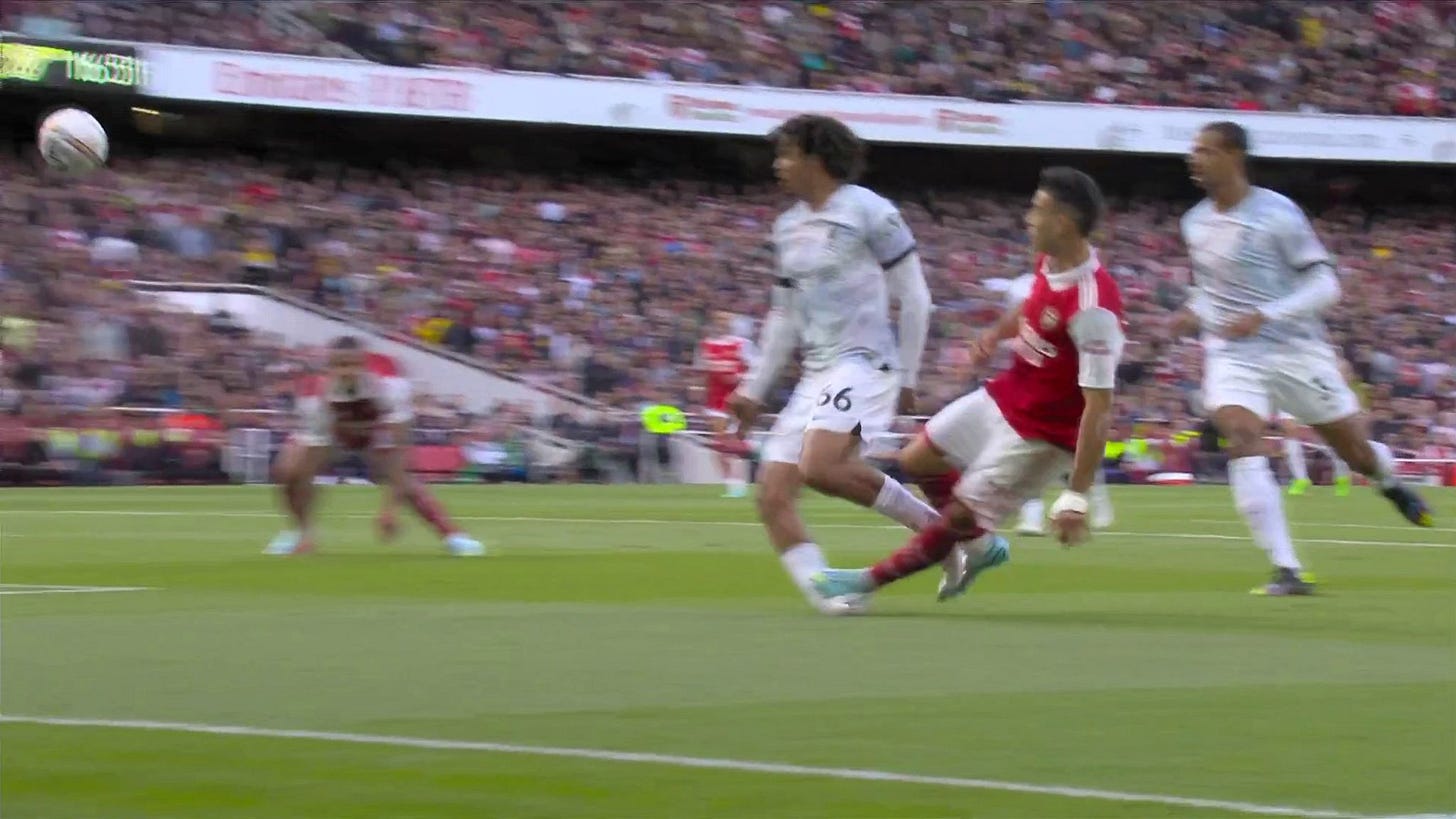
INCIDENT: Granit Xhaka crosses the ball into the Liverpool box and Gabriel Jesus competes for the ball with Thiago Alcantara. The Arsenal striker goes down under Thiago's challenge and Michael Oliver immediately awards the penalty. VAR does not intervene to either look or overturn the decision.
DERMOT'S VERDICT: Incorrect decision.
DERMOT SAYS: I think it raises two issues. Firstly, it's not in line with what has changed this season. The League has raised the threshold and there's more physical contact. Without doubt, Thiago doesn't get the ball and makes contact with Jesus. But is it enough to give a penalty? I think not.
The next problem is when it's thrown to the VAR, Michael Oliver will say to the VAR: he doesn't get the ball, he made contact with the player which he has. So there's no evidence that he has made an incorrect decision, the VAR has to stay out. It will always default to the referee's decision.
That’s just two examples of where Darren England has failed in the past. And Dermot Gallagher is hardly pro-Reds.
And in the same game, why not freeze-frame this and hand it to Michael Oliver with priming on a plate? Not intentional, but Alexander-Arnold was injured, and the still-frame is pretty shocking, but like Jones’, misleading. Again, where’s the consistency?
All's Not Well With Attwell
In Stuart Attwell’s 58 games as a ref of games involving the Main Four, he has been the ‘victim’ of a whopping 11 Big Decision Overturns.
• Most VARs average an overturn every 8.39 games. For Attwell it’s every 4.36 games.
• But when he’s the VAR, in 63 games he overturns only every 10.5 games.
Prior to factoring in VAR and who actually made the call, Attwell’s games had also seen 11 Big Decisions awarded against the Main Four.
But after the VAR intervened, only four were left; a staggering seven were removed.
So Attwell was not making these decisions. In his data prior to making VAR adjustments, there’s a fairly normal ratio of decisions For and Against the Main Four of 1.73, but that flies up to 4.75, meaning almost five times as many decisions that he made that favoured the Main Four, before he was overturned.
So of the 11 decisions against the Main Four in his games, only four were his calls; while his 19 for remains the same with some added and some subtracted.
Six penalties in his games as referee were awarded by the VARs: two against Liverpool, by Craig Pawson and Kevin Friend; one for Liverpool, by John Brooks. David Coote twice intervened to give Manchester United a penalty; and Jarred Gillett gave Man City a penalty.
Chris Kavanagh penalised Man City by overturning a penalty for a foul on Raheem Sterling, given by Attwell. Kavanagh also suggested a penalty for handball against Callum Hudson-Odoi, but Attwell rejected the review. Michael Oliver overruled a penalty Attwell gave for Chelsea, and Paul Tierney said that Hakim Ziyech's red card for violent conduct needed to be cancelled, to benefit Chelsea. And famously, and correctly, Craig Pawson sent off Fernandinho for deliberate handball on the goalline, as Man City lost the league to Liverpool.
The data suggests that Attwell massively favours Main Four teams, with 83% of all Big Decisions going to them. (Ones against them are away from home.)
Albeit Chelsea still do terribly in his games, despite lots of positive decisions for them – a 22% win rate. However, the average league position of the opposition is 7.9, and includes 15 teams in positions 1-10 at the time of the game, and just six below that. He does a lot of Chelsea’s bigger games, it seems.
But in general Attwell also massively favours the home team, whether it’s the Main Four club or who the Main Four club is away at. In total, 17 of his 23 Big Decisions have gone to the home team: 74%. Attwell is the ultimate Homer in that sense.
So, the data suggests that Attwell is a massive Homer, a Big Four-favourer to an extreme degree (unless it’s away), and someone that other refs, when acting as VARs, feel the need to step in and correct at an alarming rate.
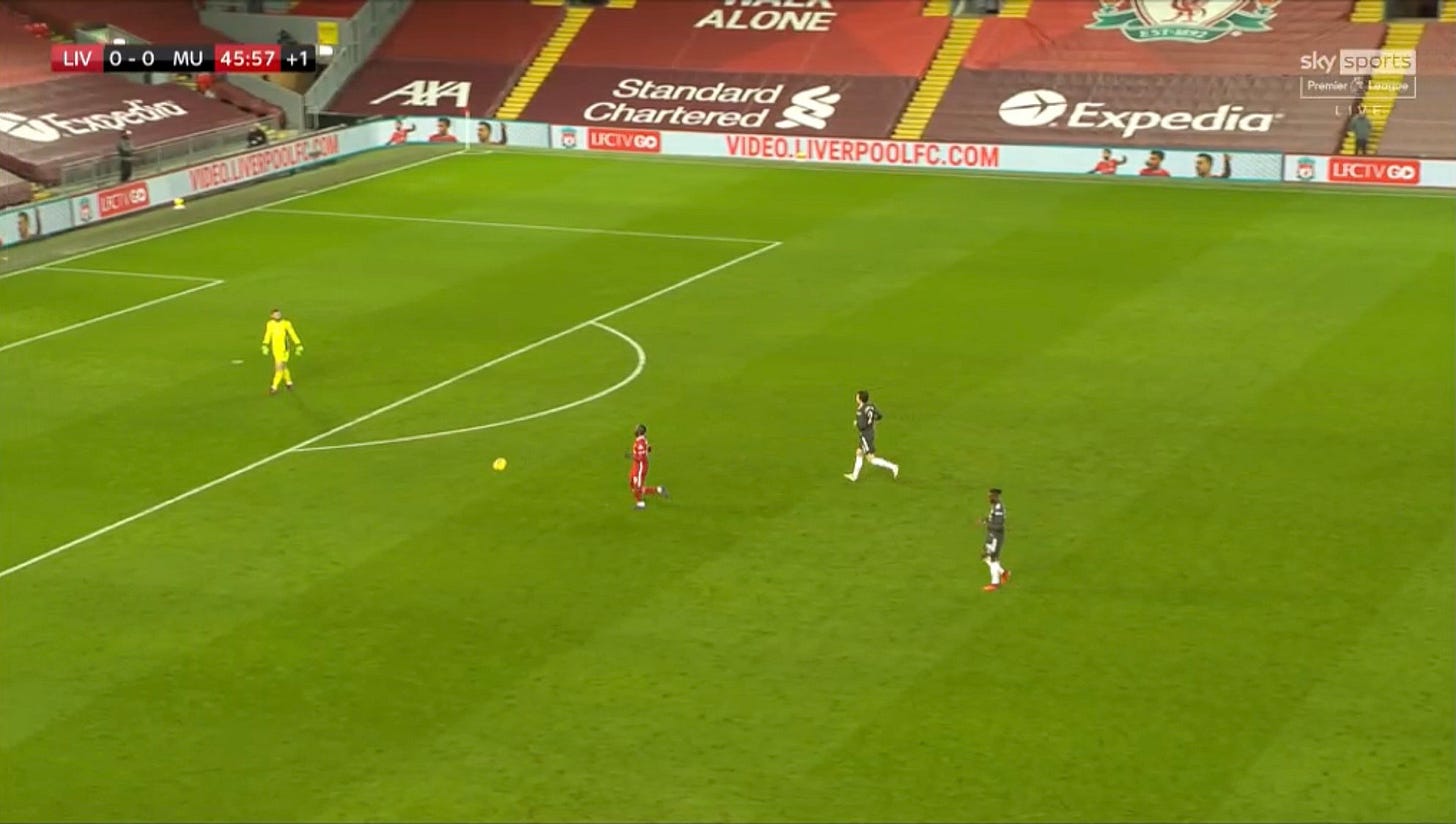
As a VAR in games involving the Main Four, he only made two subjective overturns: one for Liverpool (upgrading Paul Pogba’s shocking challenge on Naby Keïta to an obvious red), and one punishing Man United.
Based on the data alone, you’d have to question his qualities as a ref. Now aged 40, he suffered demotion back in 2012.
“Attwell demoted from Premier League refs list after series of blunders. Referee Stuart Attwell has been demoted from the select group of Premier League officials after a four-year spell dogged by controversy.”
Via Google:
“Attwell became the youngest referee to officiate in the top flight when, aged 25, he took charge of a match between Blackburn and Hull in 2008 after one season in the Football League. However, a month later he awarded a 'ghost' goal in a Championship match between Watford and Reading. Attwell said: 'I have learned a great deal from my involvement in the Select Group over the last four years and I am now looking forward to building on that valuable experience’.”
Perhaps he’s getting better with experience, but it doesn’t feel like it.
Keith Hackett says (2022): “He is one of the fittest and mobile referees on the panel. He is gaining in confidence but still prone to making errors.
The Mysterious Case of Paul Tierney and Liverpool FC
Paul Tierney’s overall data is fairly normal, but in his case, the contrast between his record for Liverpool (as both a ref and a VAR) and the other Main Four clubs is what leads to my constant questioning of his suitability.
(And that’s without taking into account more than half a dozen ‘dodgy’ decisions that don’t show up in the data, including failing to give obvious Big Decisions.)
For this project I began creating 88 tables like the one below – one for each ref and each of the four clubs he officiated (or three in the case of the Merseyside refs barred from doing Liverpool games). As you might suspect, I began to lose the will to live.
That said, I did complete them all, in terms of the data; I just didn’t fill in the comments and notes.
One of the things I stopped short of, however, was in adjusting each referee’s data to take into account a) the decisions attributed to them as the referee but where the VAR made the call; and b) their own Big Decisions (overturns) as a VAR.
I did so for a number of the most interesting refs, but stopped short of doing so for them all when I literally started to lose my vision.
Part of my problem was that I was creating per-game data. Paul Tierney has done 23 games as a referee for Liverpool, but also 20 as the VAR; the most of any VAR/club combo, joint with Stuart Attwell also doing 20 for Liverpool (then comes Tierney with 19 for Man United).
The per-game rates are very different as a ref to a VAR for Big Decisions: one every 2.78? games as a ref to one ever 8.38? as a VAR, or three times fewer.
Every ref has a VAR who can overturn them, and every VAR can overturn a ref.
My aim was to remove the Big Decisions from ref’s tallies if the VAR made the call, so I still think it makes sense to add their own calls as VAR into the mix, and not adjust the number of games; they ‘lose’ and ‘gain’ decisions, after all. But it’s not perfect.
Tierney is well into double figures for all Main Four clubs, so it at least serves as a reasonable way to assess his own performances. (He has reffed and been VAR less for Man City and Chelsea, but in a proportionate manner. For Man United he has reffed 18 and VARred 19.)
As a ref, Tierney’s data is slightly generous to Manchester City and very generous to Manchester United; very slightly harsh on Chelsea and very harsh on Liverpool. But add his VAR work, and Man City get a further helpful boost, and both Man United and Chelsea get a really helpful boost. Liverpool, by contrast, go from bad to worse.
The data is so stark that it feels like Tierney, as ref and VAR, treats Liverpool in a polar opposite way to the other three clubs. There is a bit of the phenomenon of Mancunian/Liverpudlian refs being more generous in the rival club’s home stadium, albeit you cannot say that Tierney is a Homer at Anfield.
(The one red card he has given to a Liverpool opponent was a yellow at Chelsea, that the VAR, Michael Oliver, rightly overturned as a last-man DOGSO.)
Indeed, Tierney went 11.5 Anfield games with a Big Decision Balance of -1 for the Reds.
This is where some subjectivity comes on my part starts to come in, for this section.
Then, his long-time partner in officiating (dating back to their first meeting with Liverpool), Constantine Hatzidakis, elbowed Andy Robertson at half-time. (I still can’t fathom how more wasn’t made of this, and how in some cases it was put down at Andy Robertson provoking it, as if that makes it okay for a buff lino to swing an elbow into a player’s face!).
In Tierney’s very first game as a ref for Liverpool, back in 2017, he ruled out Dominic Solanke’s last-minute winner against West Brom due to a handball flagged by Hatzidakis.
My subjective take on that first decision in 2017 is that it was an accidental handball which was legal at the time, before the rule changes. (The ball deflects off Solanke’s body and onto his arm, and into the net, in a flash), and I presume that Klopp told both he was not happy.
(Another Tierney stat is that he gives as many fouls against Mo Salah as for Mo Salah, the only ref to be so ludicrous in his treatment of the winger, who isn’t treated especially great by others to start with.)
In the next 1.5 Anfield games, Tierney gave Liverpool two penalties; both stonewall, but he’d also ignored a stonewall penalty on Diogo Jota at Spurs, and a stonewall red card for Harry Kane in the same game. But it felt to me like he now had nowhere to hide.
(Until he went back to VAR duty, that is, with Hatzidakis as his sidekick, and ignored the stonewall error from ref Thomas Bramall sending off Alexis Mac Allister, which was described by many in the media as a shockingly bad decision, and which an independent panel later overturned; but from the safety of Stockley Park, it seems that Tierney and Hatzidakis felt no pressure to intervene.)
The Mac Allister red was a Shocking Decision. (I’m using caps again, as I think a Shocking Decision is one that 99.99% of people would acknowledge.) Tierney: VAR.
The lack of a penalty at Spurs for the take-out of Jota was a Shocking Decision. Tierney: ref.
The failure to censure Hatzidakis for violent conduct was a Shocking Decision. Tierney: ref. (Admittedly it would be an unprecedented decision, given that officials don’t normally elbow players, but one within the rules; just as violent conduct between teammates means red cards too.)
The lack of a red card for Harry Kane at Spurs was a Shocking Decision. Tierney: ref.
The lack of a penalty for a foul on Andy Robertson in the box at Anfield against Burnley was a Shocking Decision. Tierney: ref.
The decision to blow for half time six seconds early when Sadio Mané was clear through on goal against Man United after a minimum of one minute was added, when Mané maybe needed only 2-3 seconds to get a shot away, was a Shocking Decision. Tierney: ref. (Have you ever seen that before or since?)
Look at the frame below, with Mané having stopped as the whistle has gone, and there’s still time left.
That’s then ignoring ‘unhelpful’ decisions, like ruling out Solanke’s goal, which while harsh, are not so outlandish as to be unusual. (I can’t recall the foul on Gini Wijnaldum against Aston Villa that Klopp thought was a penalty in 2020, when the feud was upped by Tierney telling Klopp to “get over it”, so can’t pass judgement on that one).
Then, the VAR work only.
For all the other Main Four clubs he has given more Big Decisions For than Against as a VAR; almost exclusively for. (One Against Chelsea but five For, plus it was the VAR who sent off Andreas Christensen against Liverpool.)
In games involving Liverpool, Tierney has given three Big Decisions. All were Against the Reds, and For Manchester clubs.
Again, on its own that wouldn’t mean much, but there’s a clear pattern here.
The penalty against Joe Gomez at Manchester City was a bit harsh, but not out of the realms of what you see given. (Aka, Seen Them Given.)
But penalty cancelled for challenge on Nathaniel Phillips by Eric Bailly, 27th minute, at Old Trafford: a Shocking Decision. (Bailly’s tackle was utterly reckless, took out Phillips with an out-of-control follow-through, and Tierney overruled it due to a fractional touch on the ball, which is not part of the laws of the game. It was worse than Jones’ tackle at Spurs.)
Goal for Roberto Firmino disallowed for a foul by Virgil van Dijk on David de Gea: a Shocking Decision.
In jumped those famous ex-Liverpool players Gary Neville and Roy Keane. “Very soft”, said Neville. Keane: “The game's gone mad. Why he’s disallowed that goal is beyond me. How they see that as a foul is beyond me. I can’t get my head around it.”
Ex-ref Peter Walton, who tends to side with the officials:
“Manchester United can count themselves incredibly fortunate that VAR chalked off Roberto Firmino’s goal for Liverpool after ruling that Virgil van Dijk had impeded goalkeeper David de Gea. I do not think there was enough evidence to disallow the goal.”
So in this case, the data can be backed up with subjective takes to fill in the full picture.
I make it at least eight Shocking Decisions against Liverpool by Tierney. Those decisions can be seen, or seen via their absence, in his data.
The two Anfield penalties he gave to Liverpool – his only ones as ref or VAR – were stonewall, full-body take-outs.
Oh, and “Neither referee Paul Tierney nor video assistant referee Chris Kavanagh deemed it was worthy of a spot-kick” in relation to Rodri’s clear last-gasp handball at Everton, for which Everton got an apology and Liverpool got sweet fuck-all in the title race.
As such, I reiterate: he has apparently shown himself incapable of putting emotions or biases aside, and should not do Liverpool games ever again, in any capacity. Sticking him away from Anfield as the VAR backfired when he failed to overturn the Mac Allister red card, as he was possibly showing Hatzidakis how to play Angry Birds on his phone.
I would also go further and as noted elsewhere in this study, not have Northwest refs do any Northwest clubs, given the highly unusual data (which I put down to pressures to conform, rather than anything more sinister, but you may have ulterior motives in a referee or two; and certain a seething resentment or two).
More refs from outside of the Northwest and Yorkshire would help provide more balance, and look less like a old boys’ network. Having the PGMOL filled with Yorkshireman who were not great refs, teaching the new brigade, is just insane.
Keith Hackett says (2022): “Tierney is an experienced referee but not showing the form that he has demonstrated in previous seasons. He has lost some of his top sprinting speed and this is leaving him detached from play and vulnerable to error.”
Conclusion and Roundup
Simon Hooper was ranked the worst referee by ex-ref and head of refs, Keith Hackett, in an article last year.
Keith Hackett says (2022): “Sadly I believe that he is not up to the standard required of a Premier League Referee. His mobility is below the standard expected of an elite referee and it means he becomes detached from play and then makes errors. I would remove him from the list.”
That said, while Hackett gets 1st and 2nd right in line with my Objective Ref Rater, third is rather bonkers to my eyes (but he is being subjective, of course).
3) Darren England - 7/10
Hackett says: “I have been impressed with this referee since his introduction into the Select Group 1 referees. His physical work-rate is first class and with every game he is gaining in confidence and making good decisions. He is under-utilised by the PGMOL having only received 9 Premier League appointments.
2) Anthony Taylor - 7.5/10
Hackett says: “Second English referee nominated for Qatar this year and has also officiated 15 Premier League games. He is very fit and mobile but there are times when I would like him to relax a little and manage players more effectively. This would help to reduce his average yellow cards per game as he has made 61 bookings. Smile Anthony, you are a good referee.
1) Michael Oliver - 8/10
Hackett says: “Nominated by FIFA for the 2022 World Cup, he has shown a high level of decision-making accuracy this season. The foundation of his success and the reason why at Week 20 of the Premier League season he has received 15 referee appointments in total.
“He has matured and players and managers trust and respect his approach when he is in the middle. The foundation of his success is his fitness level and the consistency of getting decisions correct.”
Almost all the other refs, out of 19, are criticised for being unfit, unable to sprint, and unable to keep up with play. Great.
Anyway, hopefully this remains my final study on officiating, albeit I can easily update some of the simpler data, to track progress. I feel like I’ve missed some stuff I wanted to cover, but I had to draw the line somewhere (unlike the VAR yesterday).
While I'm clearly pointing out a lot that's gone against the Reds, there's almost nothing in the data that is positive, apart from fewer yellow cards; but that just means fewer to the opposition, too. (And this season, red cards are through the roof!)
I'll do my best to change any errors, and I'm forgiving of human error. We all err.
However, there seems an institutional rot at the PGMOL, led by a cabal of mates, rather than the best-qualified people.
There are biases that I've pretty much proven in this study, especially the Homer refs, and the Liverpudlian/Mancunian anti-bias. Both of those are examples where refs cannot be making normal, rational decisions.
That so many refs treat Liverpool harsher than expected seems to be an increasing trend, led by the younger and less experienced refs, whose individual data is noisy but when combined it shows why Liverpool get so few Big Decisions.
If the PGMOL release the audio of the Hooper/England clusterfuck, then I'll believe their explanation, but it seems to me that it's likely to be Hooper asking England if he's completed level 16 of Angry Birds.
This is a chance to reset, regroup and rethink how they operate VAR and how they choose referees for games. Because, the best league in the world has the most shambolic refereeing system, cloaked in secrecy and where even the efforts transparency are token. (Where was the VAR dialogue by Tierney and Hatzidakis when Mac Allister was ludicrously sent off by a rookie ref?)
I don't expect a fully equitable outcome as I don't believe life, and sport, is designed for equal outcomes. But there are other ways to be fair.
Liverpool need a fair crack of the whip; the removal of referees with problems doing the club, and to be like other clubs who get their fair share (or more) of Big Decisions. Quite frankly, Liverpool under Klopp do not.
It may have cost the Reds a league title or two, it's that major. But also, we won't know how games would have unfolded had the Reds not been forced to play with 10 or nine men, or not get the penalties other teams regularly get.
And what would have happened if, in the last 300 or so games, an opposition player had actually been given a second yellow card?
I mean, crazy stuff like that. It happened so long ago that the player in question later joined Liverpool, played 269 games for the club, spent a season in Germany and is now in Saudi Arabia.
I know, I'm asking too much, clearly.
Thank you for reading this free article, and congratulations for getting this far.
Comments are for paying subscribers only as part of our respectful and well-informed global community. This is where I spend most of my time discussing football and the Reds. Again, any errors will be corrected ASAP, once I’ve played some Angry Birds on my phone.
Keep reading with a 7-day free trial
Subscribe to The Tomkins Times - Main Hub to keep reading this post and get 7 days of free access to the full post archives.

