


Liverpool's Underlying Numbers Are Significantly Better Than 2019/20 Champions'
FREE READ. Comparing Liverpool’s Underlying Numbers with 2019/20 and 2023/24


I spent the early part of this week finishing writing a long piece I started last week (after the win in Germany), that looks at why Liverpool fans still seem a bit lost, underwhelmed, and generally far from happy after what was then 11 wins from 12 (since when a very good draw at Arsenal robbed the home side of closing the gap from four points to one point).
My concern remains that Arne Slot, who had just overseen the best first 12 games in English football history, is not being judged against Jürgen Klopp, but against the mythical, cognitively distorted memories of Klopp and his actual numbers.
(Klopp was about so much more than numbers, of course, but the underlying data shows how his teams played.)
And so, before I publish that long read either this week or next week, I wanted to share the data in a short piece, as it’s worth viewing on its own, and would have only added to the 6,000 words already penned.
So this is a fairly basic comparison, with xG for and xGA (Against) taken from FBRef. (I haven’t spent ages honing this piece, so apologises if it jumps around a bit.)
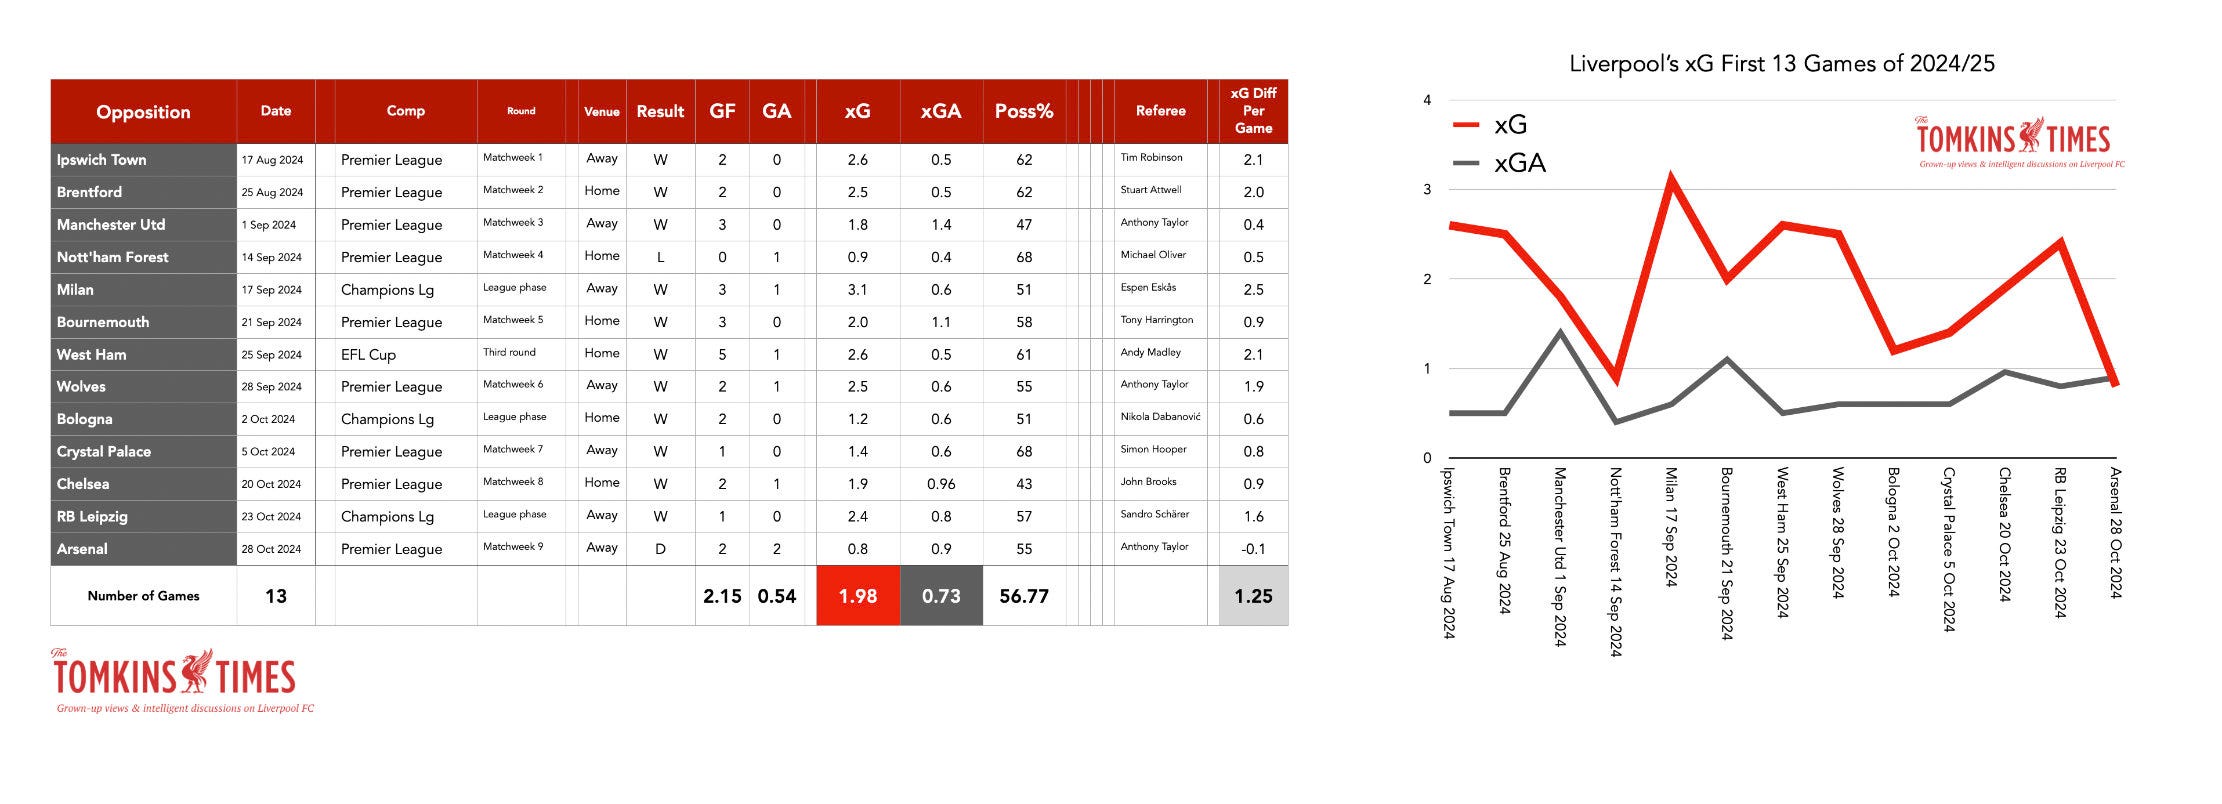
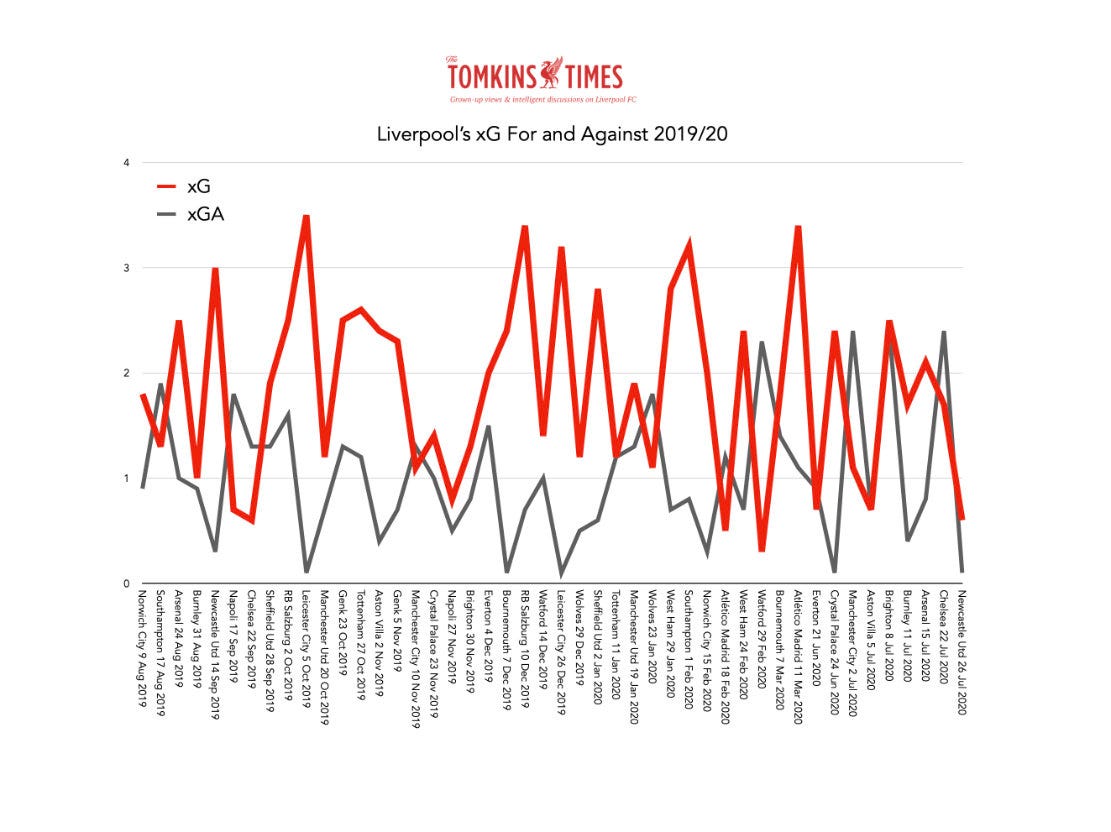
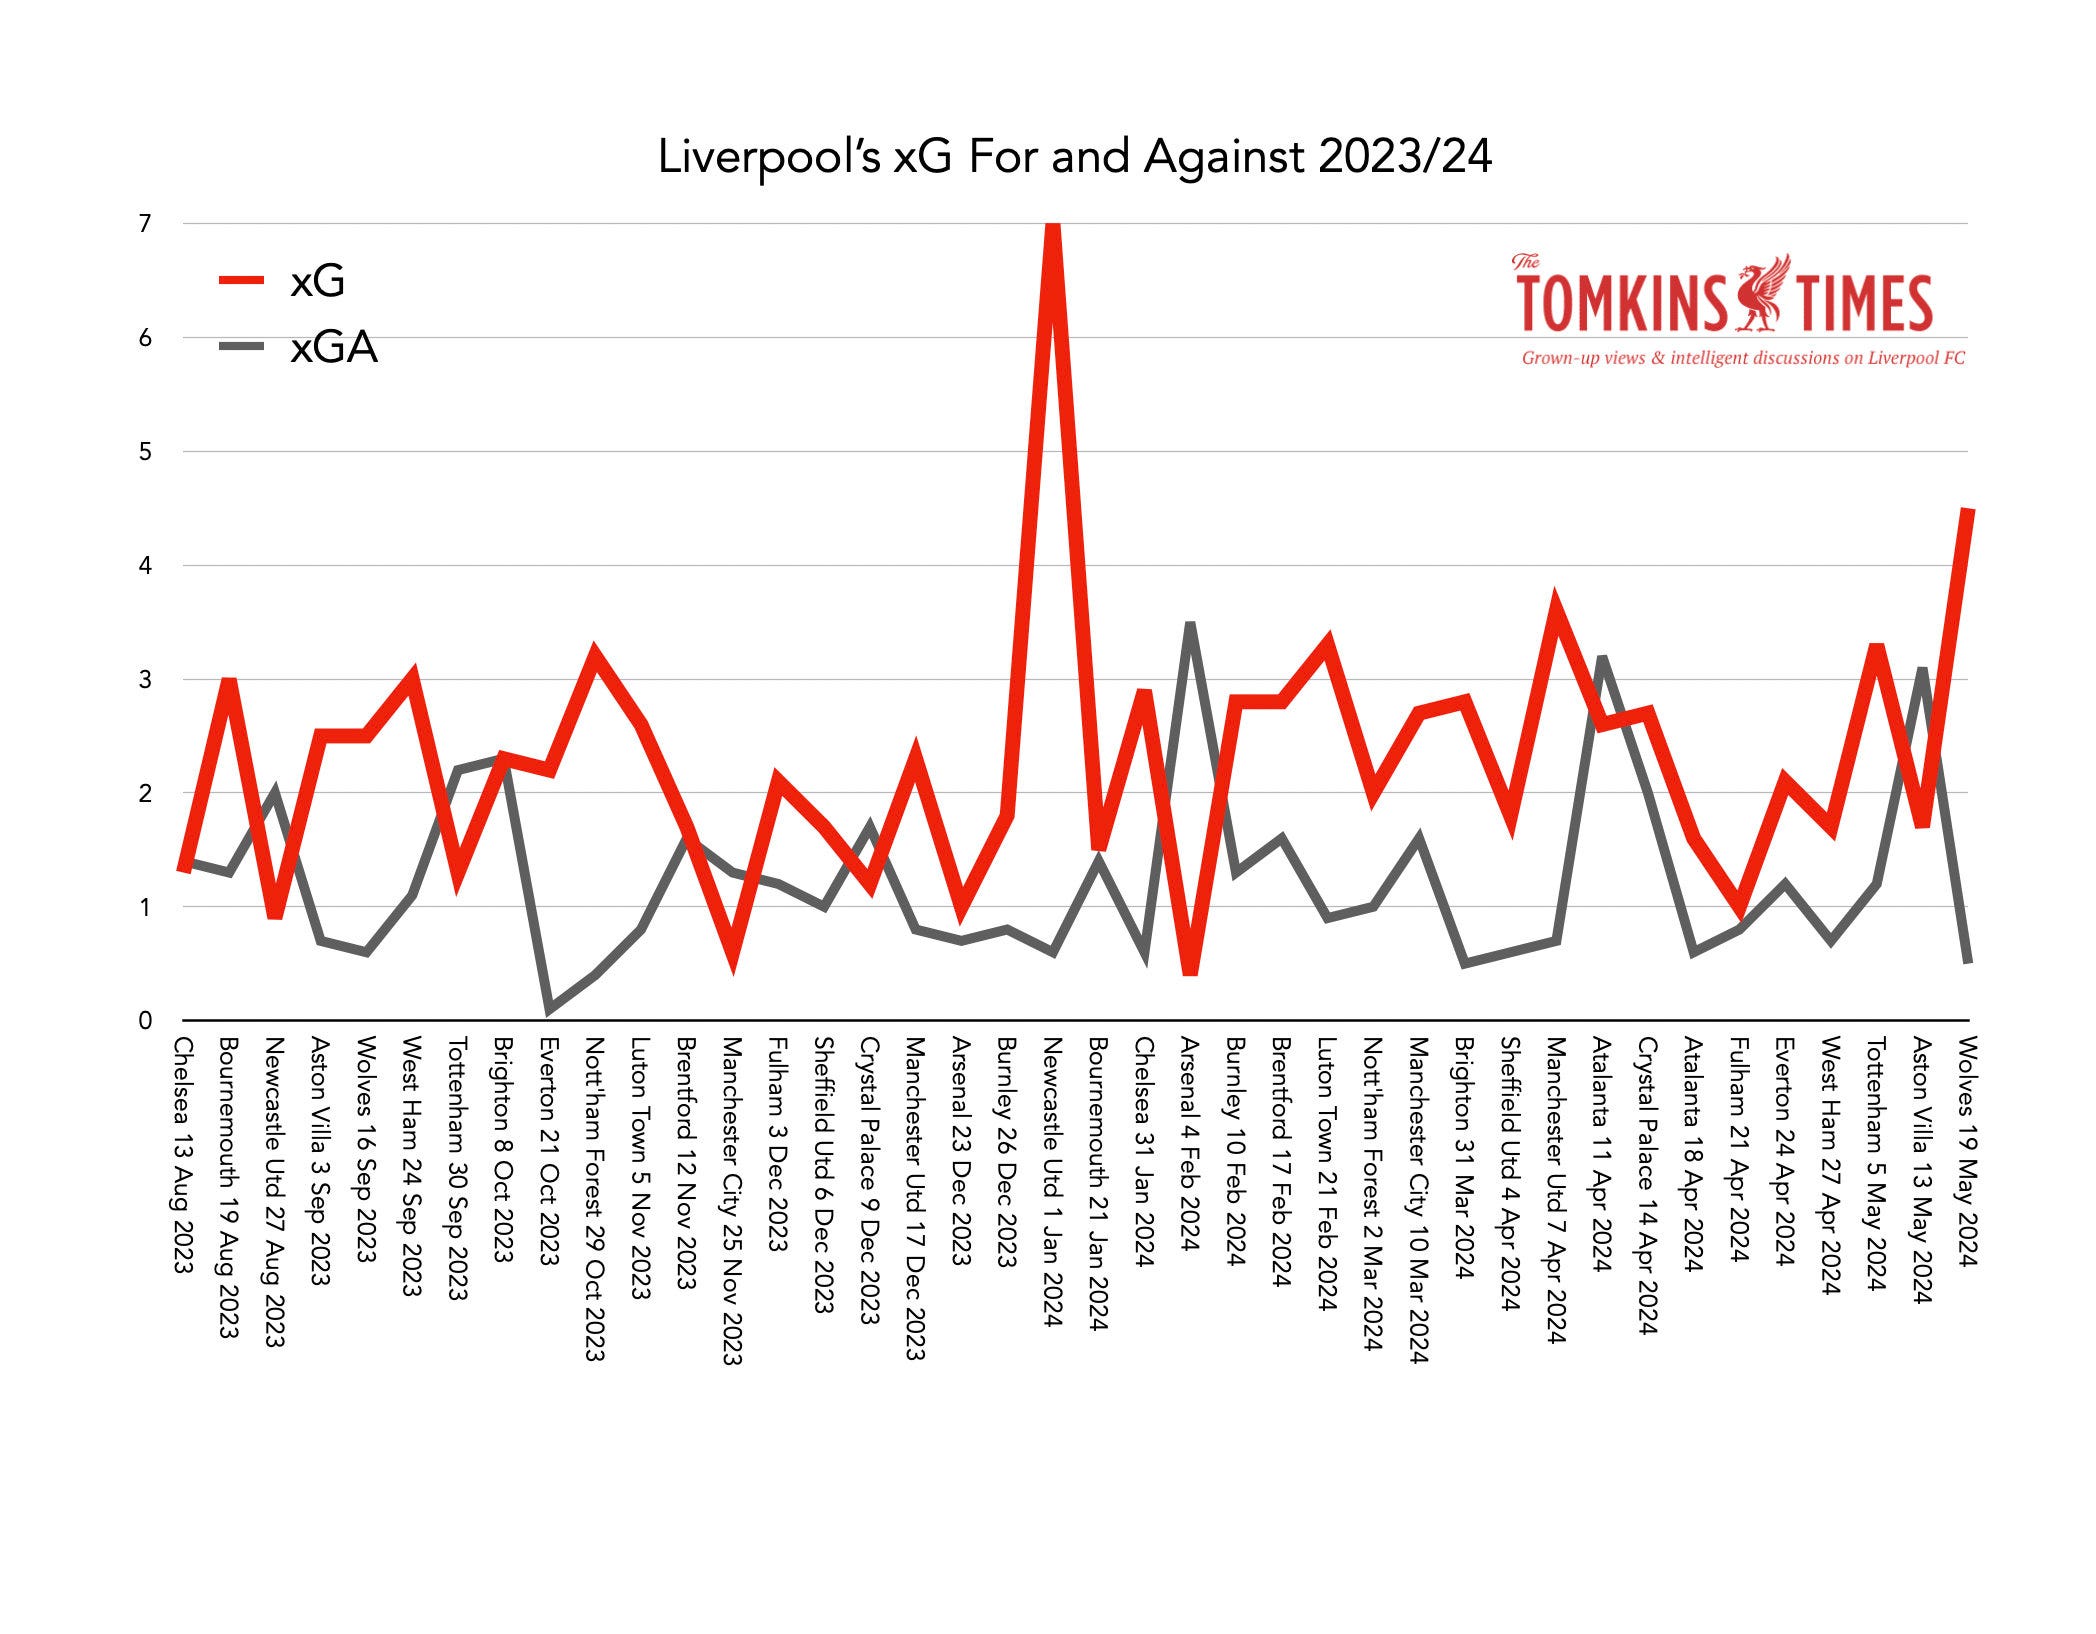
To assess Arne Slot’s start, it made sense to compare it to last season (the season before, and also a good season), and 2019/20, when the Reds blitzed the league – as that, to me, is the Kloppian football that Slot’s most resembles; a bit less chaotic than before or after.
However, I compared a few different samples: all season games vs all season games; first 13 games vs first 13 games; and also the same fixtures Liverpool have had this season vs last season.
No comparisons can ever be like-for-like, as so much has changed, even from last year; but people keep comparing the Reds to the past, so let’s do it by data.
The xG data for Klopp’s earlier seasons were not on FBRef, and that’s also a different context. Slot did not inherit a poor squad, or arrive mid-season. But he did inherit a difficult challenge in replacing Klopp.
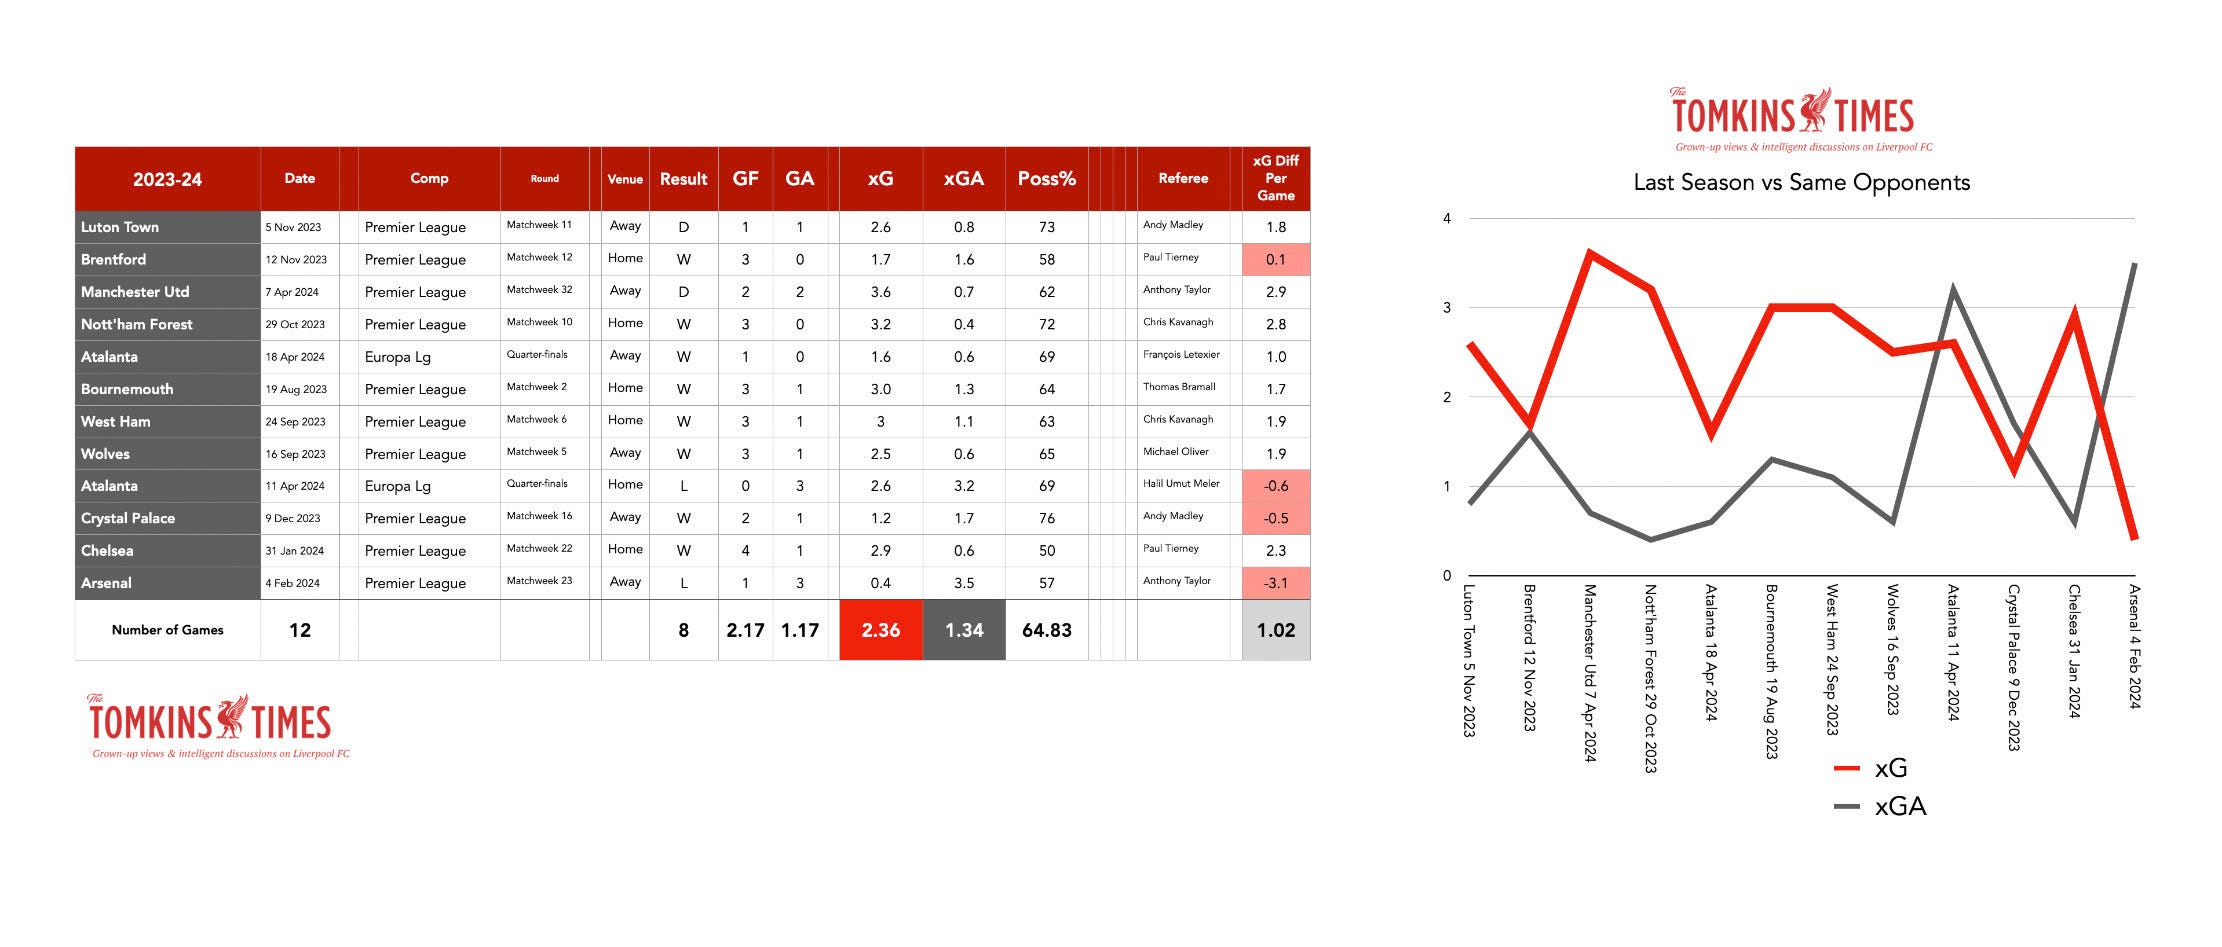
As well as the first 13 games, I also compared the same fixtures this season as last season (there’s no point in doing that for 2019/20, as most teams now have totally new players, new managers, owners, investors and possibly even new stadia!).
But whatever way I sliced it, the underlying numbers for Slot’s Liverpool, on balance, have been better than the underlying numbers for Klopp’s.
And remember, Klopp was fucking ace. (Not that you needed reminding.)
The one area where Klopp’s teams are better is in xG creation in more recent samples, but the size of the xGA (xG Against) saved makes Slot’s Reds the better balanced side, and with the significantly better xG Difference.
It also shows that as perfect as the start to 2019/20 was, the performances – as I noted on here recently – were not themselves perfect, and that this was the most balanced of Klopp’s sides.
A lot were hard-fought, close encounters on a few occasions. Liverpool ground it out a lot in 2019/20, but occasionally blitzed a team in the process.
xG Difference
If we say that an xG difference of +0.4 in a game is reasonable daylight between the two sides, then only once has there been a game as close as that this season, and that was -0.1 xG vs Arsenal (0.9 for Arsenal, 0.8 for Liverpool, a massive improvement on the chasm between the teams last season).
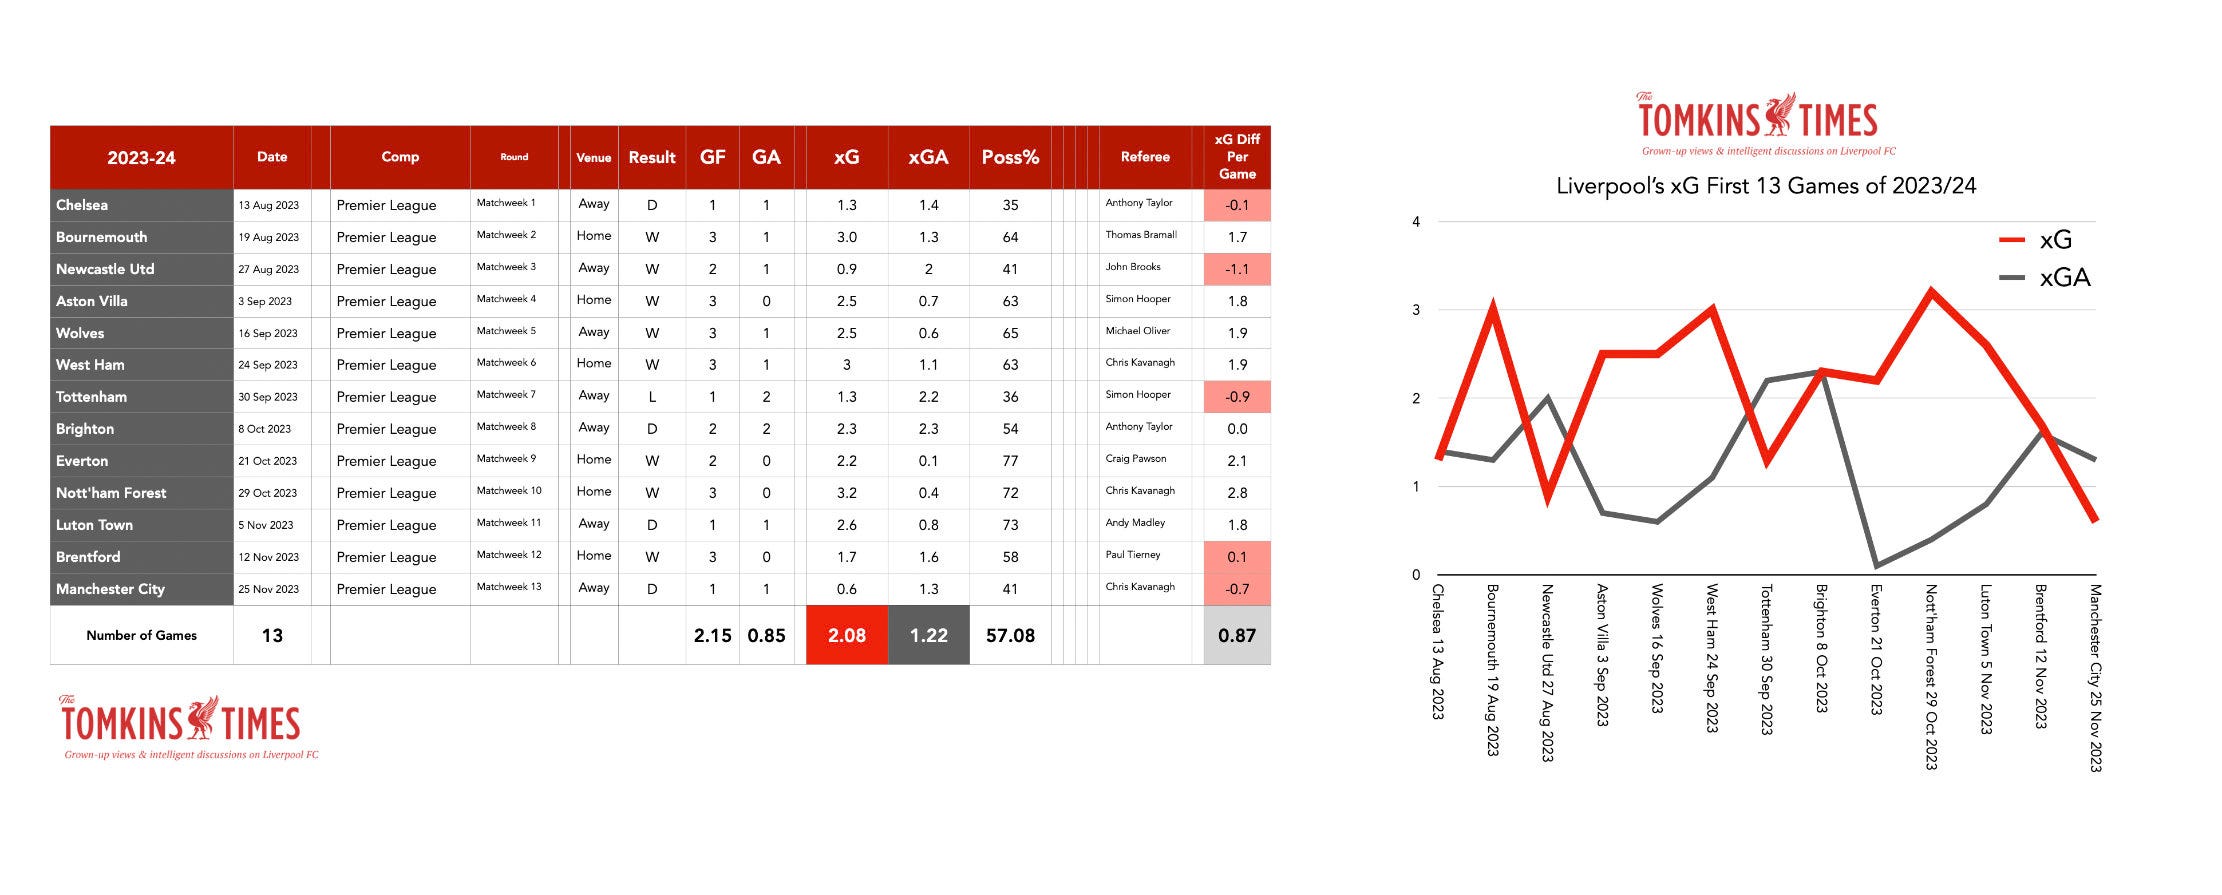
In the sample of last season’s first 13 games it was closer than that (or in xG deficit) five times and in 2019/20 it was four times.
While we can’t easily look at game-state, the most xG Liverpool have conceded this season is the 1.4 at Old Trafford, but 1.3 of that came with the score 3-0 to the Reds, who were trying to see out the game in 2nd gear.
Last season’s first 13 games were a bit like Arsenal’s this year: various red cards, two of which were laughable, and an infamous disallowed onside goal in a key game where the Reds ended up with nine men (if Arsenal think they have complaints this season, so that nonsense a year ago). Early red cards at Newcastle and Spurs changed those games massively.
So it makes for a difficult comparison.
I also removed the Europa League games, and had the data for the West Ham game this season but not domestic cup games of other seasons; and as West Ham are a Premier League team, at least they could be compared, unlike working out how good Linzer Athletik-Sport-Klub (LASK) were by comparison; plus in some of the Europa games, Jürgen Klopp rightly fielded the kids, and so you can’t really draw any conclusions in such low-level matches.
The timing, injury statuses and other context of when you play games (right after Leipzig away or right after Luton at home, etc?) means that comparing results in the same fixtures across seasons can be misleading, but it’s worth doing anyway, along with just comparing the first 13 games.
There were no teams as good as AC Milan, Bologna or Leipzig faced last season in Europe, other than Atalanta, who are now a Champions League team.
So I used their home and away data to replace the Italians at home (Bologna) and away (Milan).
Finally, I could compare all the games of this season (13) with all the games of the previous seasons mentioned, as each is about xG Difference, as an average.
Liverpool can only have a simple size of 13 under Klopp, but have played a wide range of opposition, albeit no one of lower league or lower European league status. They’ve played Brentford, Ipswich, Wolves and Nottingham Forest; but also Chelsea and Bologna at home, and Man United away (the only game not won by Liverpool in the first 27 league games of 2019/20), as well as away trips to Arsenal, AC Milan and Leipzig.
If anything, given the three Champions League games and now having played Chelsea and Arsenal (as well as United away), I’d say that this is a tough set of fixtures for a 13-game sample.
(Especially as Forest, Bournemouth and Brentford can now be said to be better than people expected.)
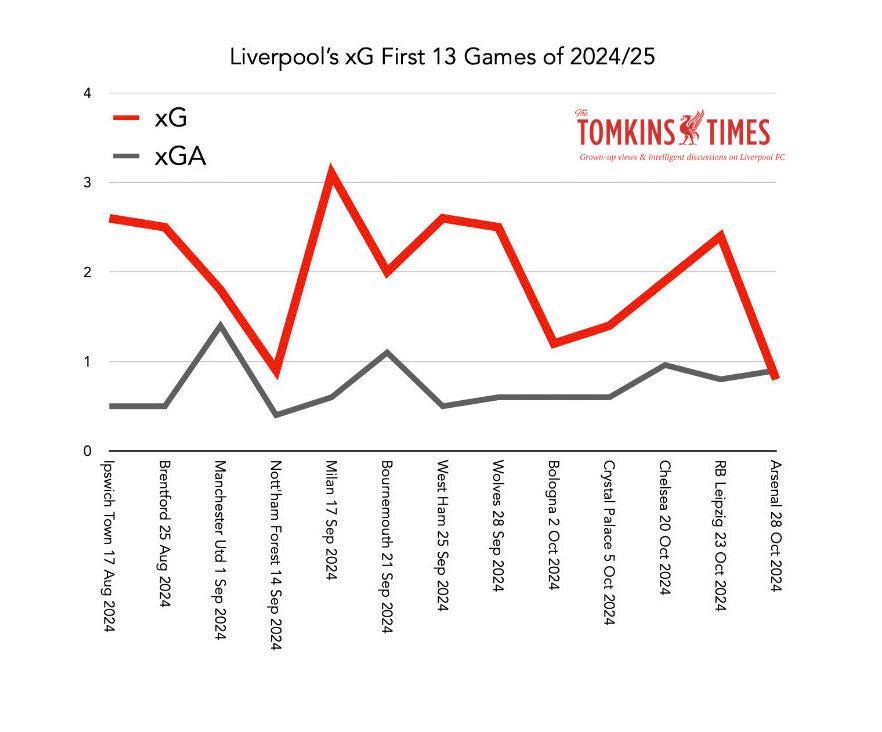
The Vital Graph!
Below is perhaps the only graph you need to see, as it shows the range of xG created (in red) in descending order, and the dark grey line (xG Against) follows a similar dip – where an xG Difference of around +1.0 exists in all comparisons – apart from this season, where the size of the drop of xGA is the outlier.
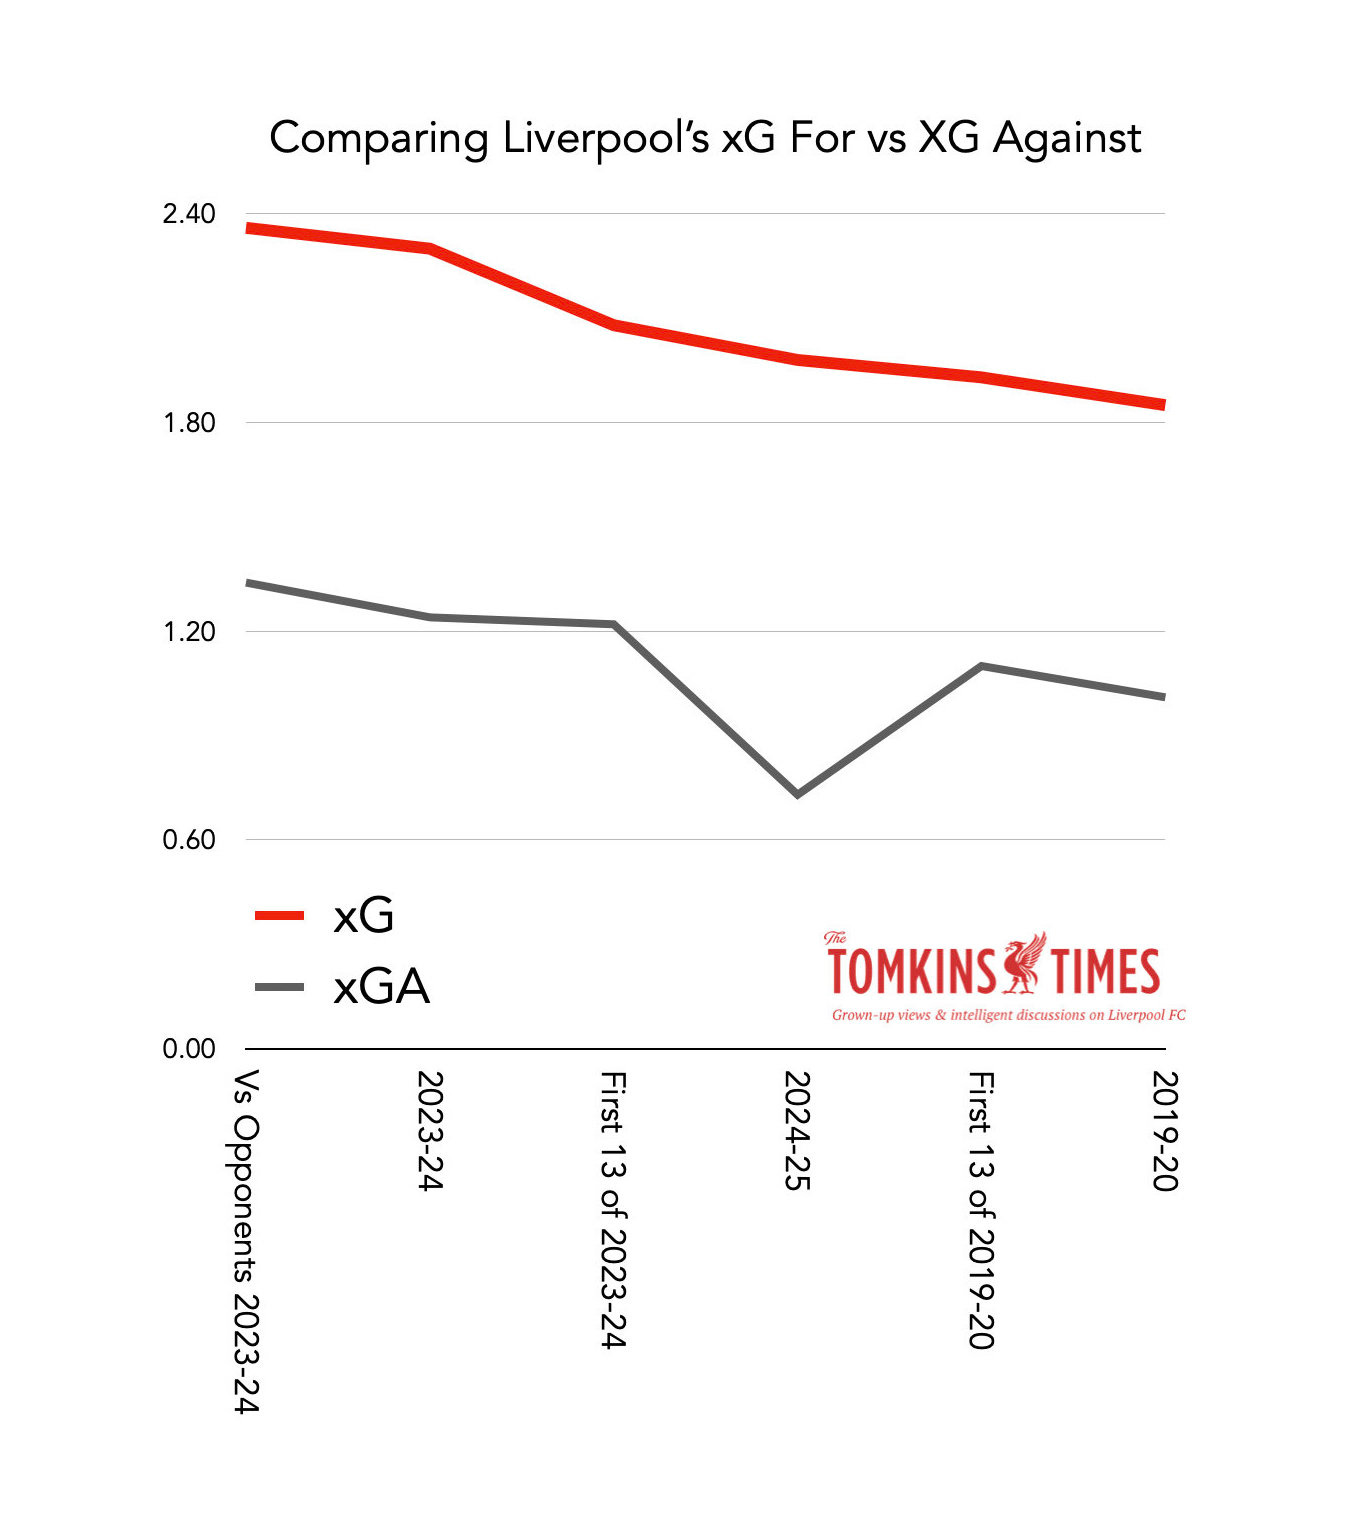
See the table below for the averages of each sample, either full season or 13-game.
An xG difference of +1.25 per game is absolutely elite, and as noted, it’s been achieved with a fraction more xG created than in 2019/20 and far less conceded.
In none of the Klopp-years samples I looked at did the xG Against average get good enough to dip below 1.0, but the average under Slot is just 0.73, which mostly explains why the Reds have conceded only a miserly 0.54 goals per game.
By not conceding many goals, the Reds haven’t had to go gung-ho for equalisers or winners too often, and it also means less possession at times, but retreating into a strong resting defence, meaning less possession, and not more, since Slot arrived. (But there have still been high-possession games, when the ball needed passing to death.)
If people are finding this season less exciting than last season, it’s because the Reds are not creating as much, and not concedi ng as much. It’s a bit less chaotic.
But they are creating more than in 2019/20, and conceding far less.
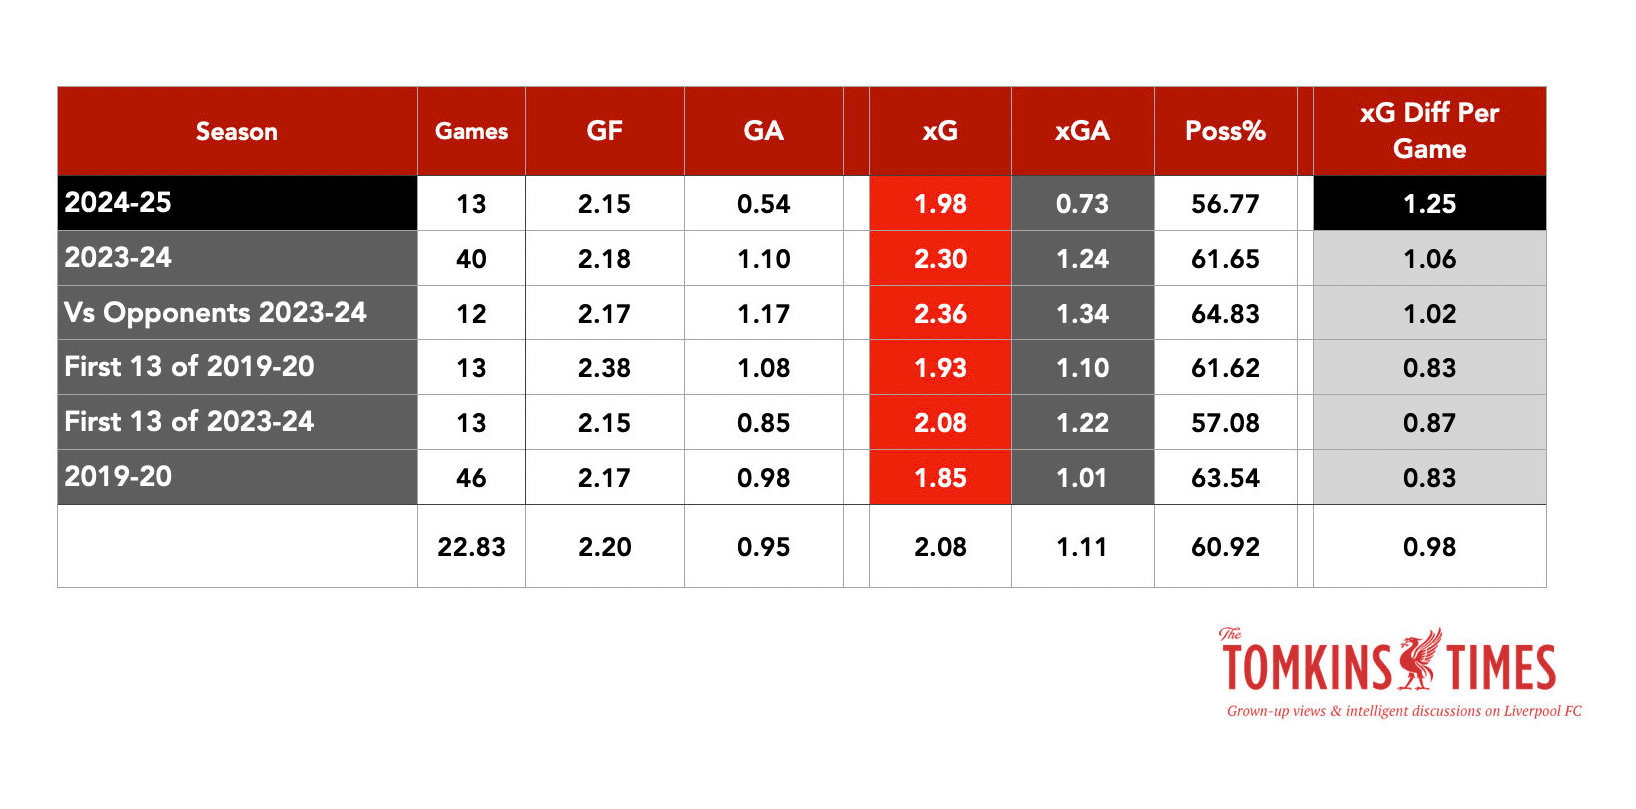
Things can always change in football, but the underlying numbers are better than in 2019/20, to quite a significant margin. That’s better than we had any right to expect, I would say.
Keep reading with a 7-day free trial
Subscribe to The Tomkins Times - Main Hub to keep reading this post and get 7 days of free access to the full post archives.