Objective Data: Liverpool Are Refereed VERY VERY Differently To Rival Clubs
Free Read: Detailed Data Analysis of Premier League Refereeing, 2015-2023
Note: I first published the following article in early August (behind the paywall), albeit researched it at the end of last season. This is now republished, free for all to read, with a new introduction. (And for subscribers to use as a thread about refereeing in the Premier League.)
If you appreciate the work, feel free to share it. At the very least it’s worthy of a discussion beyond these red walls. (And it took an age to research.)
Last time, subscribers noted that it might be better with the teams anonymised, but as this is a Liverpool site, they'd work out who I was focusing on. Also, it would make for a good academic study, as suggested, but having done one before (on transfer spending), it's a lot of work.
As ever, the data is public, so anyone can go and “do their own research” in the most good-faith meaning of that expression.
Click on the name of a ref and you can get data for all their games, and filter by season, period, club, etc. (It defaults to 2023/24, so play around with the settings.)
The new yellow-card law implementation (time-wasting, kicking the ball away, etc.) will be interesting, as it's much needed to stop teams ruining games (game-vandalism, as I dubbed it), but look at the yellow card anomalies in Liverpool games already.
Will this be another 3-week clampdown? Will some refs show less backbone and let things slide? (Basically, the entire refereeing body has just spent the last 10 years letting things slide.)
I would think the new approach will help Liverpool, but as you can see, the old one was definitely not helping.
*My biases are clear, but the data should speak for itself*
Neutrals can ignore any of my subjective commentary and focus on the objective data, if any neutrals care. (No, I thought not!)
I do also think that a few of the referees who seemed to have a serious problem with either Liverpool FC – or more likely, Jürgen Klopp – have retired; but some with very iffy data still remain in place. By far the iffiest is Paul Tierney, whose data is worth examining more closely, but this is about referees in general; albeit Tierney is part of a cluster of refs whose ‘preferences’ seem apparent (see the data).
Indeed, location of where the ref is from/lives and their age remain absolutely huge factors, and this needs independent research, and explanation and action.
It seems that refs are not “unbiased”; at least based on where they live or where they grew up, even if they don't support a team from there (which could mean immense social pressures when it comes to making decisions; random controls suggest this is not 'just one of those things', but a true warping of how a referee feels he must make decisions, or chooses to make decisions).
I'm aware that the officiating stuff can get boring for some, and I wish I felt it was a case of “you win some, you lose some”, but on Big Decisions, Liverpool "lose some, win some, lose some" at that kind of 2:1 ratio a lot of the time. Over the bigger datasets covered, and every league game from 2015-2023, we're talking about hundreds of matches per club for “things to even out”.
Not that everything should be equal in life (you can't guarantee outcomes), but I'll get onto that. I don't want favourable refereeing, just competent refereeing, and unbiased refereeing.
Also, I've not looked at things like win percentages when referees do teams, but Big Decisions (penalties, red cards) for and against. (Plus some stuff on smaller decisions, i.e. yellow cards.) Referees can't make a team win or lose, most of the time; but they can influence results, clearly.
A penalty or a red card massively skews the likely outcome of a game. So bear that in mind.
Plus, I hope this is the last time I mention the officiating this season, beyond dealing with a normal distribution of good luck and bad luck.
Anyway, the free-to-all article follows below, and if you receive the mailing list version, some of the images may be missing due to email provider size limits.
Objective Data: Liverpool Are Refereed VERY VERY Differently To All Rival Clubs
Detailed Data Analysis of Premier League refereeing, 2015-2023
Comparing Liverpool to Three Closest Rivals, aka the Best Four
Here’s the rub: Liverpool are refereed radically differently to their rivals, which can be shown clearly in the data.
I will discuss reasons why I think this is the case (no need for tinfoil hats, as it’s mostly ‘fallible human’ stuff, but this is a fact: the numbers clearly, indubitably, undeniably, indisputably (*puts downs thesaurus*) show it, in decisions big and small.
As I’ve said many times, I’m also bored of focusing on refs, but having used nearly-complete (but also partly out of date) data after the refereeing ‘scandals’ that dogged the Reds in the run-in, I wanted to spend time getting the data 100% up to date and 100% correct. And that’s what I’ve done.
Whatever the reason, the data now needs a proper investigation by the Premier League and the PGMOL, who should go to the source data like I have and repeat the processes, to see the clear anomalies.
As ever, the data covers decisions made, as you can’t quantify decisions not made.
All data is Premier League only (cup games can involve greater difference in skill levels).
Rivals – The Best Four
When it comes Liverpool’s rivals, referees generally treat them the same as each other on almost every metric you can look at; when it comes to Liverpool, these same referees are so radically different that it’s incredibly alarming.
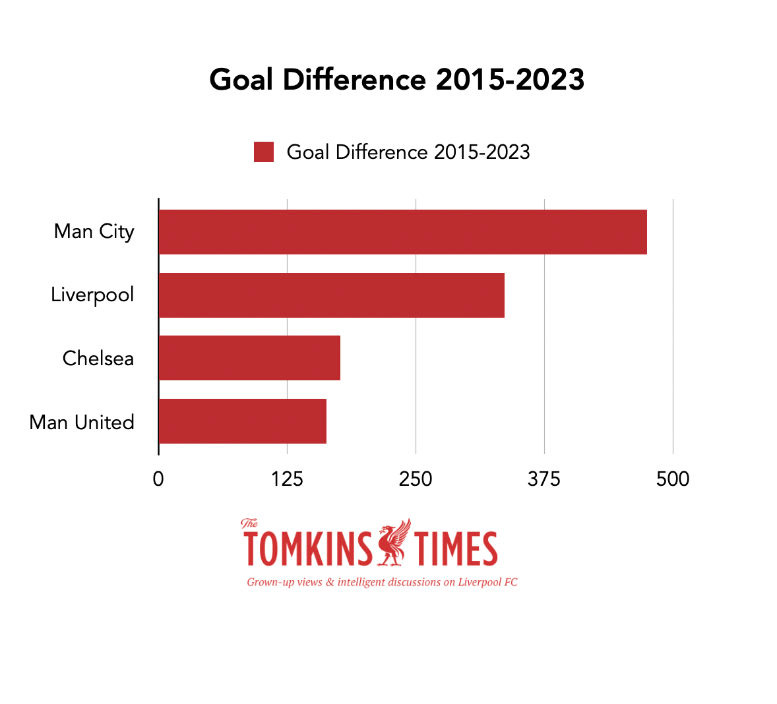
The four best teams since 2015 have been Man City, Liverpool, Chelsea and Man United in terms of league performance, and European and domestic cup extras.
Man City +475
Liverpool +336
Chelsea +177
Man United +163
As this just focuses on Premier League games, this the goal difference for each of the four teams over the eight-year period.
From that, you’d expect Liverpool to be doing pretty well on Big Decisions, compared to Chelsea and Man United, having essentially double the goal difference (106% more than Man United’s); and fewer Big Decisions than Man City, whose goal difference is a 41.3% increase on the Reds’.
For Manchester City, Manchester United and Chelsea, it doesn’t seem to matter what type of referee is in the middle.
For Liverpool, it makes a huge difference.
Unless where stated, the referees covered are mostly the ones who are eligible to do all of the clubs, albeit another glaring anomaly is that Merseyside refs – four of them – do not, or did not, officiate Liverpool games (one, Mike Dean, relaxed his own stance on this during Covid), while all Manchester refs do all Manchester teams.
(But there is some additional analysis on hometown refs and how it affects results.)
My arguments in this piece are more about subliminal biases, pressures on referees to deliver good ‘optics’ to the watching world (never more important than in the era of constant televised/streamed games, social media outrage and takedowns), and human-to-human antipathy clouding judgement rather than ‘conspiracies’.
But again, the data should speak for itself.
In almost all of the areas I’ve looked at – nearly 1,800 Premier League games from 2015-2023 (and more specifically, 1,194 games involving the Best Four) – most major clubs, no matter what the split of refereeing characteristics (location, age, and – as a totally random and humorous factor introduced to see what a random factor threw up – hairline, in keeping with my own follicly-challenged state), will be tightly clustered together, with maybe one or two slight outliers.
No matter where the refs are from, how old they are, or even if they are bald or not, will have zero impact on the Balance of Big Decisions for Man City, Man United and Chelsea, and within that, how many penalties they are awarded.
For Liverpool, baldness also makes no difference; however, the home town of the ref and age of the ref make a massive difference.
Dominance
All four clubs have a positive Balance of Big Decisions (red cards and penalties for vs red cards and penalties against), as you would expect to see from teams that have 55%-75% of most games, in terms of shot balance, xG and possession.
Every 10.6 games they get one Big Decision more than the teams they play, so roughly four extra big decisions (+4) per season. So, it may be six Big Decisions against them, and ten for. (This should be even more of a positive gap for Man City, as the outstanding team in the period covered, with Liverpool next in line, by some distance.)
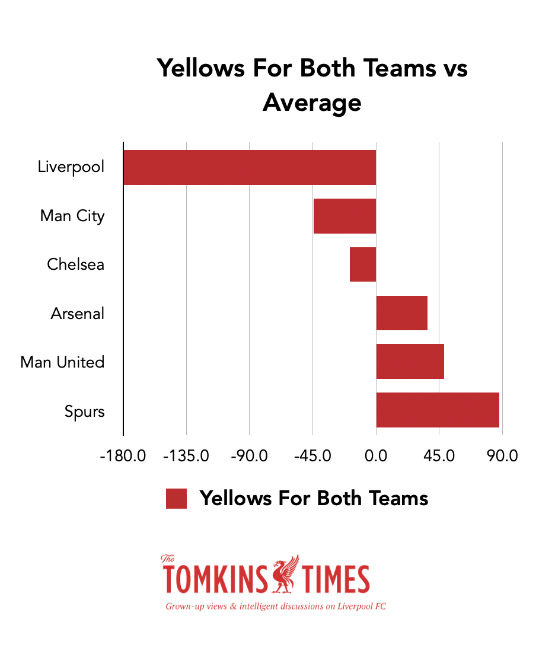
Widen the net to include Arsenal and Spurs, and along with City, United and Chelsea, they are all much of a muchness when it comes to yellow cards, too.
But bizarrely, refs do not use their cards anywhere near as much when Liverpool are involved, as if they referee the game in a totally different style.
This then leads to further issues, as if you’re not giving yellow cards, you don’t get as many second yellows, reds or penalties. You’re observing, rather than officiating.
All five clubs are within a standard deviation of the norm on bookings within games. But not Liverpool.
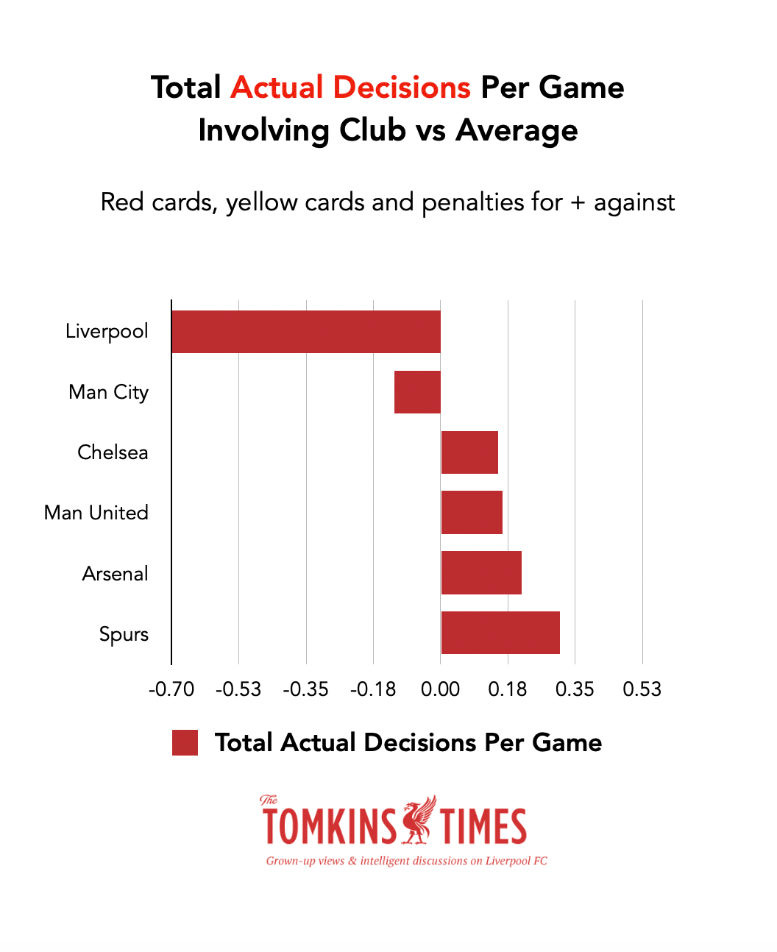
And it’s the same for major decisions, too:
Liverpool are outliers for Big Decisions (red cards and penalties, for and against).
Liverpool are outliers for penalties awarded.
Liverpool are outliers for yellow cards in their games.
Liverpool are outliers for any decisions at Anfield.
And the issue carries across to the specific VARs, too.
I will compare referees’ treatment of Liverpool to:
their own refereeing styles; and
to the general pool of refereeing styles and overall averages therein.
However I slice it, it looks bad for Liverpool … except when the refs are from nowhere near the northwest.
Now, you can find a way to get Liverpool closer to normal, as the problem is a cluster of referees, not referees in general. The issue is that the Reds get these “bad” refs more often than expected.
For Liverpool, with this cluster of refs (location and age), it’s extreme statistically-defined outliers – or ultra-extreme outliers – almost all the way.
The only positive refereeing statistic I can find for Liverpool in any of the masses of data is that they get significantly fewer bookings than the other five Big Six clubs.
But of course, as is clear from the graph above, the Reds’ opponents also get significantly fewer bookings.
Relatively speaking, refs don’t use the book very much in Liverpool games, allowing a free-for-all.
Seeing that Liverpool are not an overtly physical or dirty team* (with only Fabinho’s tactical fouls and James Milner’s full-throttle tackles an issue in recent seasons), this works against the Reds and allows physical teams to overstep the mark without punishment.
(*Liverpool have had dirty or overly physical players in the past, but Klopp’s football is more about pressing and staying on your feet to win the ball, not about hardmen, or flying into tackles. Fabinho last season was a walking yellow-card machine as he was so slow into tackles, and always liked a tactical yellow, but so do the midfielders of all the rivals.)
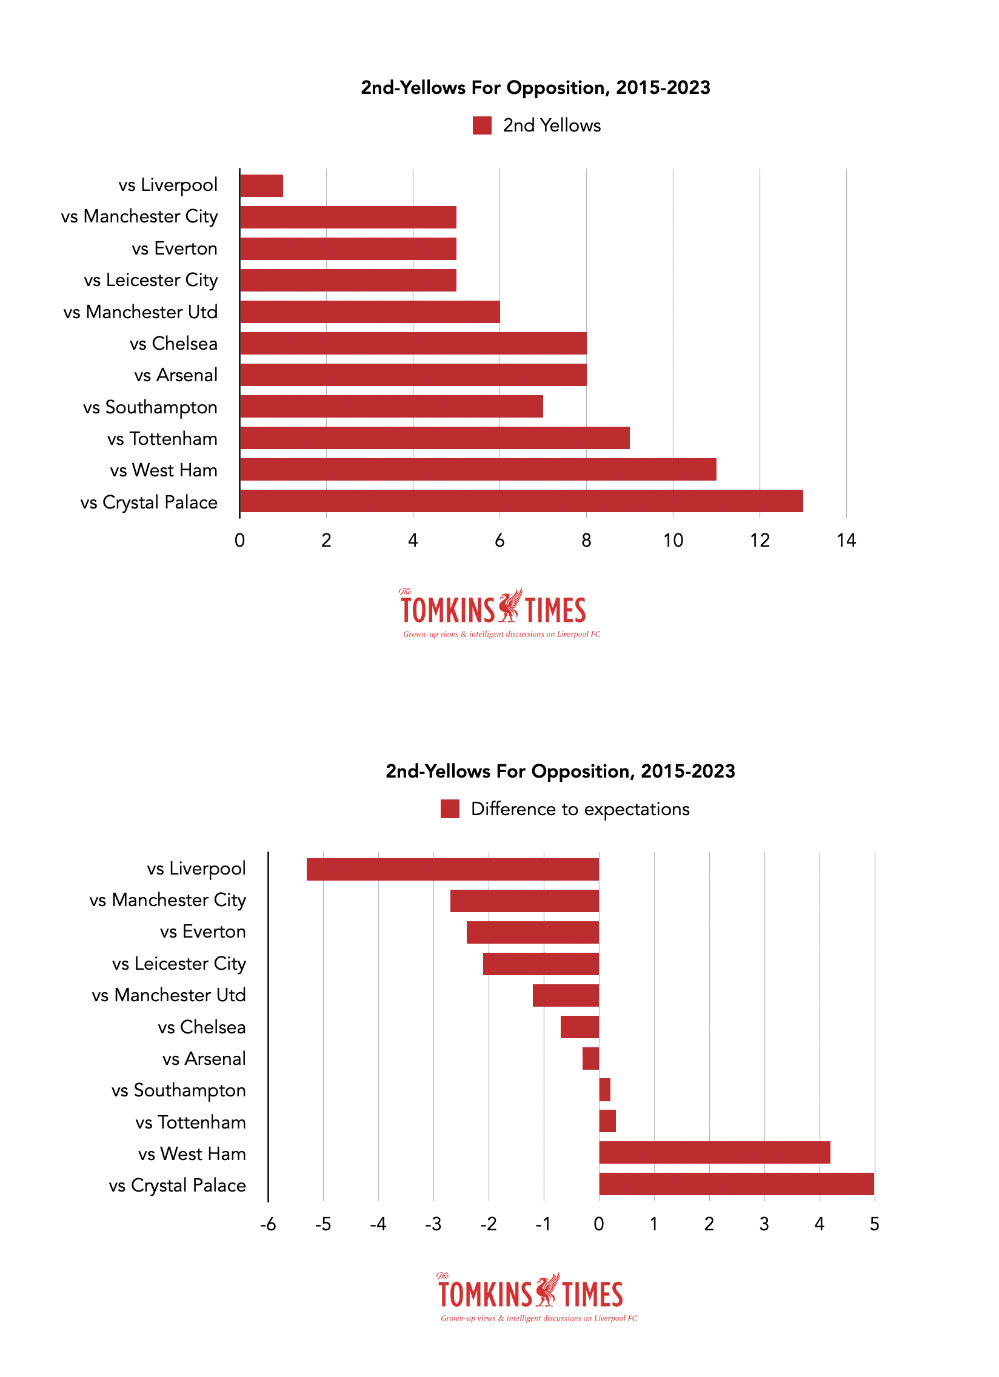
Maybe the lack of second yellow cards to Liverpool’s opposition is the most important piece of evidence: the starkly different way the Reds are reffed, and which – given the lack of first yellow cards – shows why no opposition player has had a second yellow card against Liverpool in the league since 2015, when Sadio Mané – playing for Southampton – was the culprit; and all other Premier League regulars range from receiving five to 13 second-yellows for opponents, and some with fewer seasons in the top flight since 2015 have benefitted from 8-10 second yellows. (As first alerted to me by Andrew Beasley.)
So if this chart started at the end of 2015, Liverpool would be on zero:
This has to be more than a mere coincidence, and something about the way referees don’t want to book players in Liverpool matches, because they don’t want to be tied to that awkward early booking, which makes them nervous about having to make bigger decisions.
This is why refs would warn a time-wasting goalkeeper 17 times, then book them in the 93rd minute, so as to avoid the drama of sending off a keeper, for which they’ll be lambasted in some quarters.
Again, how weird is that?
I’d really like to see an explanation for this from the PGMOL, and a look into the reasons why; beyond my own hypothesising. How can one club’s games be treated so differently?
(As an aside, clubs like Palace, Leicester, Bournemouth and a few other mid-table regulars and relegation candidates won penalties more frequently than Liverpool, 2015-2023. My sense is that refs are more scared of making decisions in favour of big clubs, more than they are smaller clubs, but Liverpool scare them more than others; plus, more English attackers will gain you more penalties, as my detailed research has shown in the past, which I’ll briefly cover again in a moment. Fans of smaller clubs frequently say that they are hard done to, but the opposite is often true.)
This general passivity leads to fewer penalties as well, as part of an overly cautious or overly ungenerous and almost paranoid approach; to give Liverpool a Big Decision will cause social media outrage (just monitor it and see; I gave up doing so years ago, but it was clear, as rival fans leapt up with their confirmation bias). And of course, as I’ve shown, better teams should get more Big Decisions.
It often feels that it’s not about the right decision, but the most palatable decision. This is, after all, the era of ‘optics’. It’s not so much what you do, but what you are seen to be doing.
A distrust of foreign players may also play into it, as I’ve previously shown how, in the Premier League, English players (across seven seasons and 600+ penalties) were awarded more penalties per minutes played, and conceded fewer penalties per minutes played. (Bear in mind that all the foreign players here for that period – 2012-2019 – tended to be amongst the best of their nations due to work permit criteria, but the English players were a mix of best to those who can ‘get by’ in the Premier League. Jon Flanagan was much more likely to win a penalty for Liverpool than Roberto Firmino.)
Liverpool, as I’ve also noted many times, also win more penalties with British managers, and with more minutes played by British attacking midfield or forward players.
Do the Job Properly
Let me be 100% clear. I don’t want to persecute referees or start witch-hunts – just have fair refereeing.
It’s a very well-paid, high status job (with a ton of power at the fingertips holding those whistles) that should be done properly, with the difficulties acknowledged, but where scrutiny is totally valid.
There’s no excuse to send death threats to officials (albeit I’ve had a few sent my way by people over the years), but they control a lot of what happens in a game of football, and towards the end of the season, referees at Anfield clearly lost the plot.
They’ve also not seemed to apply the laws fairly to Liverpool, based on the data.
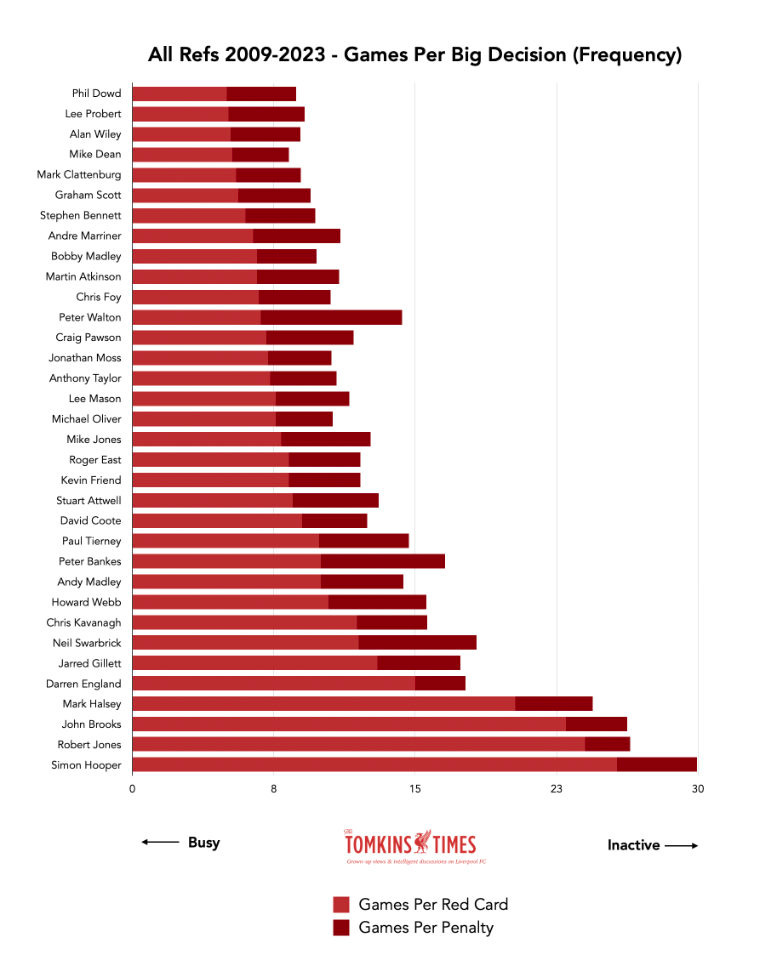
And as you can see, using a different dataset (2009-2023), referees can have very different styles; so if you keep getting the same few refs (and Liverpool consistently get less variety in officials), then you can get stuck with a specific style of officiating to that which your rivals experience.
In the chart below, the longer the bar, the more games it takes for the ref to given red cards (light red bar) and penalties (dark red). Penalties are almost always given more frequently than red cards. (Newer refs generally seem far more lenient. Mancunian refs generally hover in the middle.)
Northwest Issues
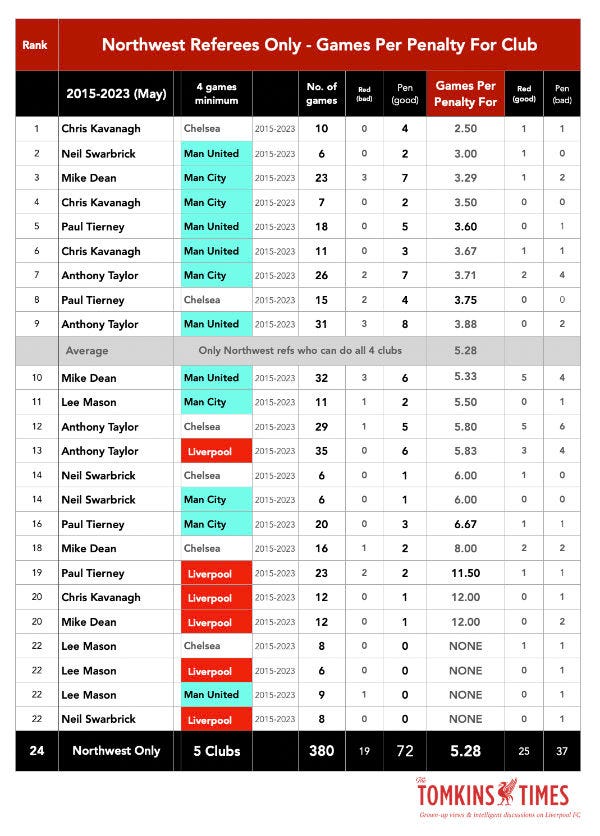
The first is a handy one just to show how northwest refs really don’t like giving Liverpool penalties, compared to what they give other clubs, and also compared to what other refs give Liverpool. (Minimum of four games per ref per club.)
Remember, this is just penalties for – listed at a rate of greatest frequency downwards – but the overall balance of Big Decisions often has a similar outcome.
As you can see from the charts below, not one single example sees Liverpool above the overall average, and only Anthony Taylor gets close to average.
Five of the worst seven are Liverpool combinations (and remember, Paul Tierney only gave his first Liverpool penalty over 20 games into his career doing the Reds, a few minutes after his assistant elbowed Andy Robertson.)
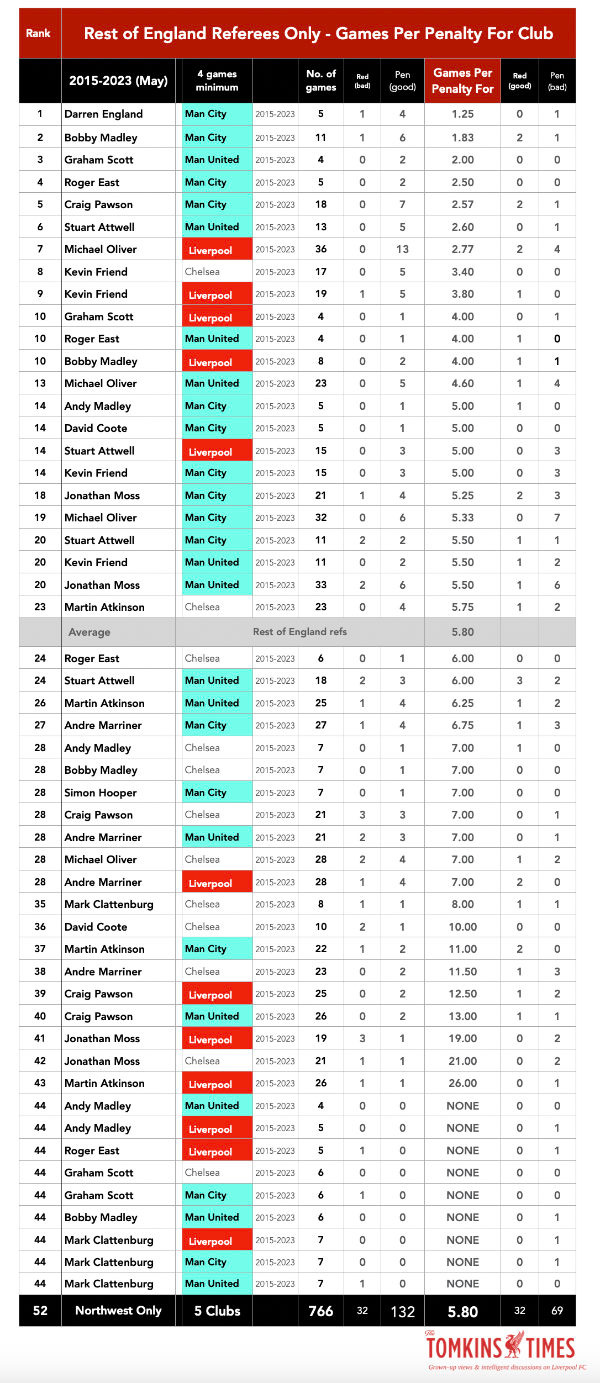
These tables are designed to fit on the screen at once (as best as possible), and to give a feel for the different approaches by northwest refs to northwest teams (Liverpool in red, Manchester clubs in blue), and then to contrast to rest of England referees, who are still not overly generous to Liverpool, but where the contrast is still alarming. The grey band is the average for each set of referees for this specific data – so averages just for these four clubs.
Northwest Refs
Refs of England Refs
Whereas for the rest of England, the mix still sees Liverpool harshly treated, but it’s a far more natural looking spread of data. Chelsea are the team to benefit least, but also, the team to be least severely punished – the Reds still cluster around the bottom, too (and have seven below average, and only four above).
Remember, Chelsea’s attacking xG is miles behind Liverpool’s for the Klopp era, as is Manchester United’s.
This sums up the key disparity, without which Liverpool’s refereeing numbers would look pretty much the same as other clubs, within reason.
When it comes to northwest refs, you have to go four referee/club combinations below the average for this cohort to see Liverpool’s first appearance (Anthony Taylor), before scanning down to where the other five refs are all within the bottom seven: Paul Tierney, Chris Kavanagh, Mike Dean, Lee Mason and Neil Swarbrick. By contrast, the Manchester clubs are mostly above the average line, meaning they are “generously treated” by those same referees.
With the rest of England referees, Liverpool have five of the top 14 points, albeit none above 7th. Man City have four of the top six, and Man United two. The Manchester clubs then straddle the average mark, along with Chelsea.
However, Andre Marriner, Craig Pawson, Jonathan Moss, Martin Atkinson, Andy Madley, Roger East and Mark Clattenburg, for Liverpool, dominate the bottom of the table by giving Liverpool penalties at a lower-than-expected frequency. But at least it balances it out somewhat, overall.
And as noted, I would expect – within some margin for error – for Man City to be winning more penalties than Liverpool, but Liverpool ‘should’ be winning far more penalties than Man United and Chelsea, if that same logic holds true.
Big Decisions
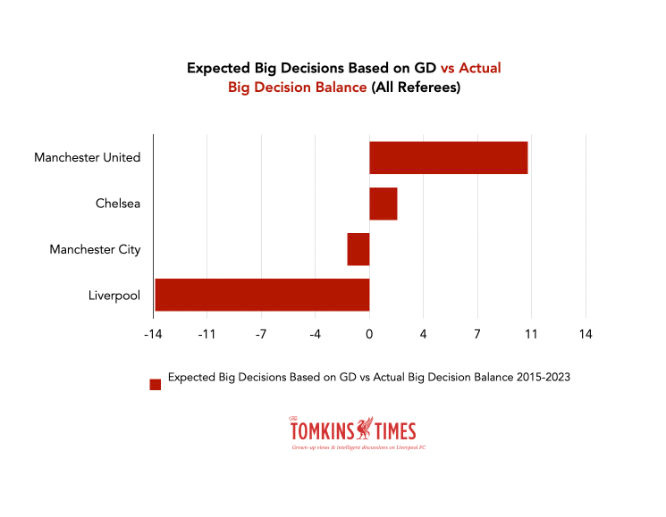
There are two obvious ways to look at Big Decisions, for and against, with Big Decisions defined as penalties, red cards and second yellow cards, and thus excluding first yellow cards, and obviously excluding all the uncountable decisions not made. For Big Decision rate I have created Expected Decisions.
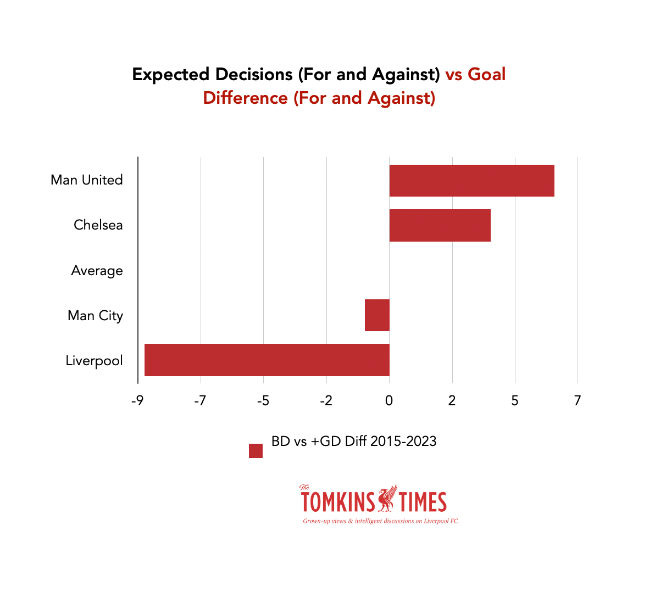
One is to compare big decisions at both ends to goal difference, which deals with goals at both ends. (This could also be done with xG, which would probably favour Liverpool.)
Then, there’s Expected Decisions based on the frequency of Big Decisions From the collective of referees.
Either way, Liverpool seem more than a little hard done by.
Expected Decisions (For and Against) vs Goal Difference (For and Against)
This is the Big Decision record of referees when compared to goal difference. So, not in relation to their own styles, but in relation to eight years of game balance.
Expected Big Decisions Based on GD vs Actual Big Decision Balance (All Referees)
And this is the Big Decision record of referees when compared to the averages for the group of referees when refereeing these four clubs.
🤷♂️🤯
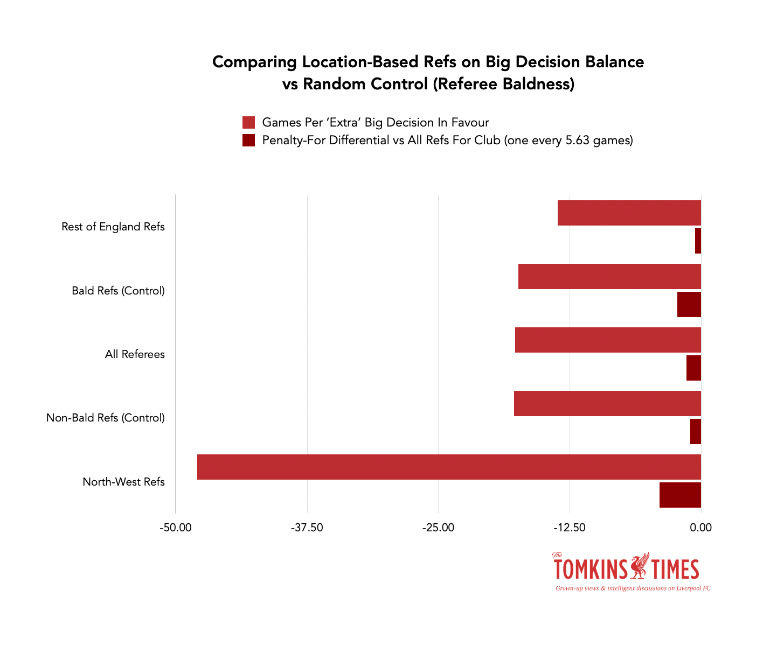
Random (Humorous) Control
As noted earlier, I created a random category, which could have been whether the referee is left or right handed, or tall or short; but instead I went with baldness.
This is also because my bald brethren are split across both sets of refs (northwest, and non-northwest), so it’s a way to see if it throws up a weird result.
Clearly, hair, or lack thereof, should not play a part in how many Big Decisions an official gives the Reds.
And it doesn’t play a part.
But being from the northwest clearly does by comparison, which suggests it’s not necessarily random when it comes to decisions for Liverpool FC.
Outlying Refs
You remove the outlying ref groups. Remove those and have the majority of refs from England, and all becomes much more normal.
You remove two sets of overlapping referee groups who absolutely hammer Liverpool in statistically significant sample sizes, and where their issues may not be random.
It turns out that baldness has zero impact on officiating data from Liverpool’s games, as you’d expect; it’s arbitrary and random, which is why I chose it, as a fellow member of the bald community.
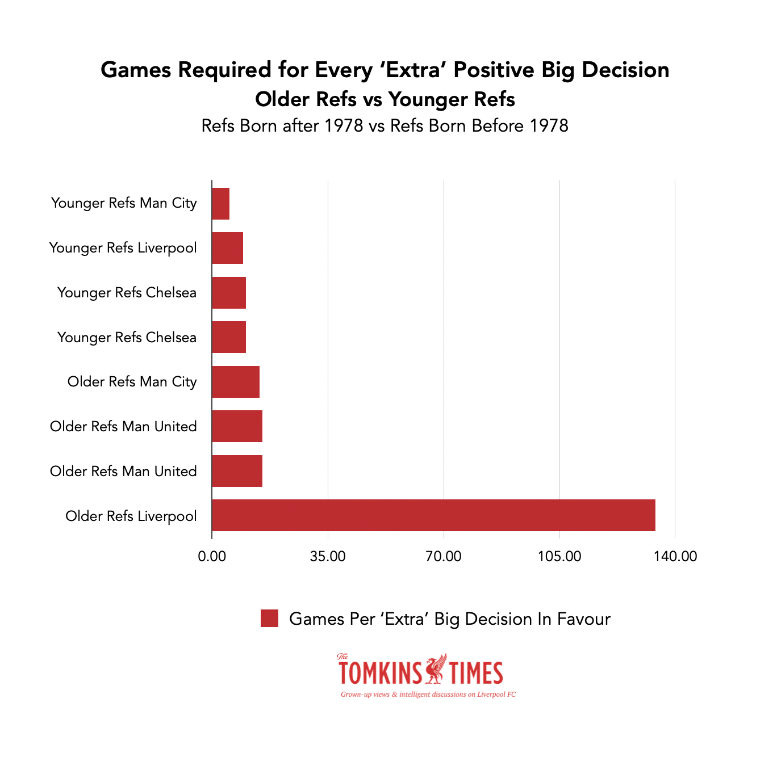
But if a referee is from the Northwest and/or is born before 1975, there will be massive deviations from the norm.
Now, within each group there are outlying referees, who give decisions at a different rate to the rest of that group; there are generous bald refs and mean bald refs.
But each referee has a sample size of 5-35 games, meaning some individual refs are have very small datasets.
However, grouping together by a characteristic that could be deemed to have some impact – where a referee is from or lives, and how old he is (in terms of what preconceptions and biases he grew up with) – almost always resulted in referees of that group having done c.100 combined games for each club, with some up to c.200.
Obviously it would be really weird if the refs from Manchester were markedly more generous to the Manchester clubs compared against the referees from the rest of England, as that would be too obvious.
… 🤔
Yet, of course, they are.
It would also be really weird if the refs from Manchester were markedly harsher to Liverpool.
Yet, of course, they are. (Weirdly, and conversely, Merseyside refs are the most generous to the Manchester clubs.)
Hence why this is a very serious matter indeed in terms of integrity of the decision-making process.
I do not accuse anyone of conscious bias, albeit I’m sure that exists, too, within an organisation like the PGMOL that regularly shares its beefs with managers and clubs in open discussions between themselves. (And how they’ll close ranks in such situations.)
But the notion of Mancunian neutrality has to be addressed here and now, and curbed.
It’s not just about Mancunians, though, as if you widen the pool to the northwest as a whole, to include Merseyside and all of Lancashire, you get even more extreme results.
I have compared referees against the average of all referees for all the clubs covered, and also compared referees against their own averages, so that I am not criticising a referee or group of refs for being harsh on Liverpool if they are naturally less generous overall. But the anomalies are clear.
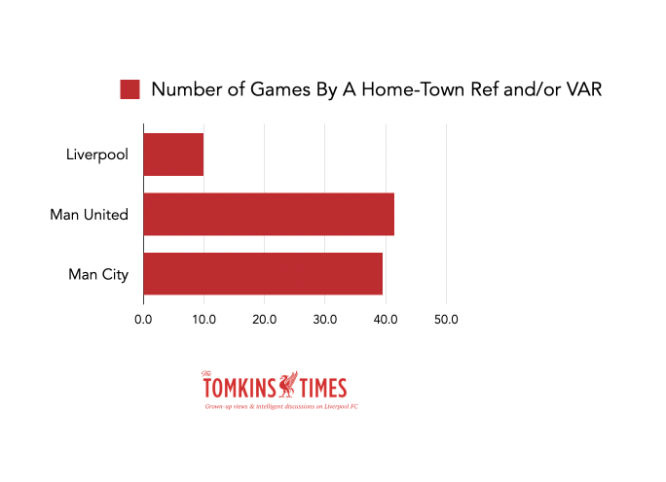
And this is how often the three major northwest clubs got get a hometown ref over the eight seasons covered:
The VAR Era
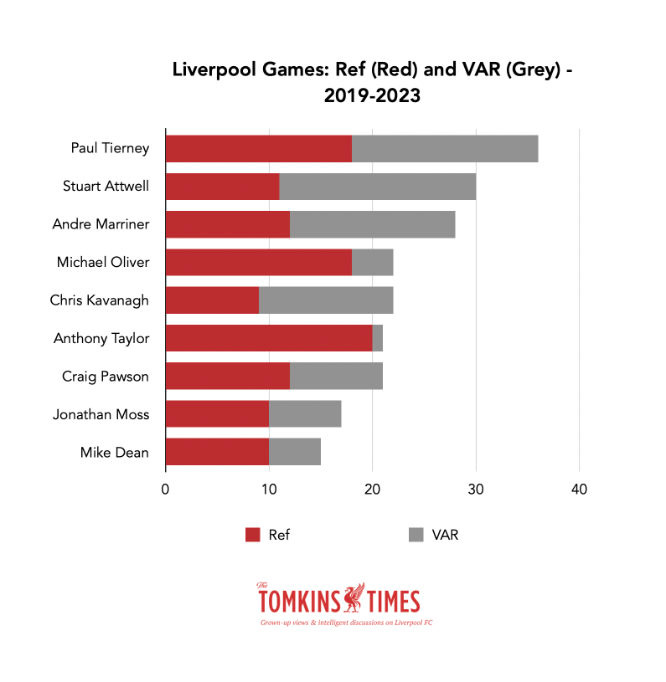
Since the start of 2019 there have been two referees in each game: the on-pitch referee, and the video referee (VAR). This has meant 152 league games in total.
There are just six northwest refs who have been able to do Liverpool games; three more from Merseyside who do not do the Reds’ games.
But three of the six Northwest refs barely did Liverpool anyway, and Mike Dean, Lee Mason, Neil Swarbrick have all retired; Mason became a VAR before leaving after a particularly bad decision.
Yet somehow they’ve been one of the two referees in a staggering 56% of Liverpool games since 2019 (48% refs just from Manchester). This breaks down as 37.5% as the actual ref, and 30.3% as the VAR, which seems harder to fathom when the pandemic is factored in, as these had to travel 200 miles to Stockley Park.
Given that this study has shown how different northwest refs treat Liverpool and Liverpool games in general, it’s even more disturbing to see that on subjective VAR overturns, these same refs have a record of two in favour of the Reds and SIX against.
On his own, Greater Manchester’s Paul Tierney has only given three subjective calls in 18 Liverpool games as a VAR … each to disallow a Liverpool goal or rule out a Liverpool penalty due to a subjective decision.
Add those to his worrying on-pitch ref data, and no wonder Jürgen Klopp seems to have a massive problem with him.
Prior to the moment when Tierney’s assistant elbowed Andy Robertson at half-time against Arsenal, Tierney had done 21-and-a-half games as a Liverpool as ref and 18 as VAR, and given zero Big Decisions for the club in that time (the one sending off for an opponent was by the VAR, Michael Oliver, who got Tierney to overturn a yellow for a last-man foul at Stamford Bridge and make it a red).
All three of Tierney’s VAR interventions were to the benefit of Manchester clubs, and each was almost laughably soft (this is subjective, but hell, they were).
Prior to the scrutiny after elbow-gate, Tierney had given two Big Decisions against the Reds as a ref, and three against the Reds as the VAR. Zero for.
Again, this is not to accuse anyone of bias, cheating, corruption – it’s just to look at the very very very weird data. Remember, he’s also the ref that gives as many fouls against Mo ‘The Brutal Fouler’ Salah as for him, at the average of one for and one against per game.
I included Lee Mason, for trying to give a penalty against Fabinho for a perfectly good tackle in the box, which Andre Mariner looked at on the pitch-side screen with warranted contempt.
The all-Manchester duo of Tierney and Chris Kavanagh handled the debacle at Spurs in late 2021, when they ignored a clear red-card studs-up, out of control lunge by Harry Kane, a clear penalty on Diogo Jota, but did send of Andy Robertson for a petulant but non-dangerous kick. (Running the line was the guy who later elbowed Robertson, as you can see from the photo accompanying this piece; a guy who, for clear violent conduct, did not even get a proper ban, even if I wouldn’t want him to lose his career over it.)
If this was about betting patterns, you might want to investigate such data.
Mo Salah
More on how much Paul Tierney ‘hates’ Mo Salah, and a comparison with how Jack Grealish is treated by refs. This is fouls against minus fouls for.
Conclusion
The main conclusion is that Paul Tierney should not do Liverpool games ever again, and ideally, but less realistically, that northwest refs should not do northwest teams as either a referee or a VAR, given the data.
(Yes, it's not great on the environment, if refs have to travel further, but if it's affecting the results, it undermines the legitimacy of the competition, then why bother at all? We have neutral-location refs in international sport, yet we don't in domestic football. As noted, they seem happy enough to send Mancunian refs to London to be VARs when Liverpool are playing, even when Liverpool are playing Manchester clubs. Earning up to £200,000 a year, refs can take the train and stay over at a mid-range hotel. Plus, the average salary for a surgeon in the UK is £79,000, so refs can earn almost three times the average of a surgeon, should anyone think they are hard done by. It’s not an easier job, but it’s lucrative, especially if you can jet off to Saudi Arabia for a few thousand quid per game.)
Even though the Greater Manchester refs are all said to support clubs other than Man City and Man United, it seems that – as the most generous interpretation of the data – living in the area puts them under enormous pressure; presumably they meet City and United fans walking the dog, at the pub, at the café, at the shops, not to mention their extended family members and in-laws, and likely get told what they should be doing more or less of. Maybe they bump into the players, too?
So again, I don't think it's a conspiracy, but it's odd how often the same refs keep doing Liverpool games, especially Tierney, whose record looks fishy at best, perhaps as he and Klopp loathe each other to the point where the former – based on his record, not the enmity – should never do the Reds again. Tierney being given to Liverpool a record amount of times last season seemed like the PGMOL stoking a fire.
This fear of bias is presumably why the non-Liverpool supporting refs who live on Merseyside (including one from Australia) tend not to do Liverpool games.
If that's a standard, why is it not applied everywhere?
Is it okay – and not biased on my part – to ask why the different standards? Surely holding all to the same standards is essential to integrity in sport?
Has anyone at the PGMOL even considered these issues and crunched this kind of data, or do they just do the old “it's just one of those things” whenever anyone complains (they even themselves out, don't you know?) without looking deeper? Data can show patterns of concern.
It would be nice to think refs can be unbiased and unaffected. But it would be incredibly naive, too. The data shows that. Whether or not it's conscious, northwest refs seem massively generous to Manchester clubs and harsh on Liverpool.
As such, maybe there should be a 50-mile radius where referees are excluded from officiating, in addition to considering their allegiances.
Thankfully, at least a lot of the older refs (born in an era of the biggest “Kop-wins-penalties” myths) have retired.
In 87 games during the Klopp era, Graham Scott, Jonathan Moss, Lee Mason, Mark Clattenburg, Martin Atkinson, Mike Dean, Neil Swarbrick and Roger East gave a balance of -11 Big Decisions 'for' Liverpool (so, 11 more went against them than for them), when the natural, logical expected outcome would be about +8 based on the averages for the Best Four clubs outlined earlier in the piece.
(Some of those went on to be key regarding VAR, but then quit or got booted out of there, too.)
They also gave the Reds penalties at a rate worse than the average for the team that finishes bottom of the table, and 87 games is a reasonable sample size of over two complete seasons’ worth of games.
Ultimately, I just want to see Liverpool refereed fairly. Not generously, just fairly. (And yes, I get that Klopp can be annoying, but it’s not a referee’s job to favour nice managers. It’s to make decisions that are fair, and that includes an awareness of favouritism towards English players and England internationals in particular.)
The data suggests the opposite is true regarding fairness; certainly in the Klopp era, because before then, the Reds had periods of lots of penalties – but usually when it was a British boss fielding more British players (2013/14 was mental, with a title charge on the back of 12 Premier League spot-kicks, seven won by Brits, and two more for handballs).
Any generosity, from almost a decade ago, to good-old Brendan Rodgers is of no use to anyone at Liverpool now, and sport should be fair in the moment and the season at hand, not with officials applying some kind of redressing of past – real or imagined – injustices.
Whether or not they like a manager should play not part, either.
The data. Just look at the data.
Keep reading with a 7-day free trial
Subscribe to The Tomkins Times - Main Hub to keep reading this post and get 7 days of free access to the full post archives.


