
The Most Comprehensive Analysis of Premier League Officiating Ever? 10,000 games, & Lots of Very Suspicious Data!
See for yourself, the weird patterns in officiating across almost one million minutes of football


So, 9,660 games, and close to a quarter of a million fouls (222,577), between July 2000 and mid-December 2025. With it, 340,039 Shots+Corners to calculate match domination. And add all VAR overturns. Let’s see what the numbers say...
Warning: words and numbers ahead!
The Full Monty!
After the latest clusterfuck of officiating last night I thought I’d just write up, in one fresh go, my months of work that now covers 25 years of Premier League football and officiating.
Facts first, data and charts later (to see where the facts come from and show far more information).
Share if you find it interesting.
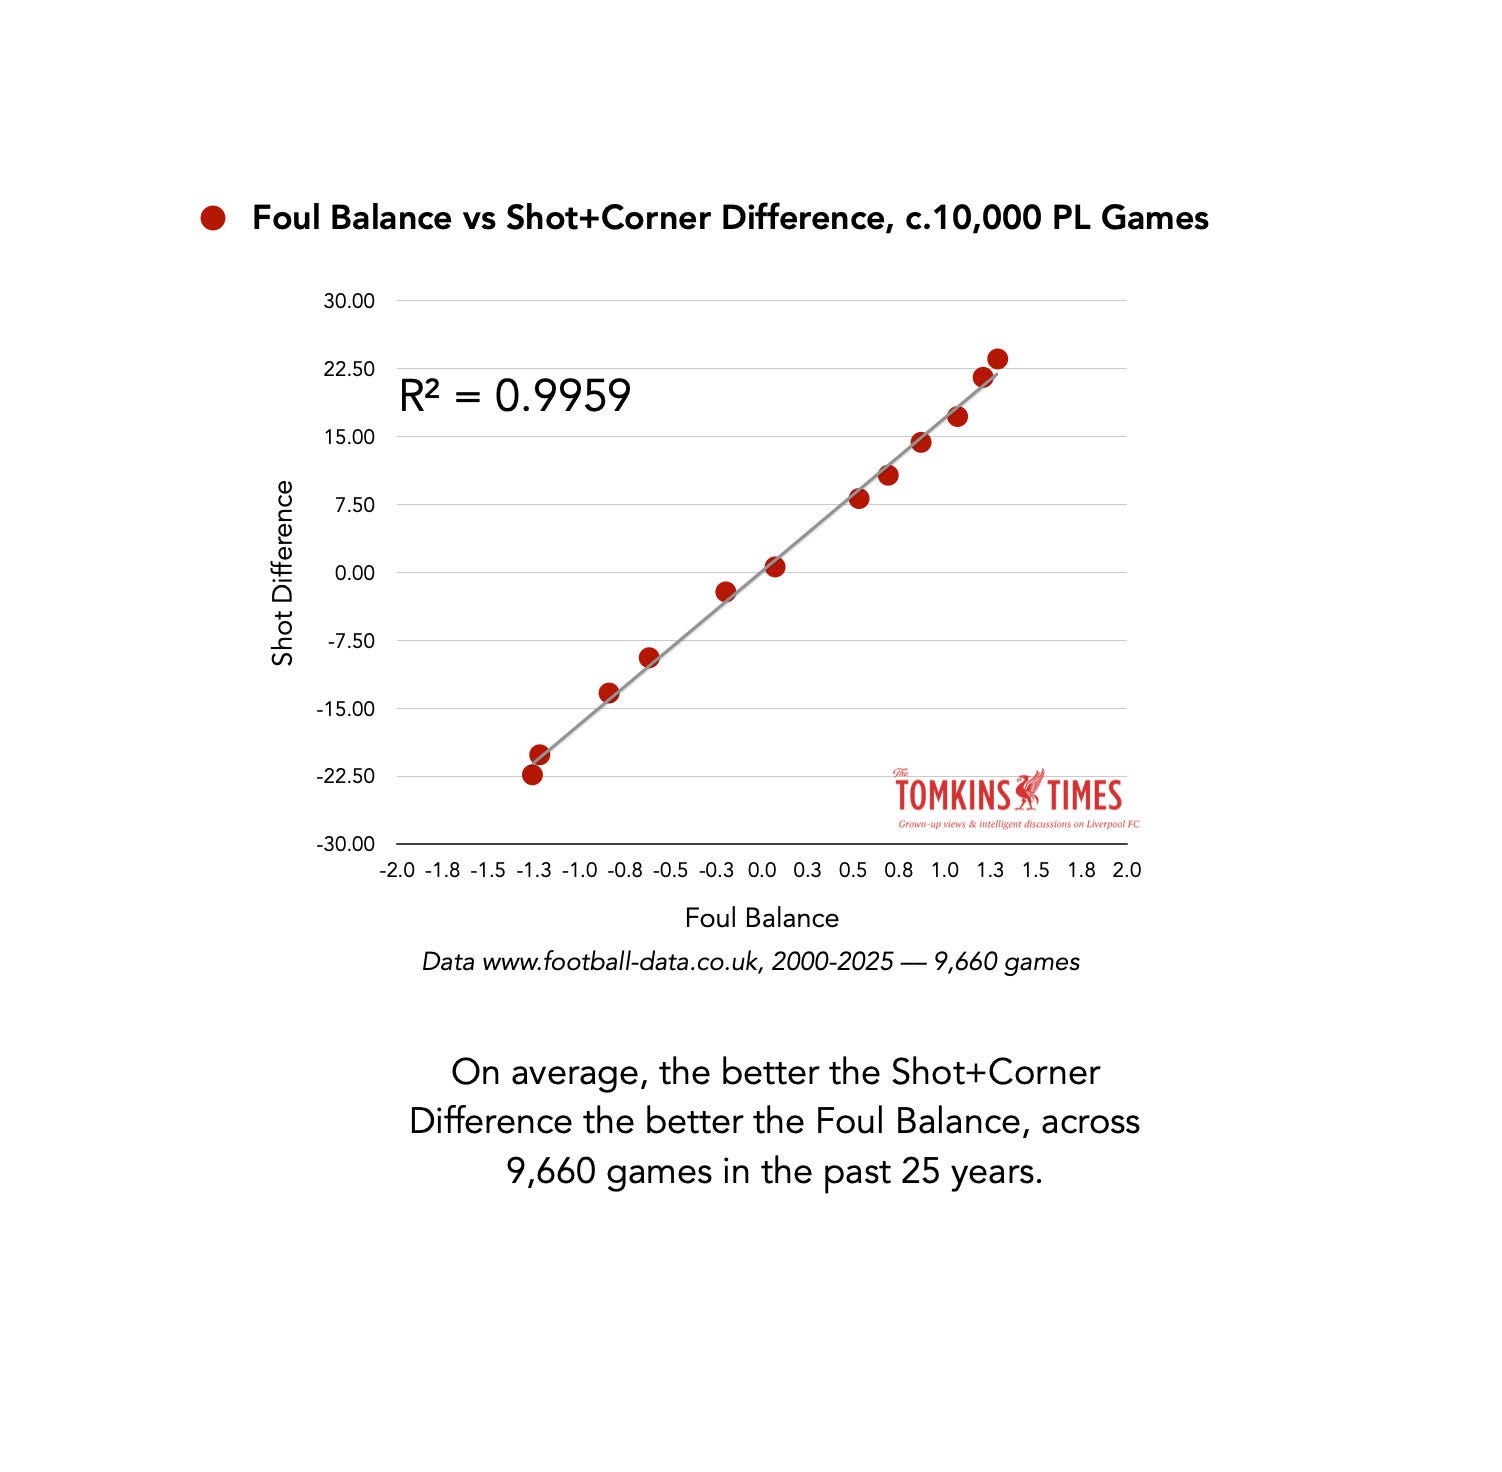
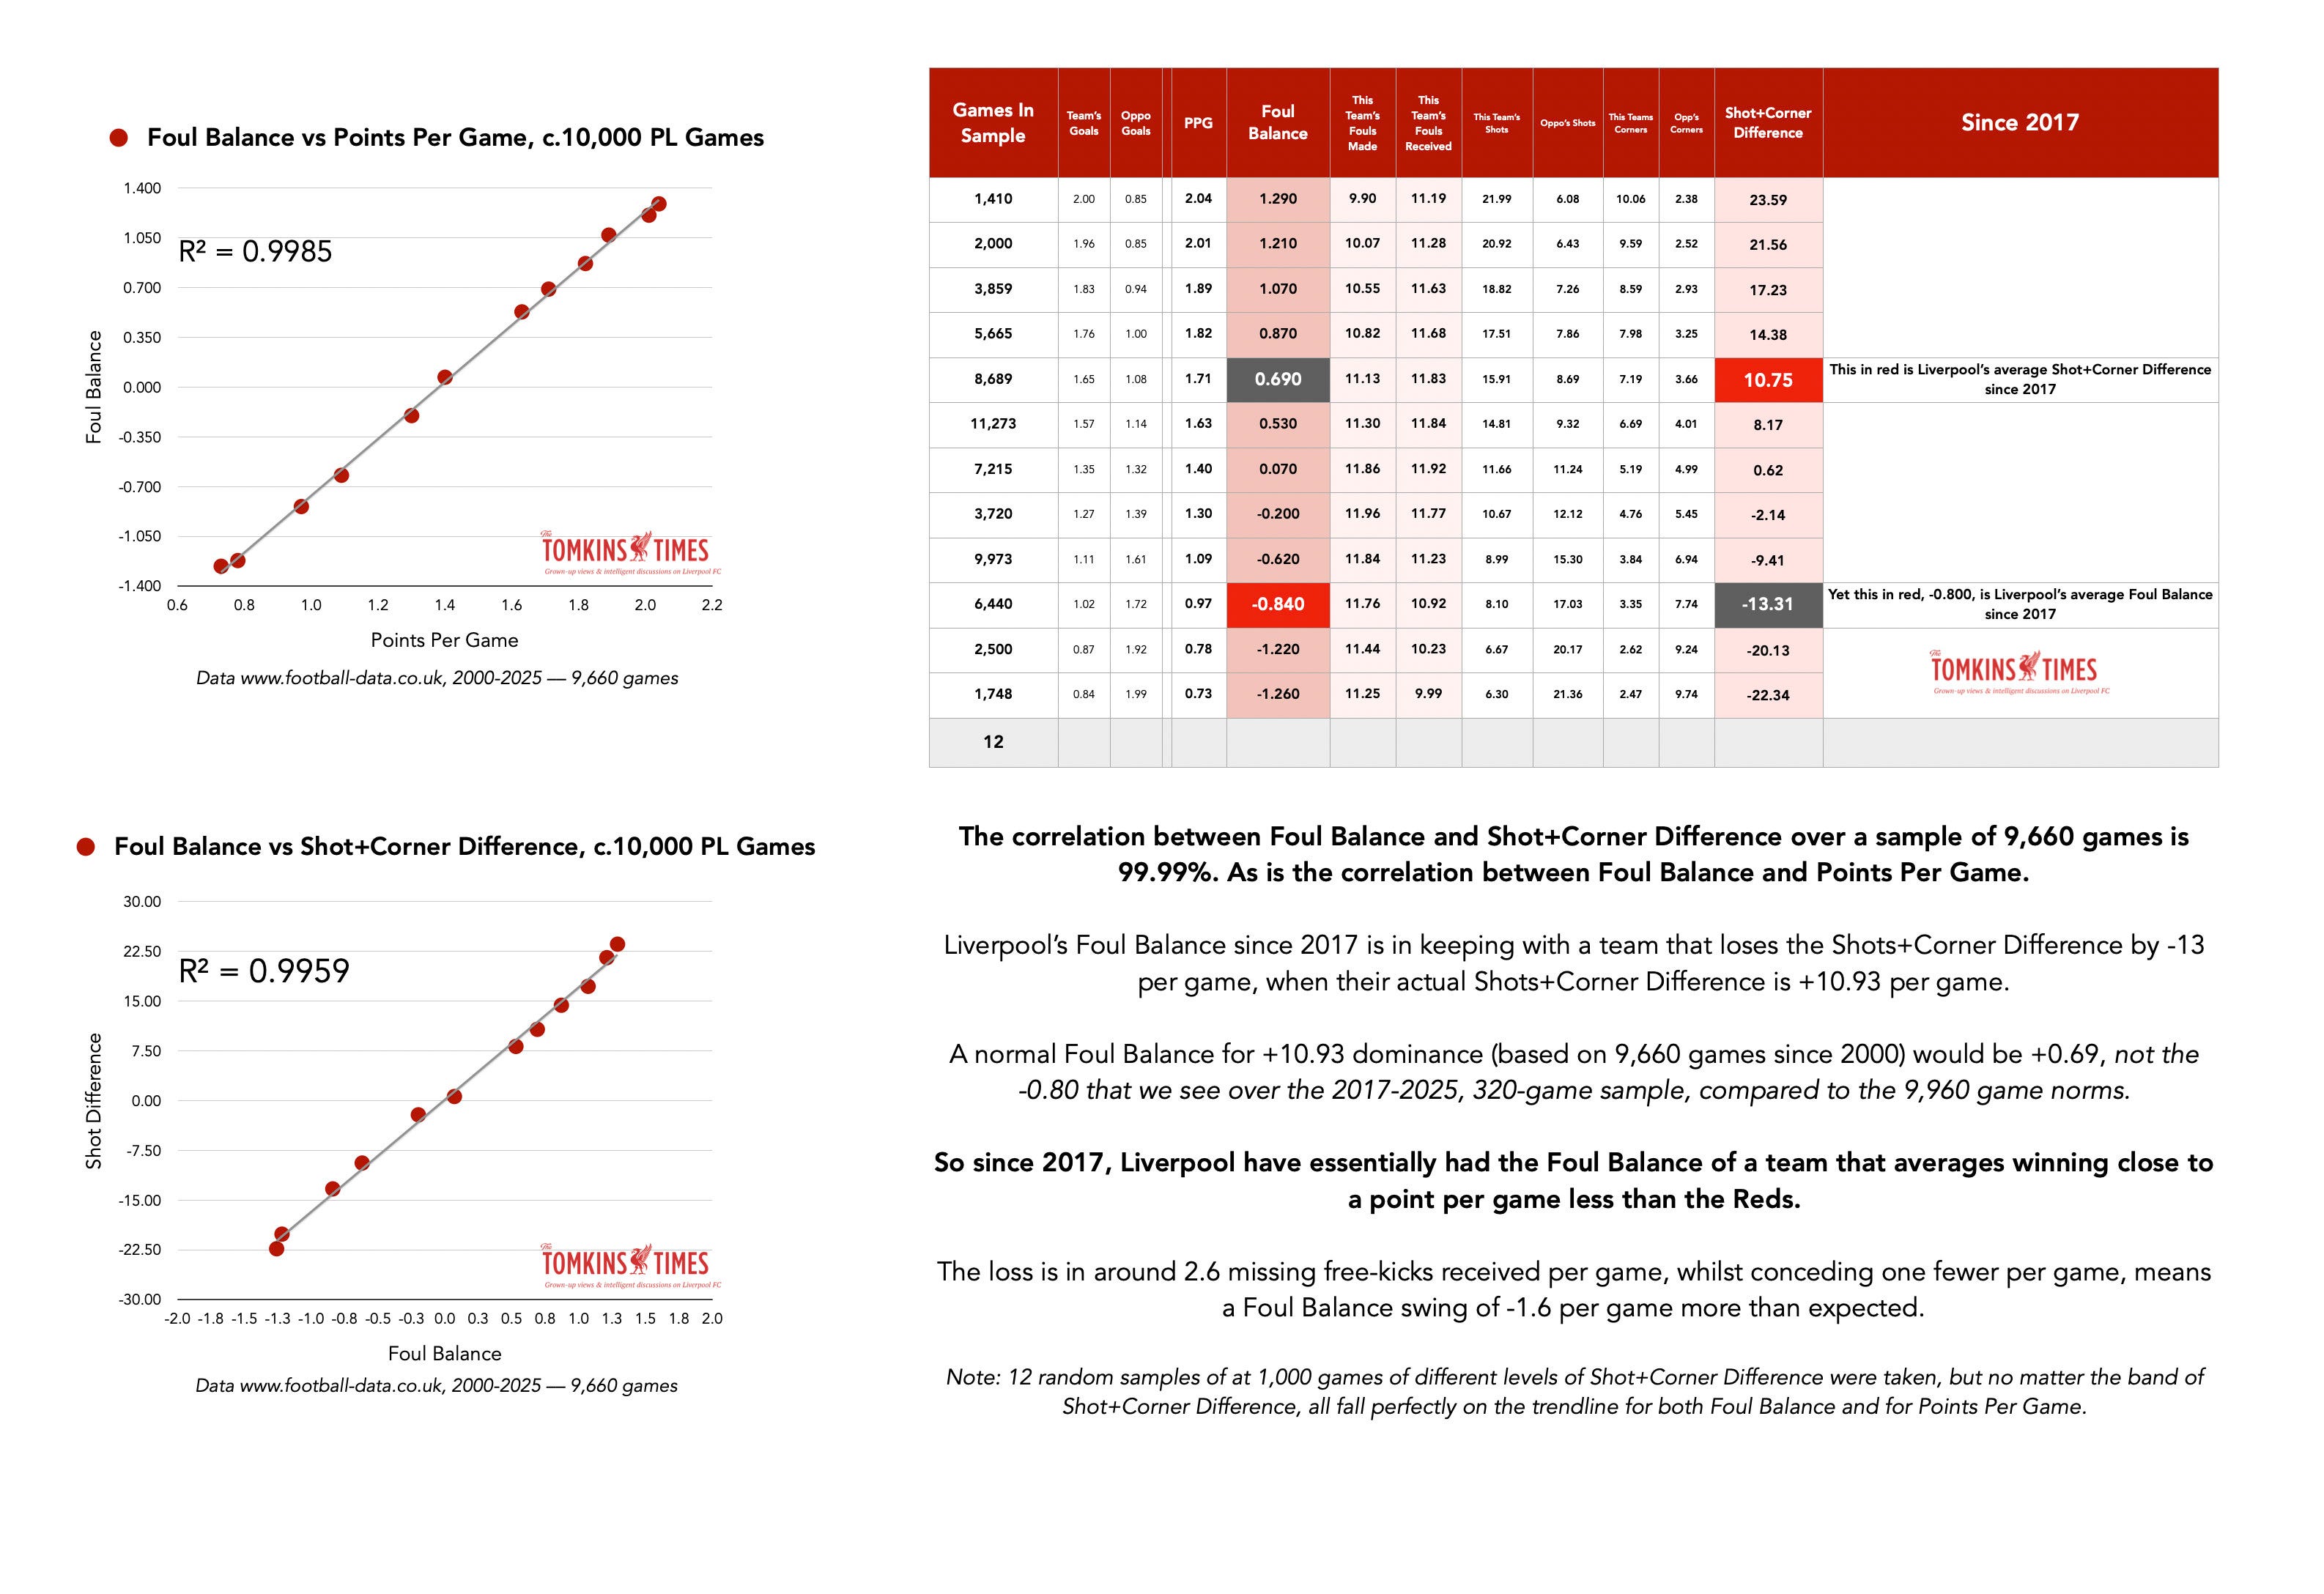
The average difference between having a Foul Balance advantage in a match of +3 or more is worth +0.34 points per game compared to if losing the Foul Balance by -3 or more, from a sample of 9,960 games in the Premier League in the 21st century.
In a game of marginal gains, this is huge, yet goes under the radar. (No wonder Arne Slot is pulling his eyebrow hairs out, as he has none left on his head.)
Coincidences occur; but how often? When is a pattern meaningful?
Of those 9,960 games, 487 were virtually identical on game balance (each team’s Shots+Corners averaging out the same as the opposition’s Shots+Corners), and so were a good way to compare – the only clear difference was the Foul Balance, and the corresponding points per game, hence the 0.34ppg difference – albeit this can get higher with more extreme Foul Balance discrepancies.
For Liverpool, it can often be more costly than -0.34 points per game lost, especially at Anfield.
If you plot it on a chart and take a dozen random large samples of game-domination and Foul Balances, the correlation is 99.9% between better a team’s stronger match data and higher Foul Balance; yet obviously individually this does not apply (hence Liverpool).
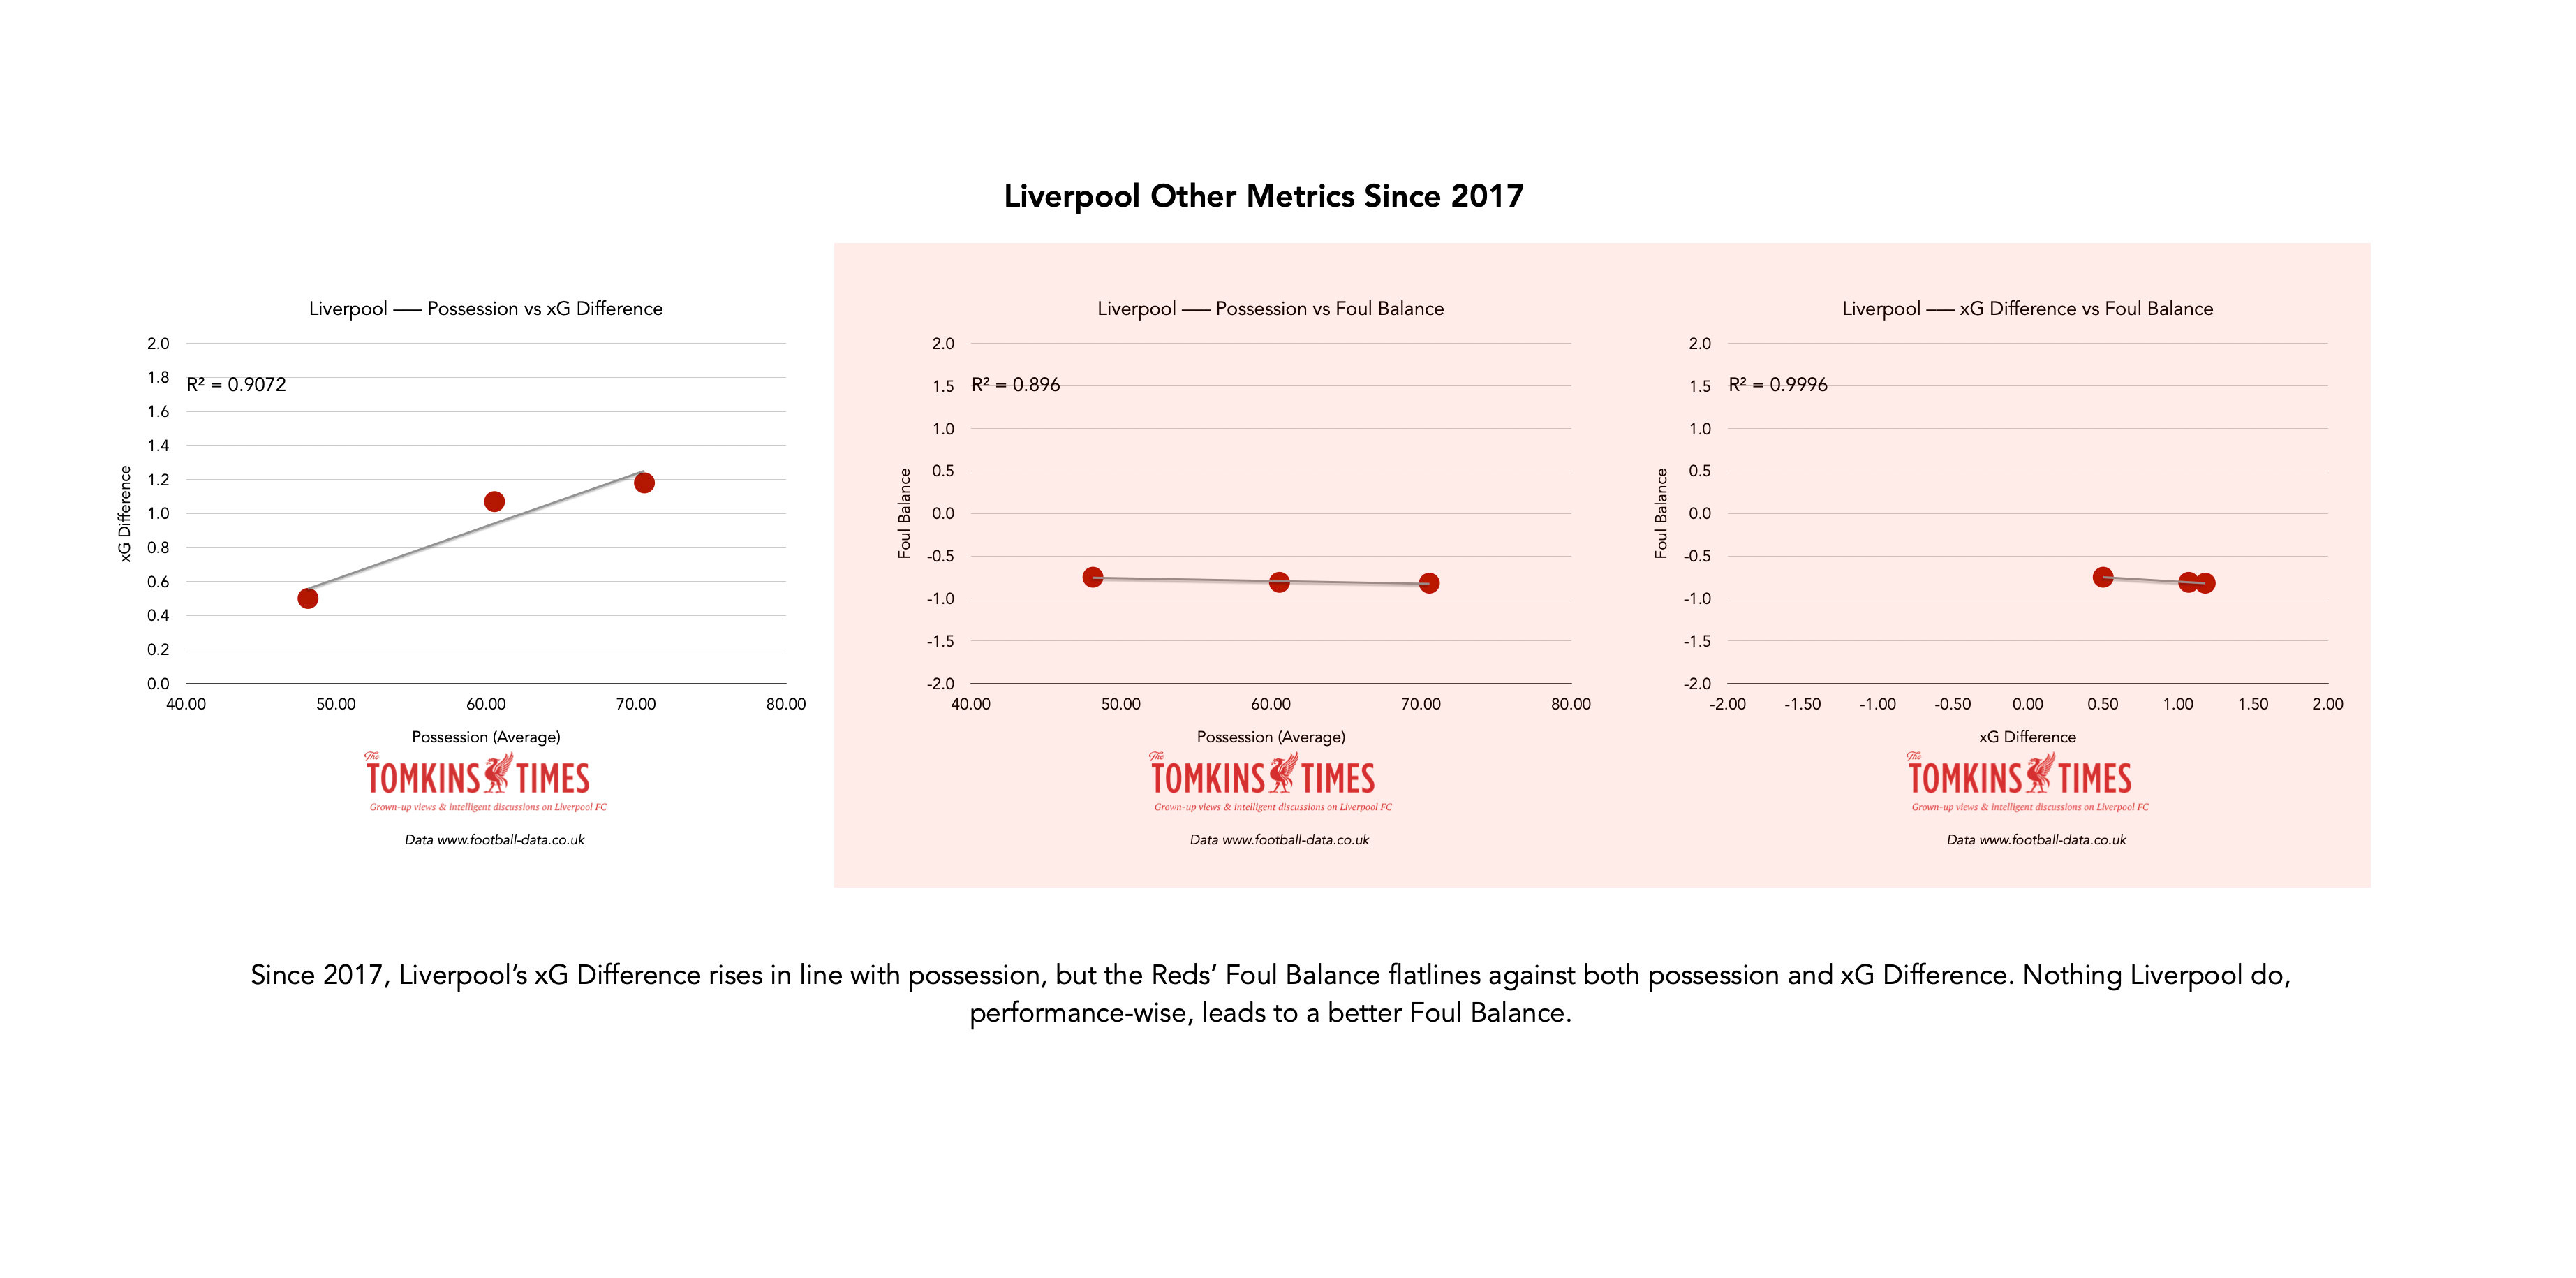
On average, nothing Liverpool do in terms of dominance or xG advantage since 2017 (data via FBRef) changes the Foul Balance, which, again on average, remains flatlined regardless of how well the Reds play.
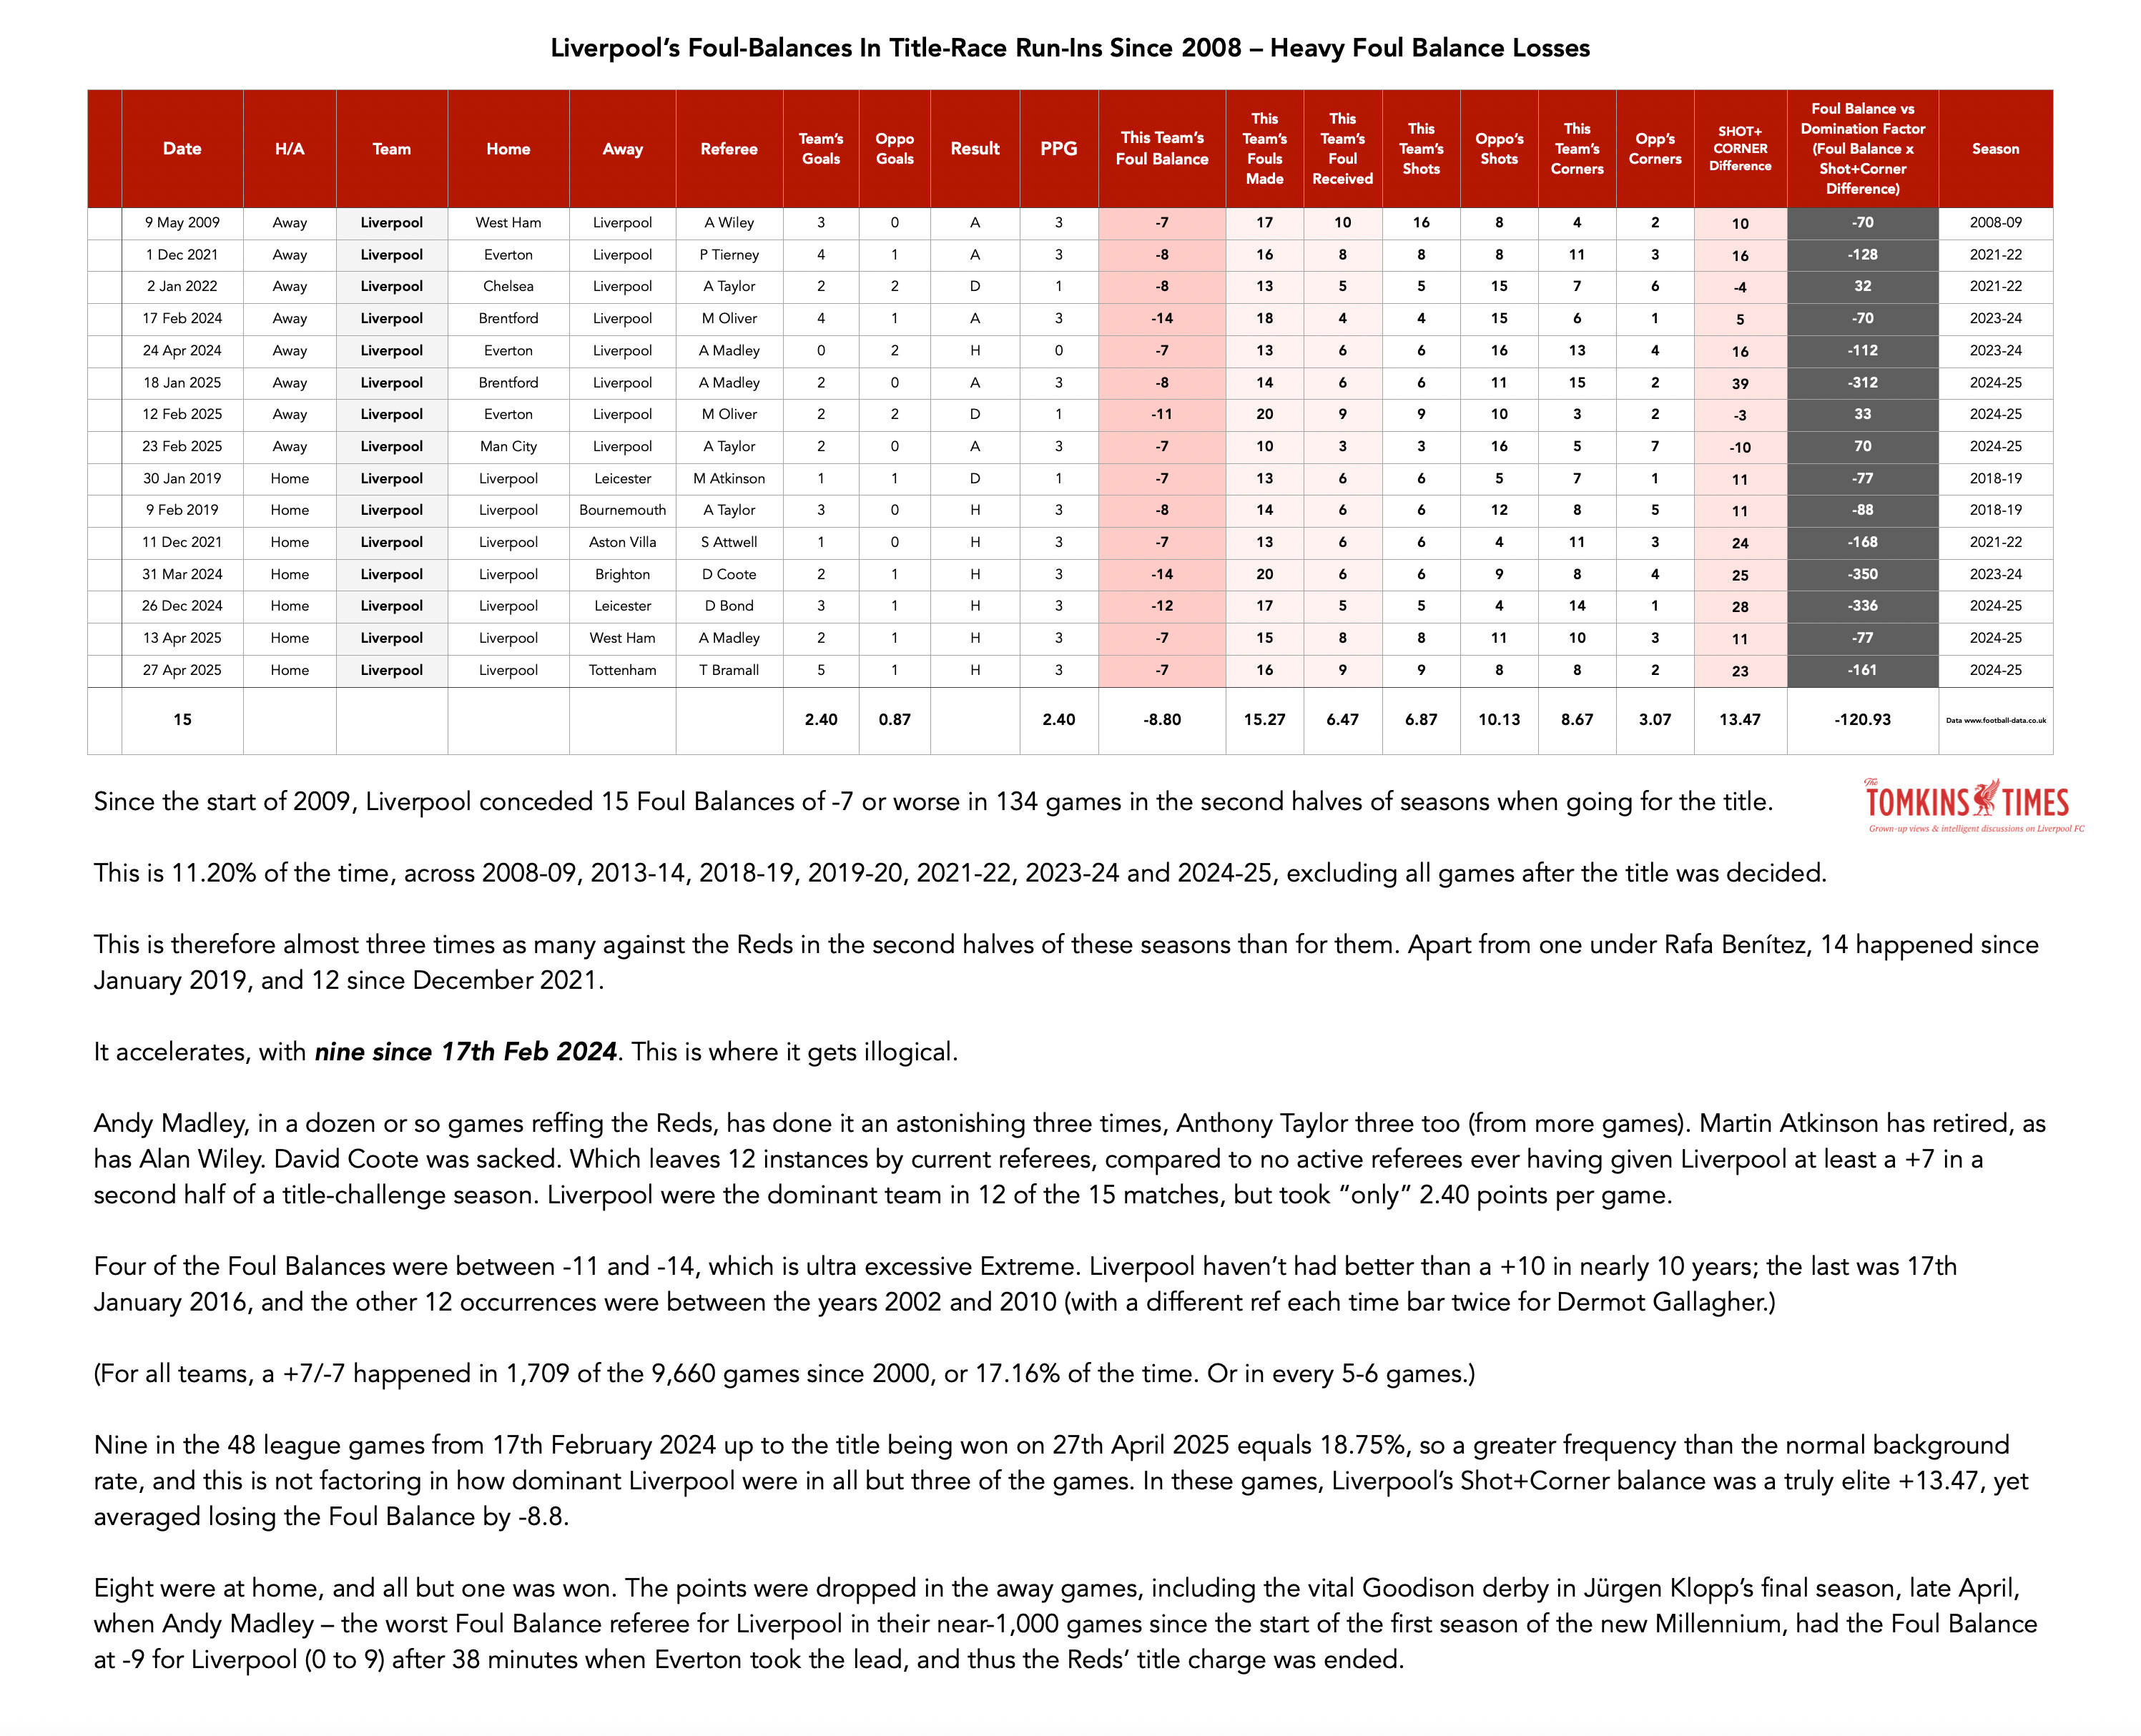
Even though their underlying data tends to get better (more dominant), Liverpool’s Foul Balance gets much worse in the second halves of seasons when going for the title, while their rivals’ tends to get better.
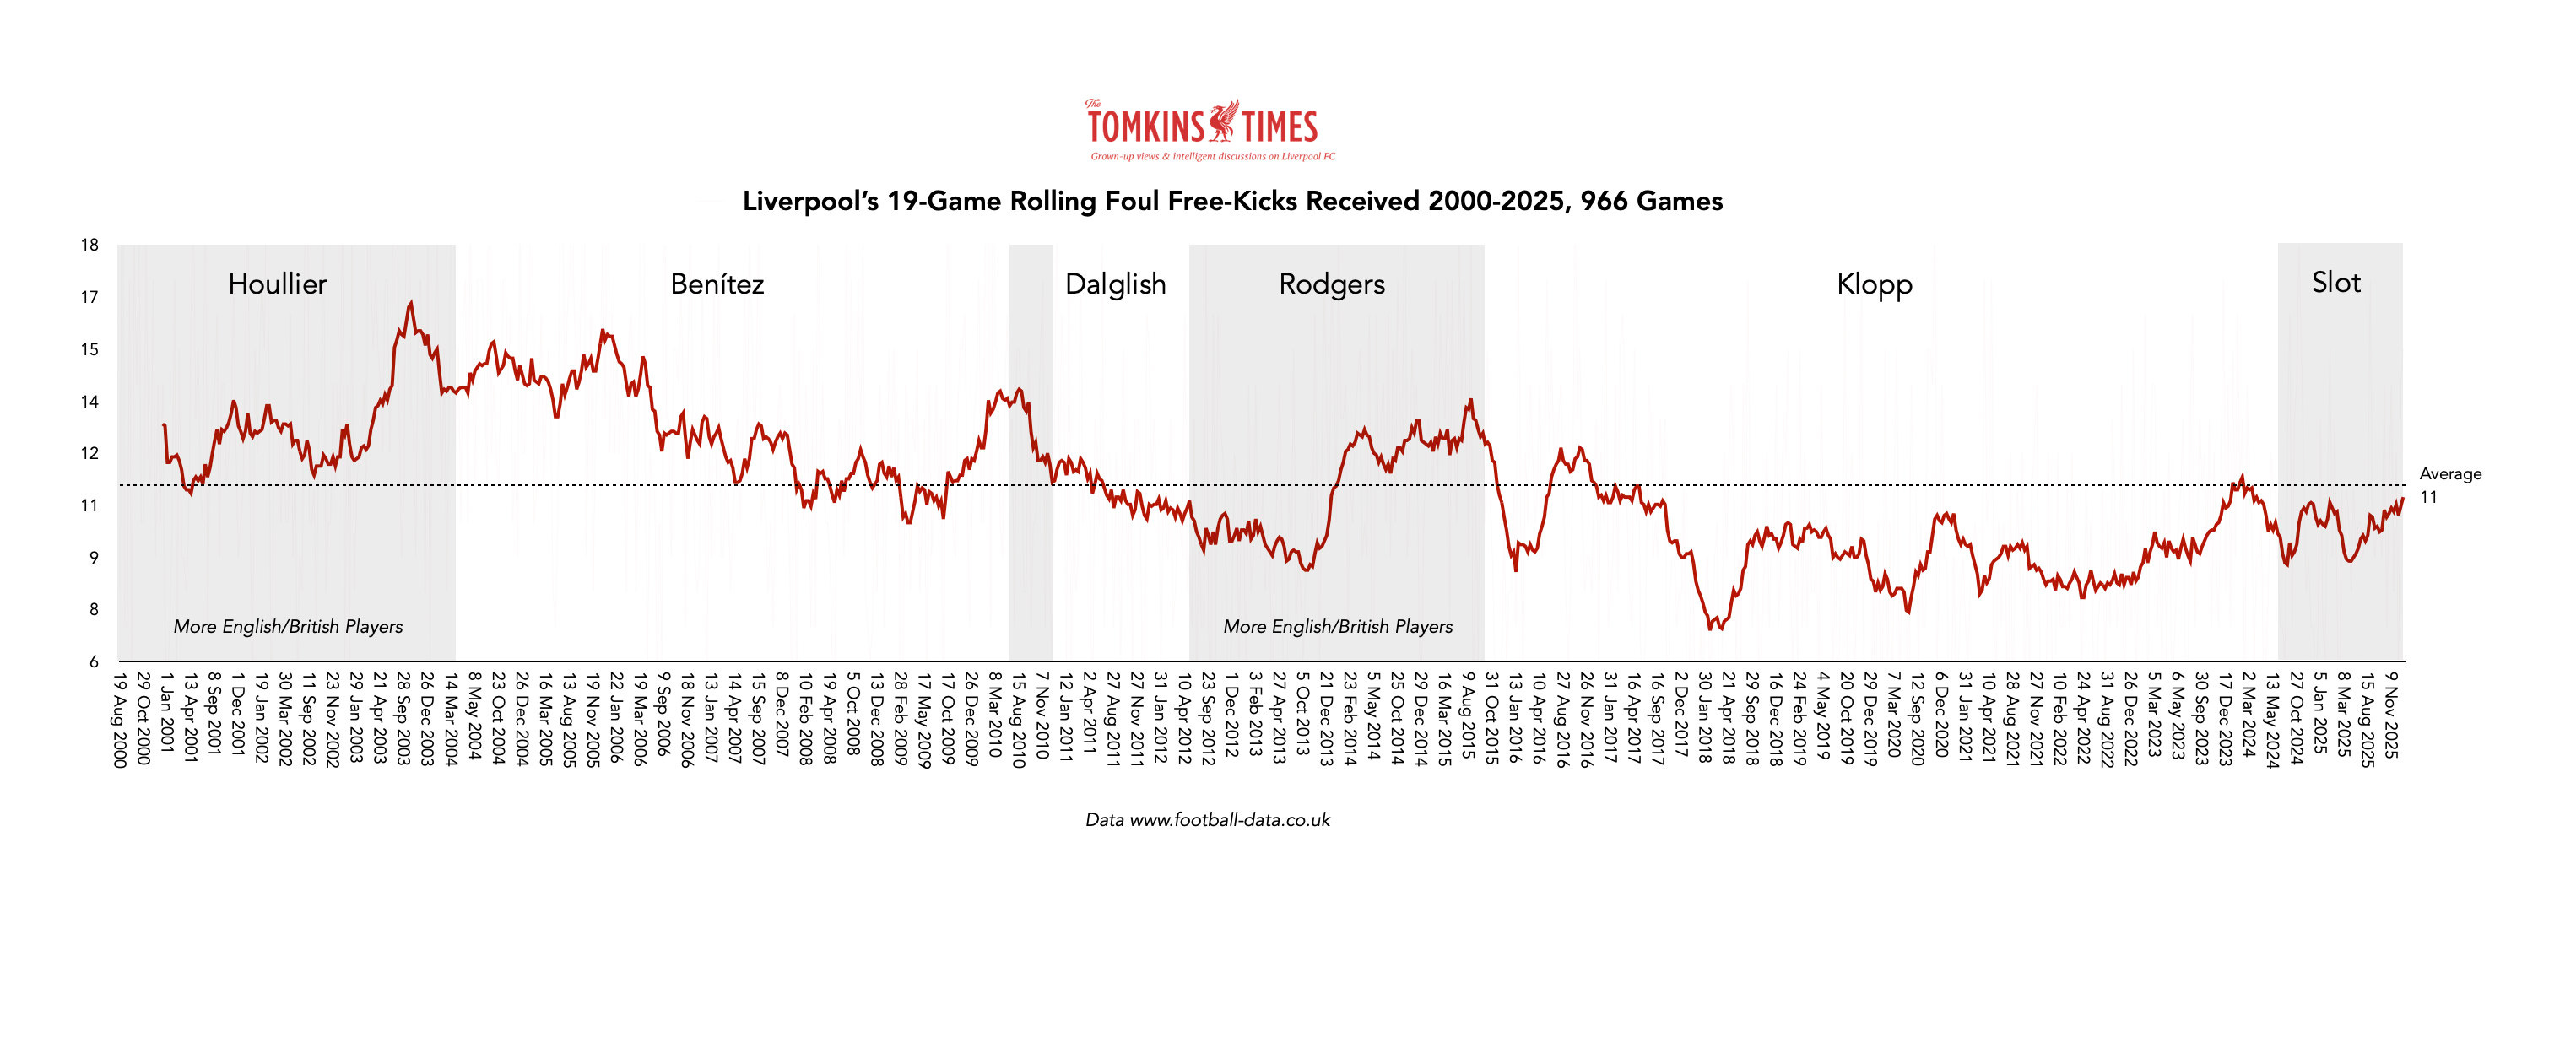
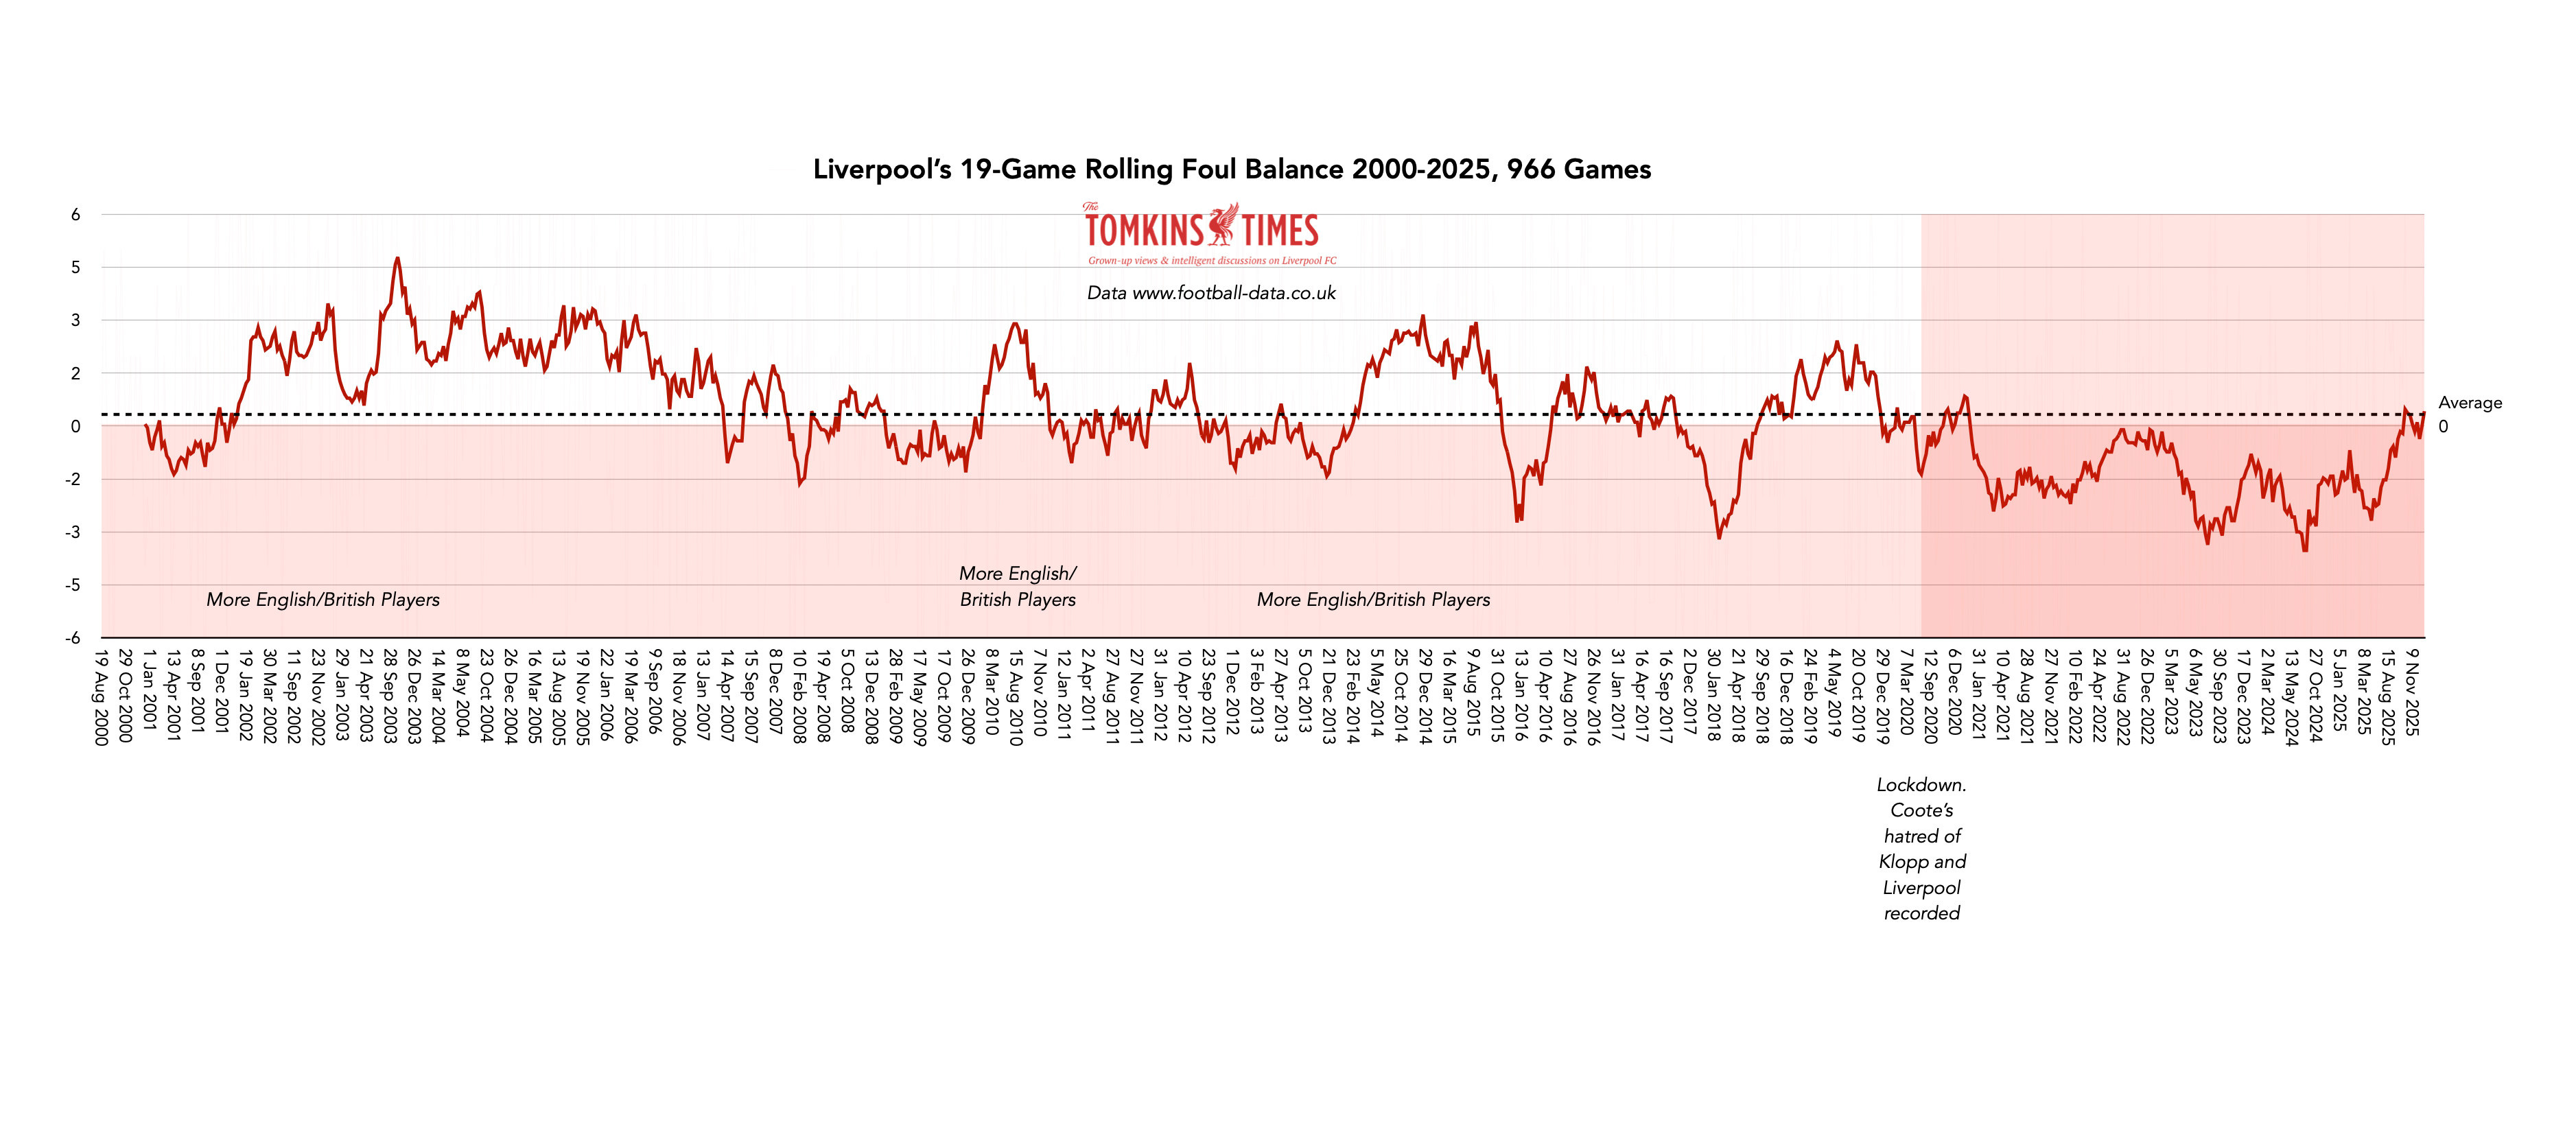
The main outlier was when Liverpool had a British manager and lots of British players (2013-14); while Liverpool’s Foul Balance was best in the 21st century under Gérard Houllier with his team – starting to fade from 2002 to 2004 – of Michael Owen, Emile Heskey, Steven Gerrard, Danny Murphy, Jamie Carragher, et al (spot the trend).
The Reds’ Foul Balance peaked in 2003. (When fairly rubbish based on memory and the performance data, but with the XI full of English players.)
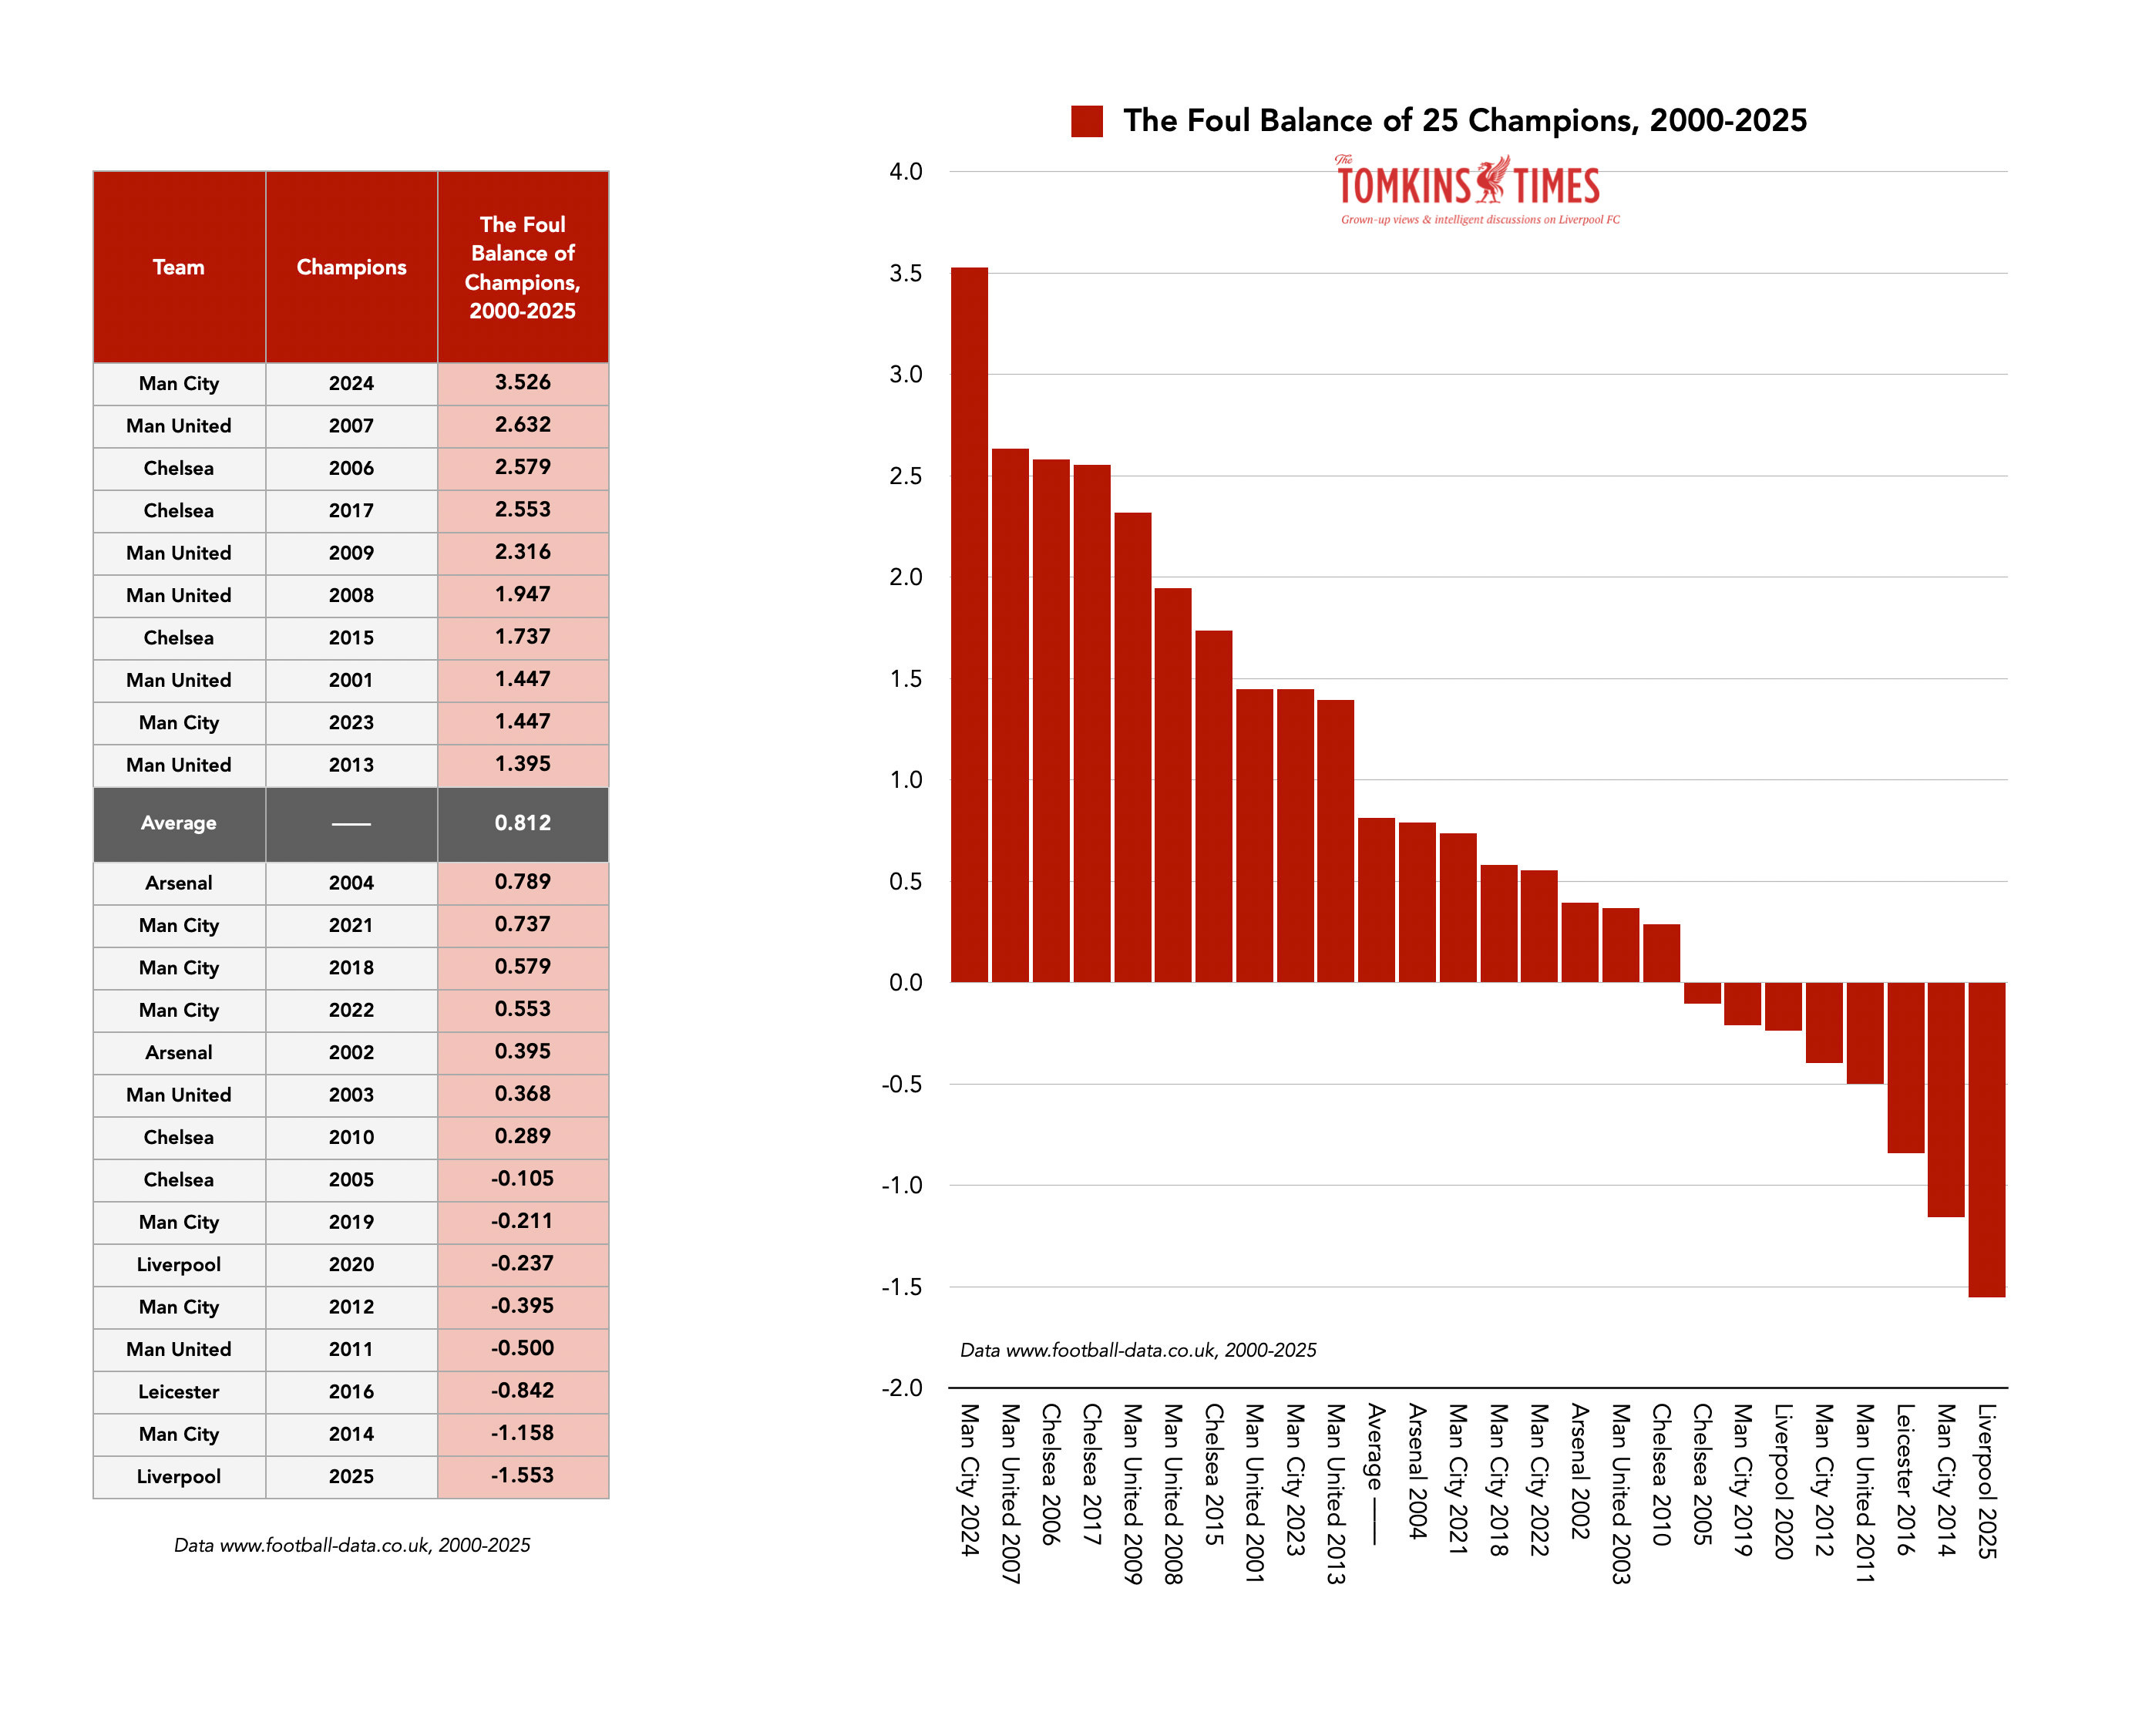
Over two thirds of all English league titles since 2000 were won with a positive Foul Balance; Liverpool’s in 2024/25 was -2.5 below the average, and the worst Foul Balance of any champion in the current millennium (-1.553 per game), following on from Man City winning the league with the best, a Foul Balance of +3.526 per game.
Only eight of the past 25 champions (32%) had a negative Foul Balance. This includes Liverpool in 2019/20, too.
Slot’s Reds had a Foul Balance last season that was around -0.5 per game worse than any other title winner. This was often like being given a ‘sporting’ handicap in each match, such as being forced to play with 10 men or the opposition being allowed 12.
This season, the Foul Balance is still not great, but now the Reds are down to one penalty won in 20 games (despite half a dozen stonewallers, including last night), three against. And let’s not get started on disallowing or allowing “subjective offsides”.
Liverpool were the only champions in the past 25 years who never once had an above-average (rolling 10-game) Foul Balance at any point of the season. As Liverpool started to pull ahead, the negative Foul Balances racked up massively until the title was won early. This shows the remarkable job Arne Slot did, taking what was deemed an impossible job in following Jürgen Klopp with a team in need of a rebuild sometime soon.
I can’t give you map locations for all fouls in the c.10,000 games, as I can’t access that level of detail, but this below was published by The Athletic in early May 2025, and you can see that there was no danger of Liverpool getting a free-kick within a full six-yard box outside the box, nor on the right wing, where Mo Salah put in one of the most dominant displays ever seen in English football; there’s a barren foul landscape, with his heat map of Salah’s touches overlaid by me.
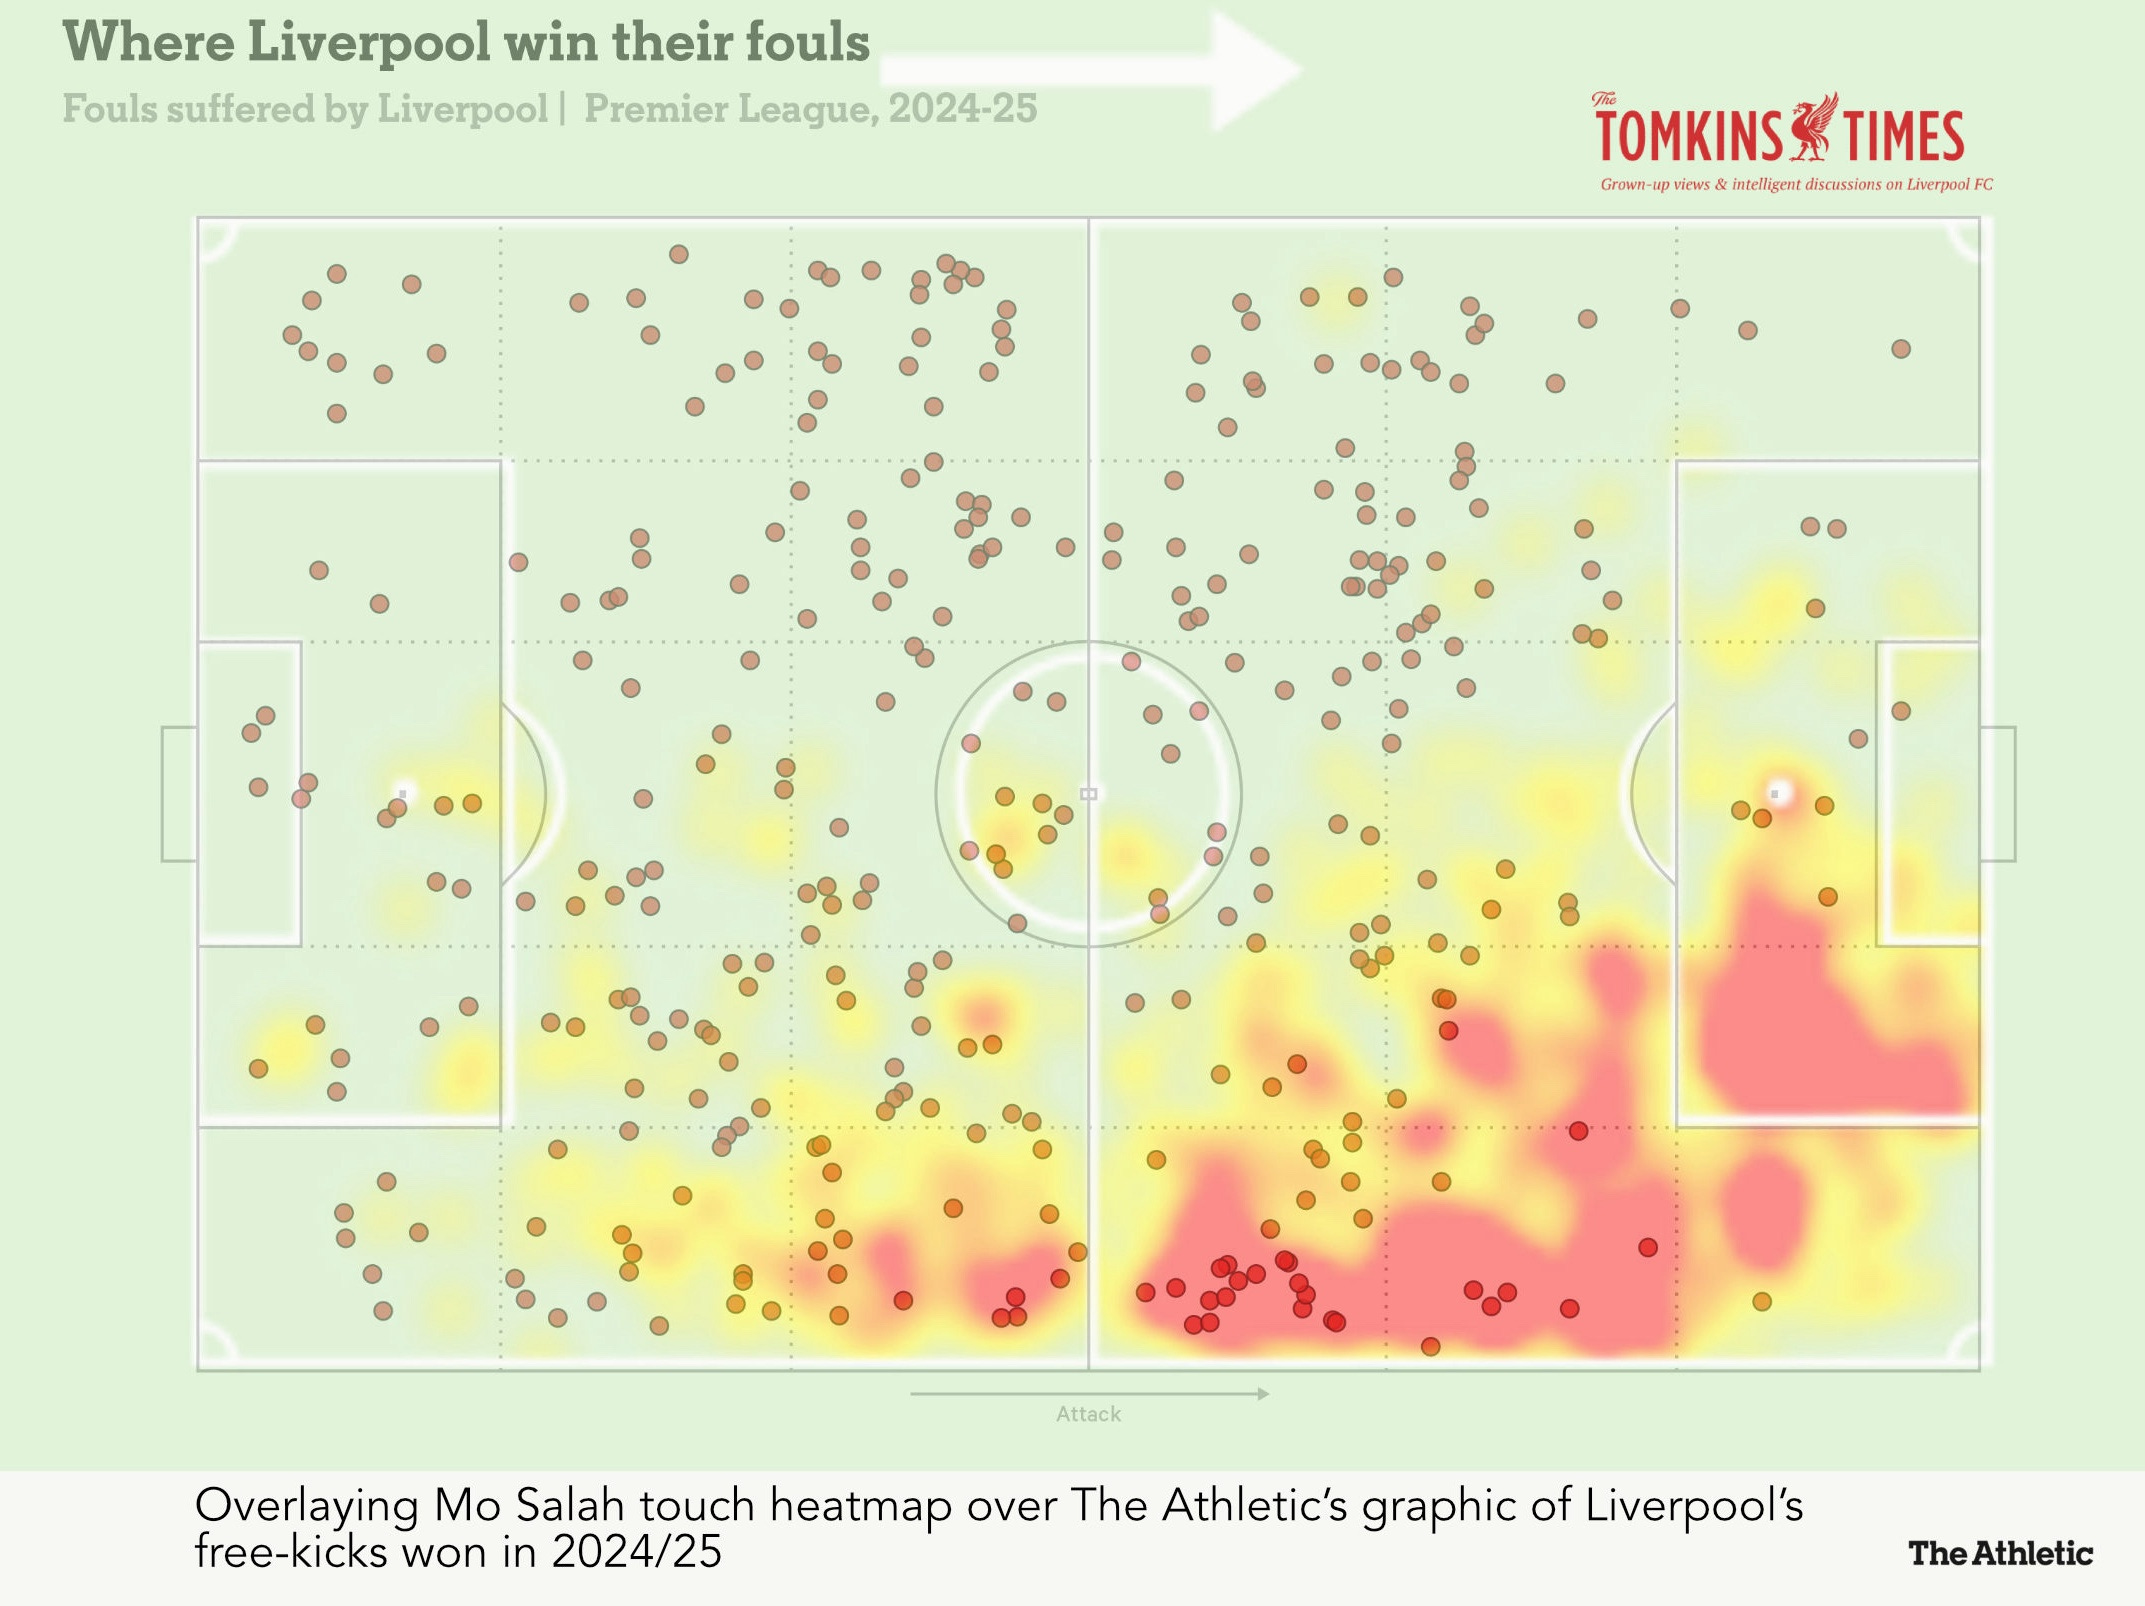
Since he arrived in England, Mo Salah ranks about 2,000th out of Premier League players for fouls won, at less than one per game (0.83). No Liverpool player ranks anywhere near the top in Salah’s time in England, but Luis Díaz’s first season was promising before he stopped being given fouls. Salah has faded this season, but his treatment by the PGMOL has been scandalous.
It almost never happens that a foul gets moved inside the box by a VAR; yet it’s happened twice against Liverpool. You have to want to check for it, right? And also, you never want to give players like Trent Alexander-Arnold (as was) many shooting opportunities. So just don’t give them free-kicks in those kinds of areas (you need Dominik Szoboszlai to lash one in from 35 yards).
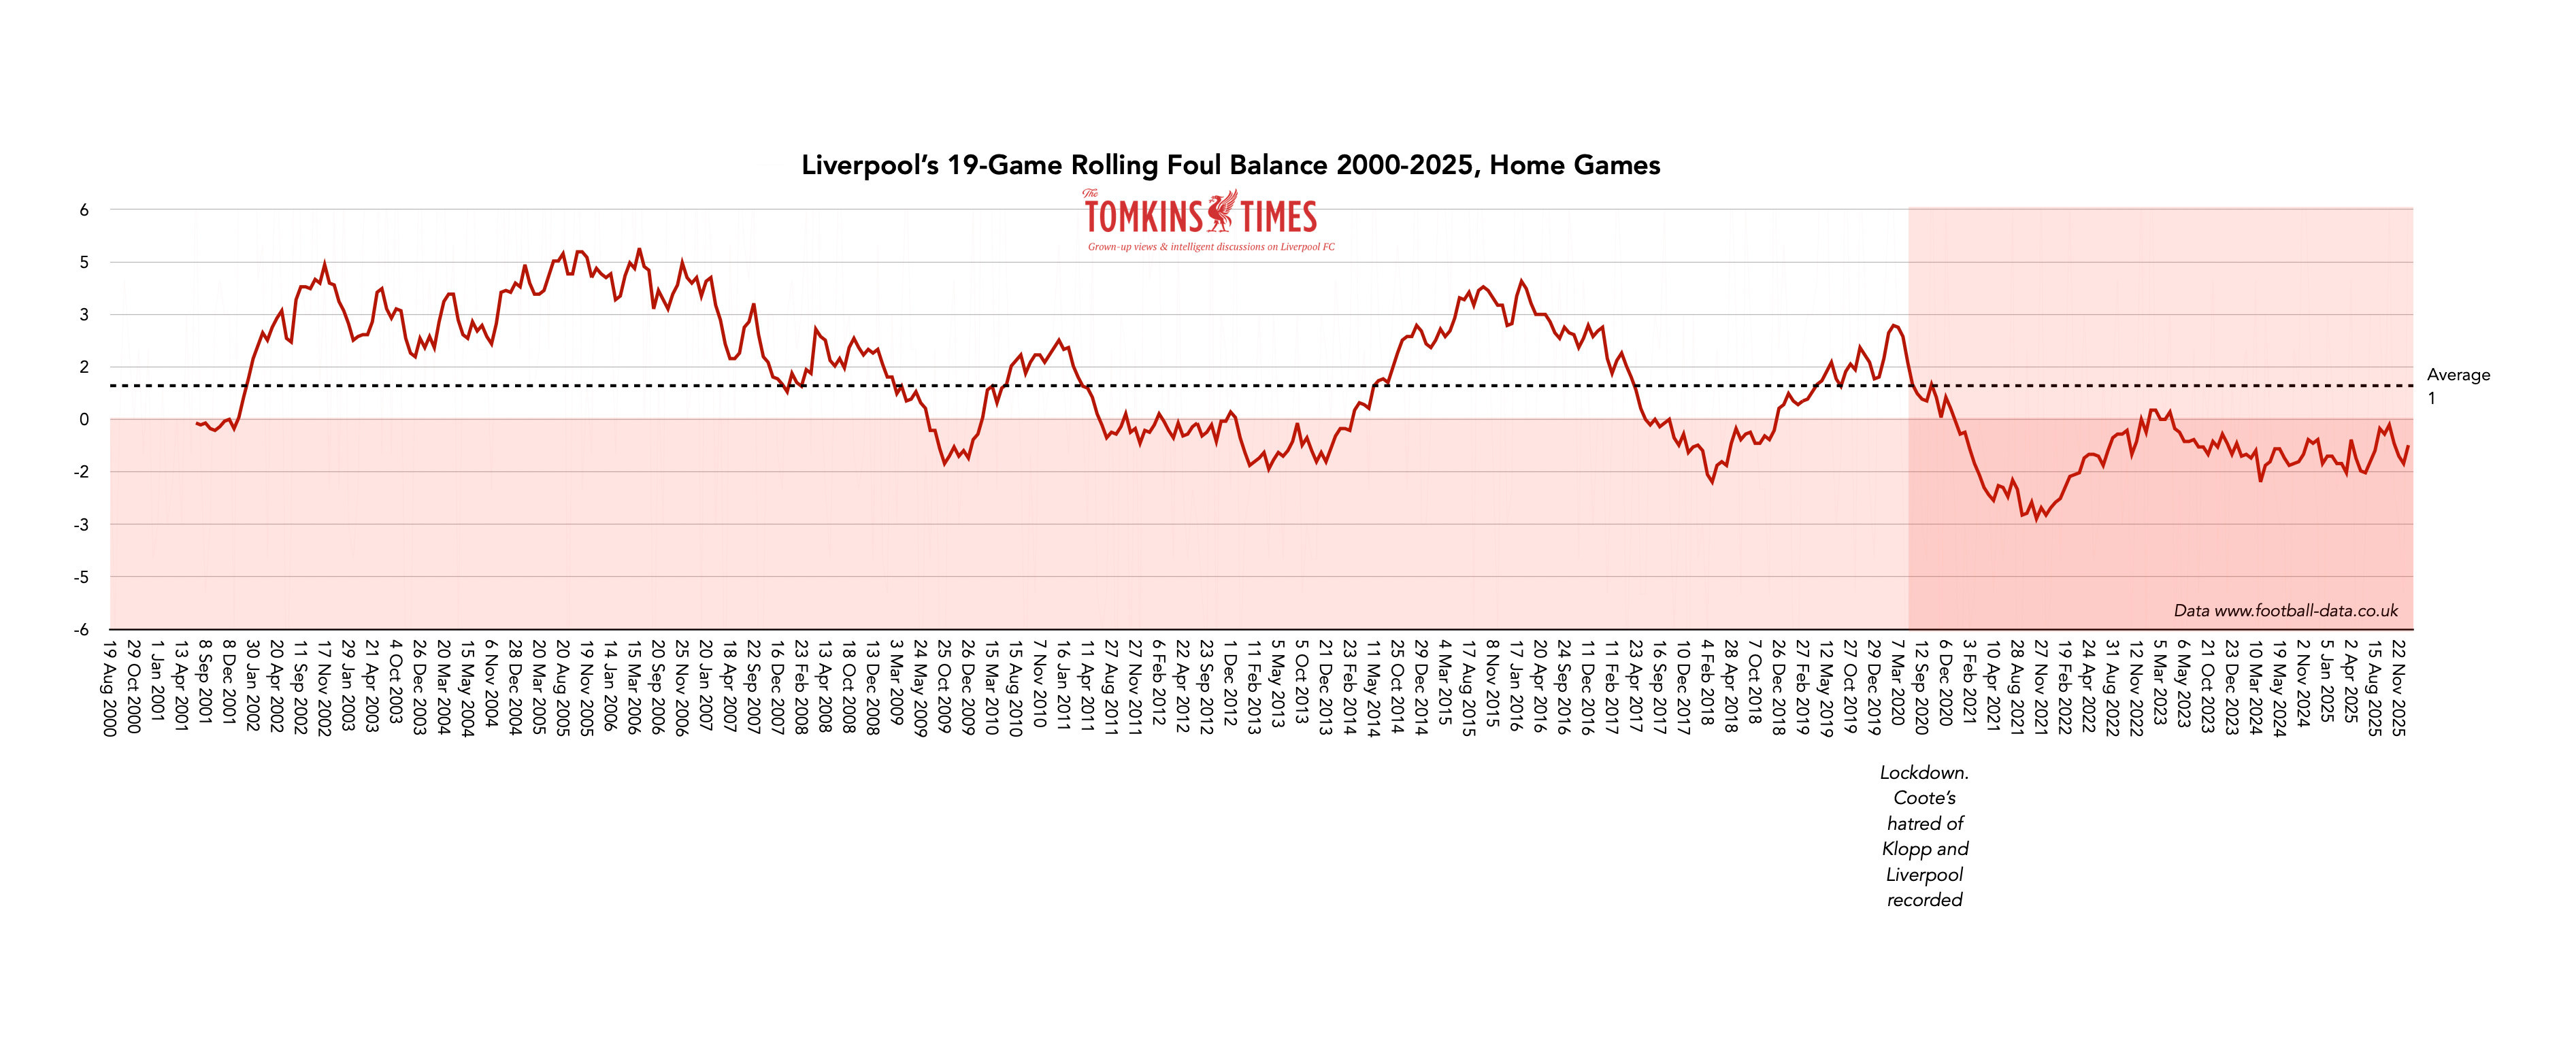
Liverpool stopped winning free-kicks at a normal rate in early 2017, and it has never recovered. I can show timelines of all fouls received and all Foul Balances going back to the year 2000 (let’s all meet up; won’t it be strange when we’re all fully grown?), and you can see where they do or do not match with game domination and team superiority. (See end of piece for all graphs/tables.)
Only Sheffield United (8), arguably the worst team on average in the past nine years, average winning fewer Premier League free-kicks since 2017 than Liverpool (9), with everyone else 10-14. Man City average winning 10 fouls a game, but are penalised less by conceding fewer free-kicks.
The best teams often want play-on, where possible, but also want free-kicks in dangerous positions. So Liverpool getting given some play-ons (as all good teams do) does not account for the lack of fouls received, clearly.
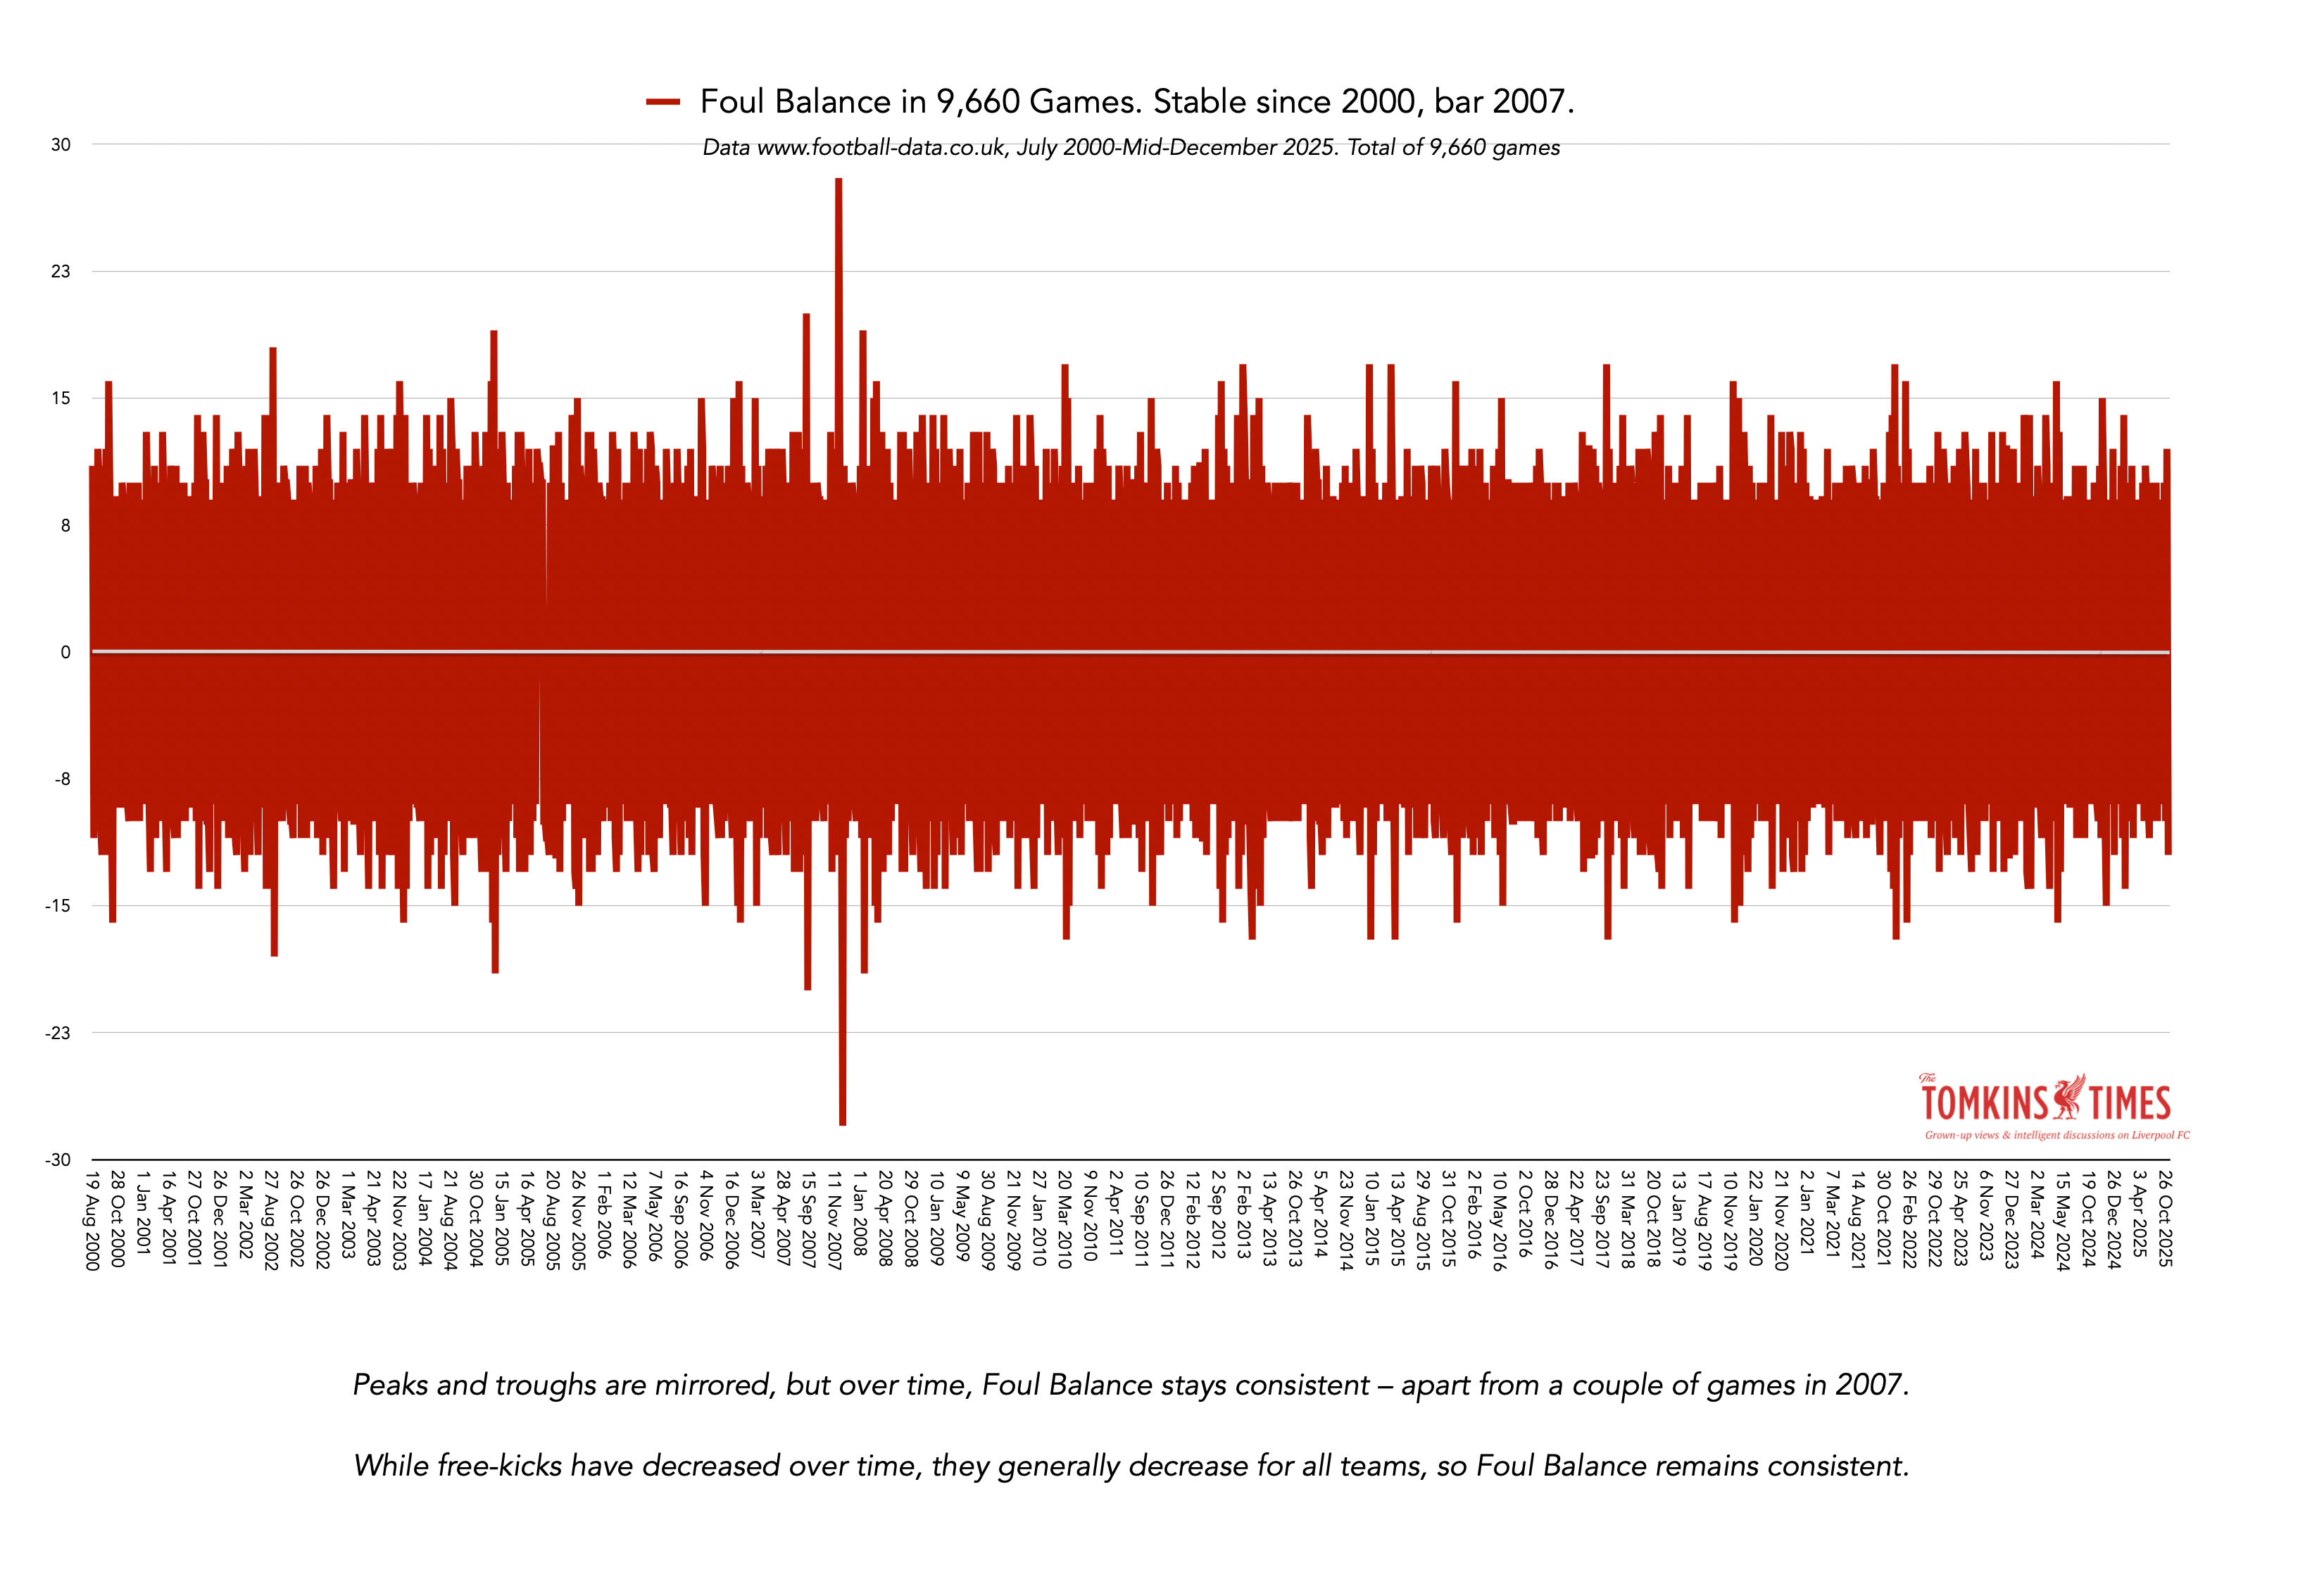
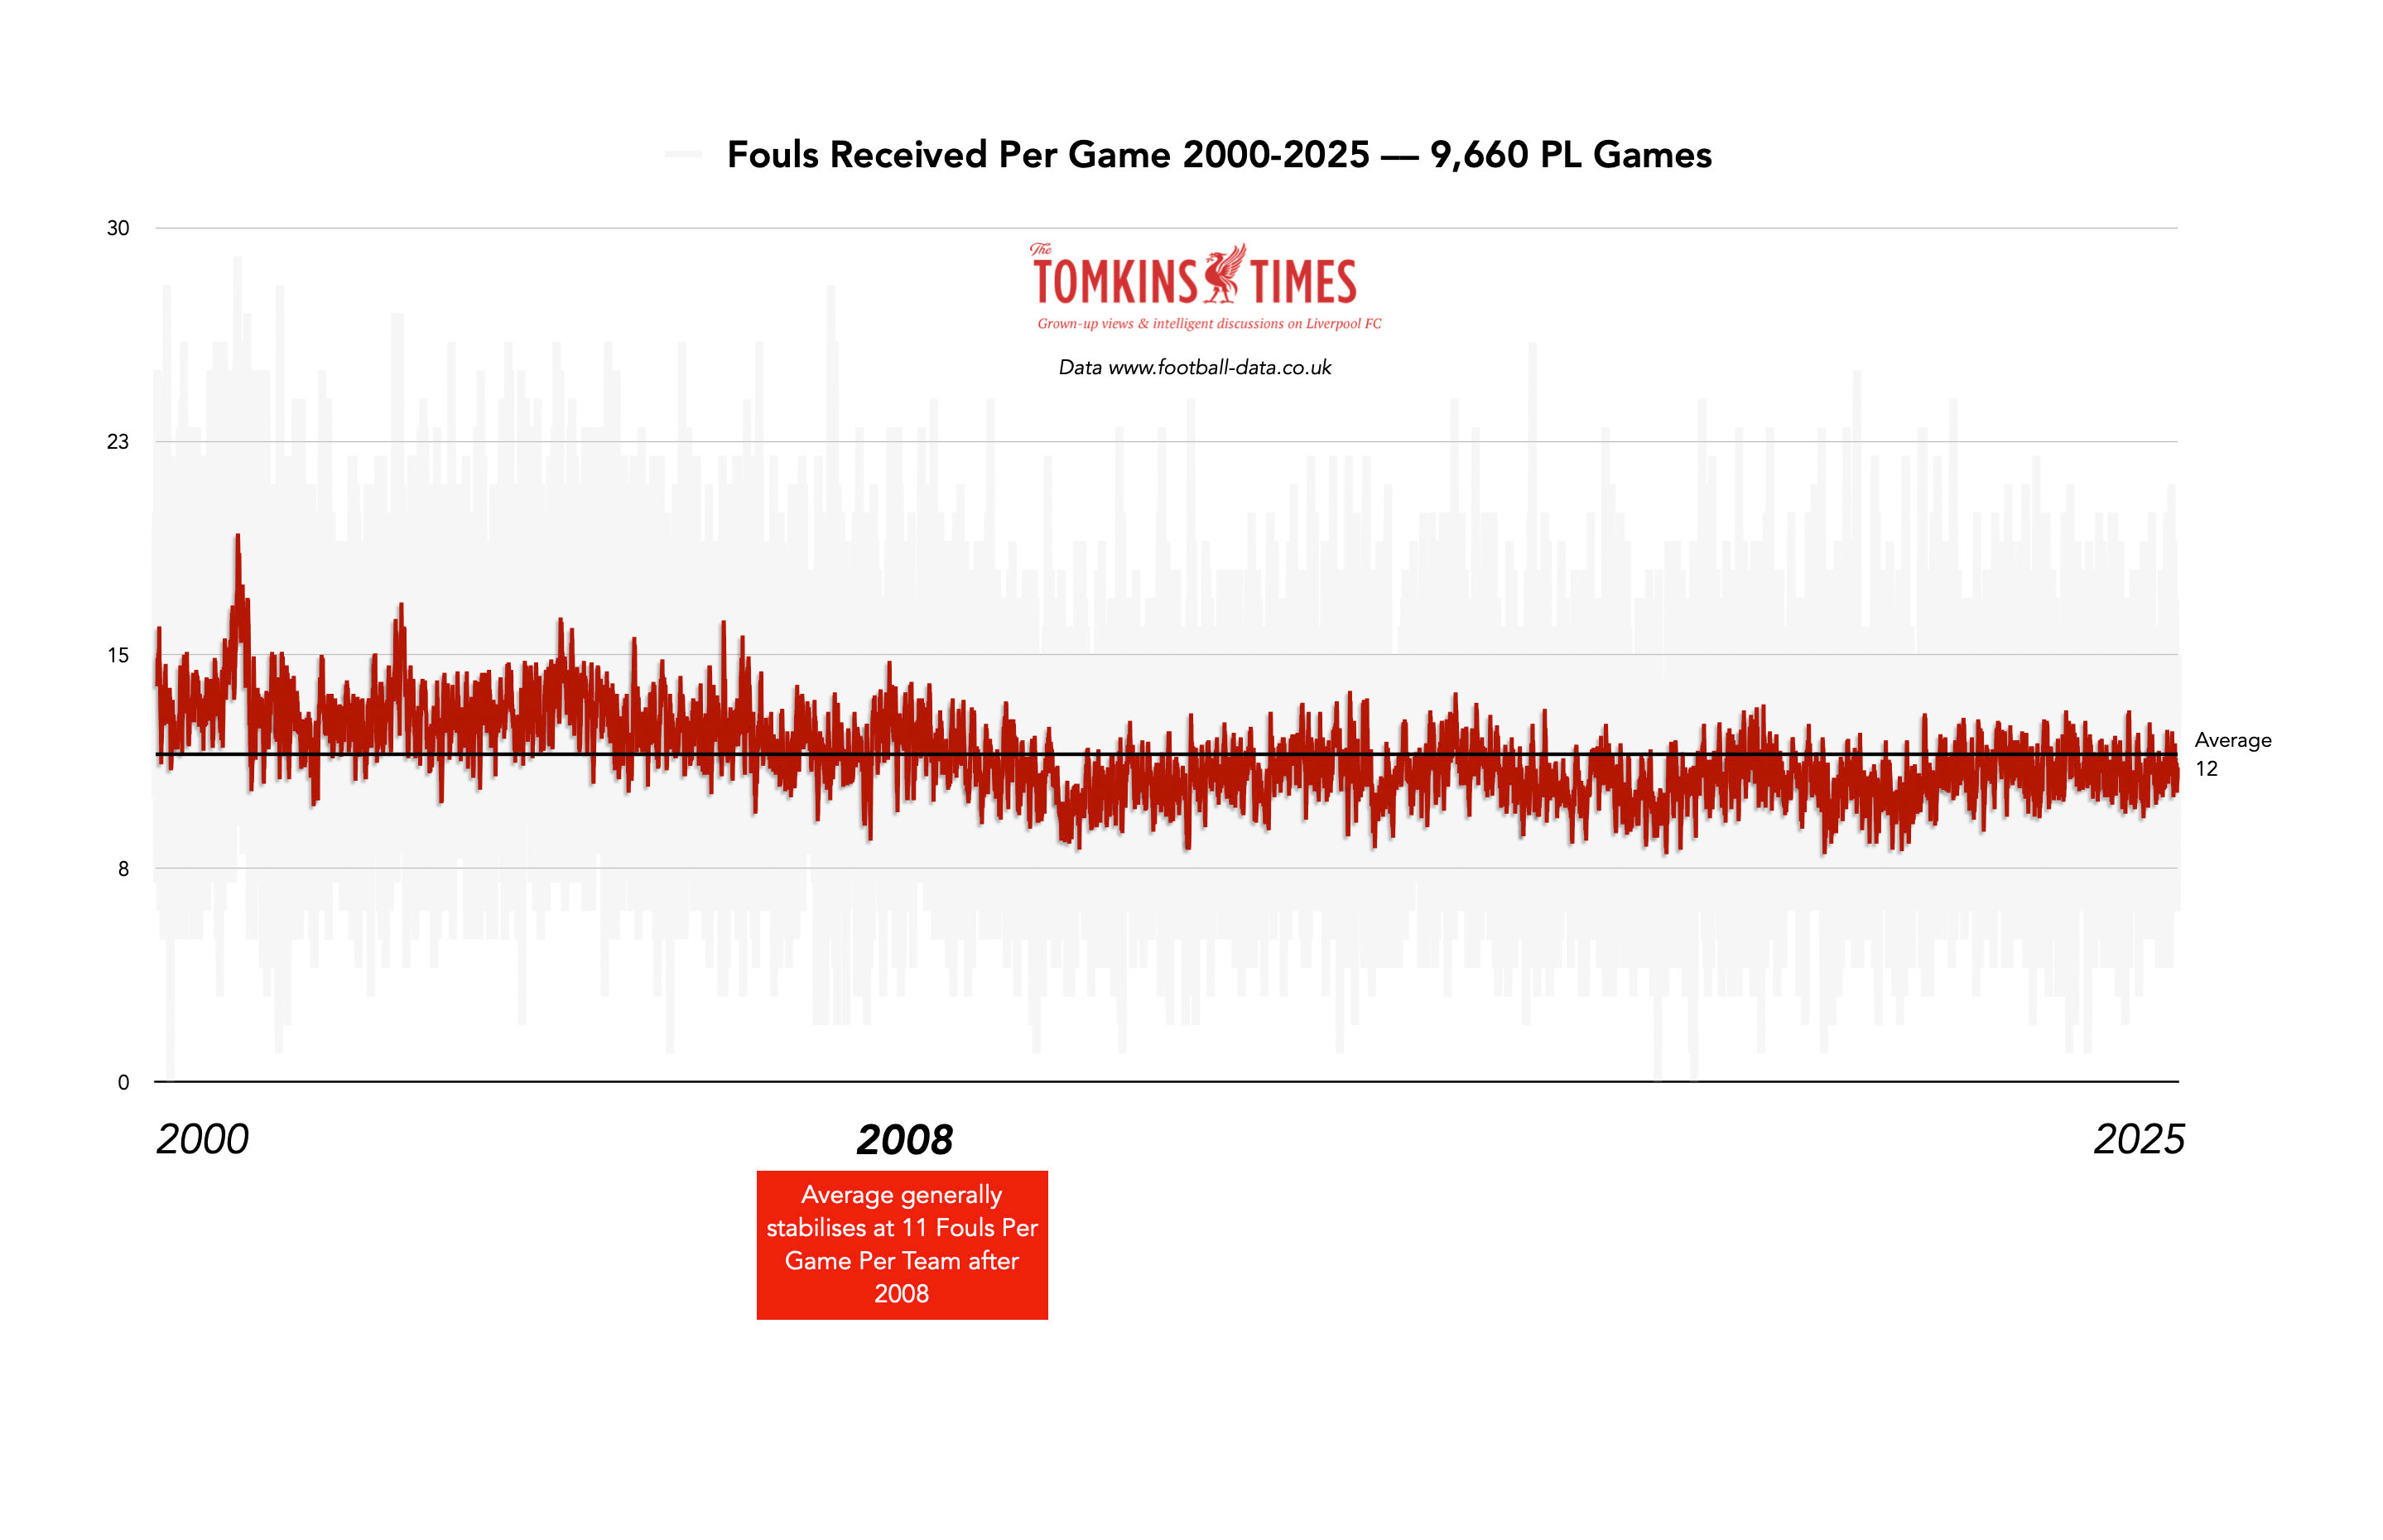
Foul counts in games were higher prior to 2008, but Foul Balance remains stable across the 25 years, as the slight general decrease meant that both teams lost some free-kicks. Since 2008, the fouls per game for the league as a whole is stable.
As you can see, I recently expanded my data that originally went back to 2023 back to 2017, and then found all the game data going back 25 years at https://www.football-data.co.uk/downloadm.php; from which I created a formula to calculate each team’s Foul Balance from the data (data is listed by home and away teams, not by club), and each team’s Dominance (Shots+Corners).
Note: I am working on the assumption that this data is correct; it seems so, whenever I’ve double-checked against other sources, but I cannot go and rewatch nearly 10,000 games!
Liverpool’s Foul Balance, already dipping from 2017, cratered around the time of the pandemic (when David Coote was filmed disparaging Klopp and Liverpool, perhaps as an indication of general PGMOL sentiment?) and has never recovered.
It got worse again in 2023, when relations between Jürgen Klopp and the PGMOL regulars hit a new low with the clash with 4th official John Brooks, for which Klopp was banned. (Mo Salah was dragged down twice in front of the bench, and Paul Tierney, who already seemed to hate Klopp, ignored it. Cue Klopp going mental.)
Other teams who played a similar style to Klopp or even Slot, but with worse attackers, midfielders and defenders (such as Ange Postecoglou’s Spurs who were more open, and more aggressive pressers statistically based on PPDA) had fantastic Foul Balances. So it’s not that Liverpool pressed too hard. It is therefore not a style of play issue.
There are different extremes of Foul Balance: level, narrow, moderate, extreme, ultra-extreme, and off the charts (utterly illogical), and I’ve used different names for each but given the numbers in the charts and graphs.
These can be logical, in keeping with domination, or illogical, going counter to the game’s other data.
A statistically highly illogical Foul Balance is when one team is utterly dominant in game metrics and penalised to hell by the referee with a massively negative Foul Balance.
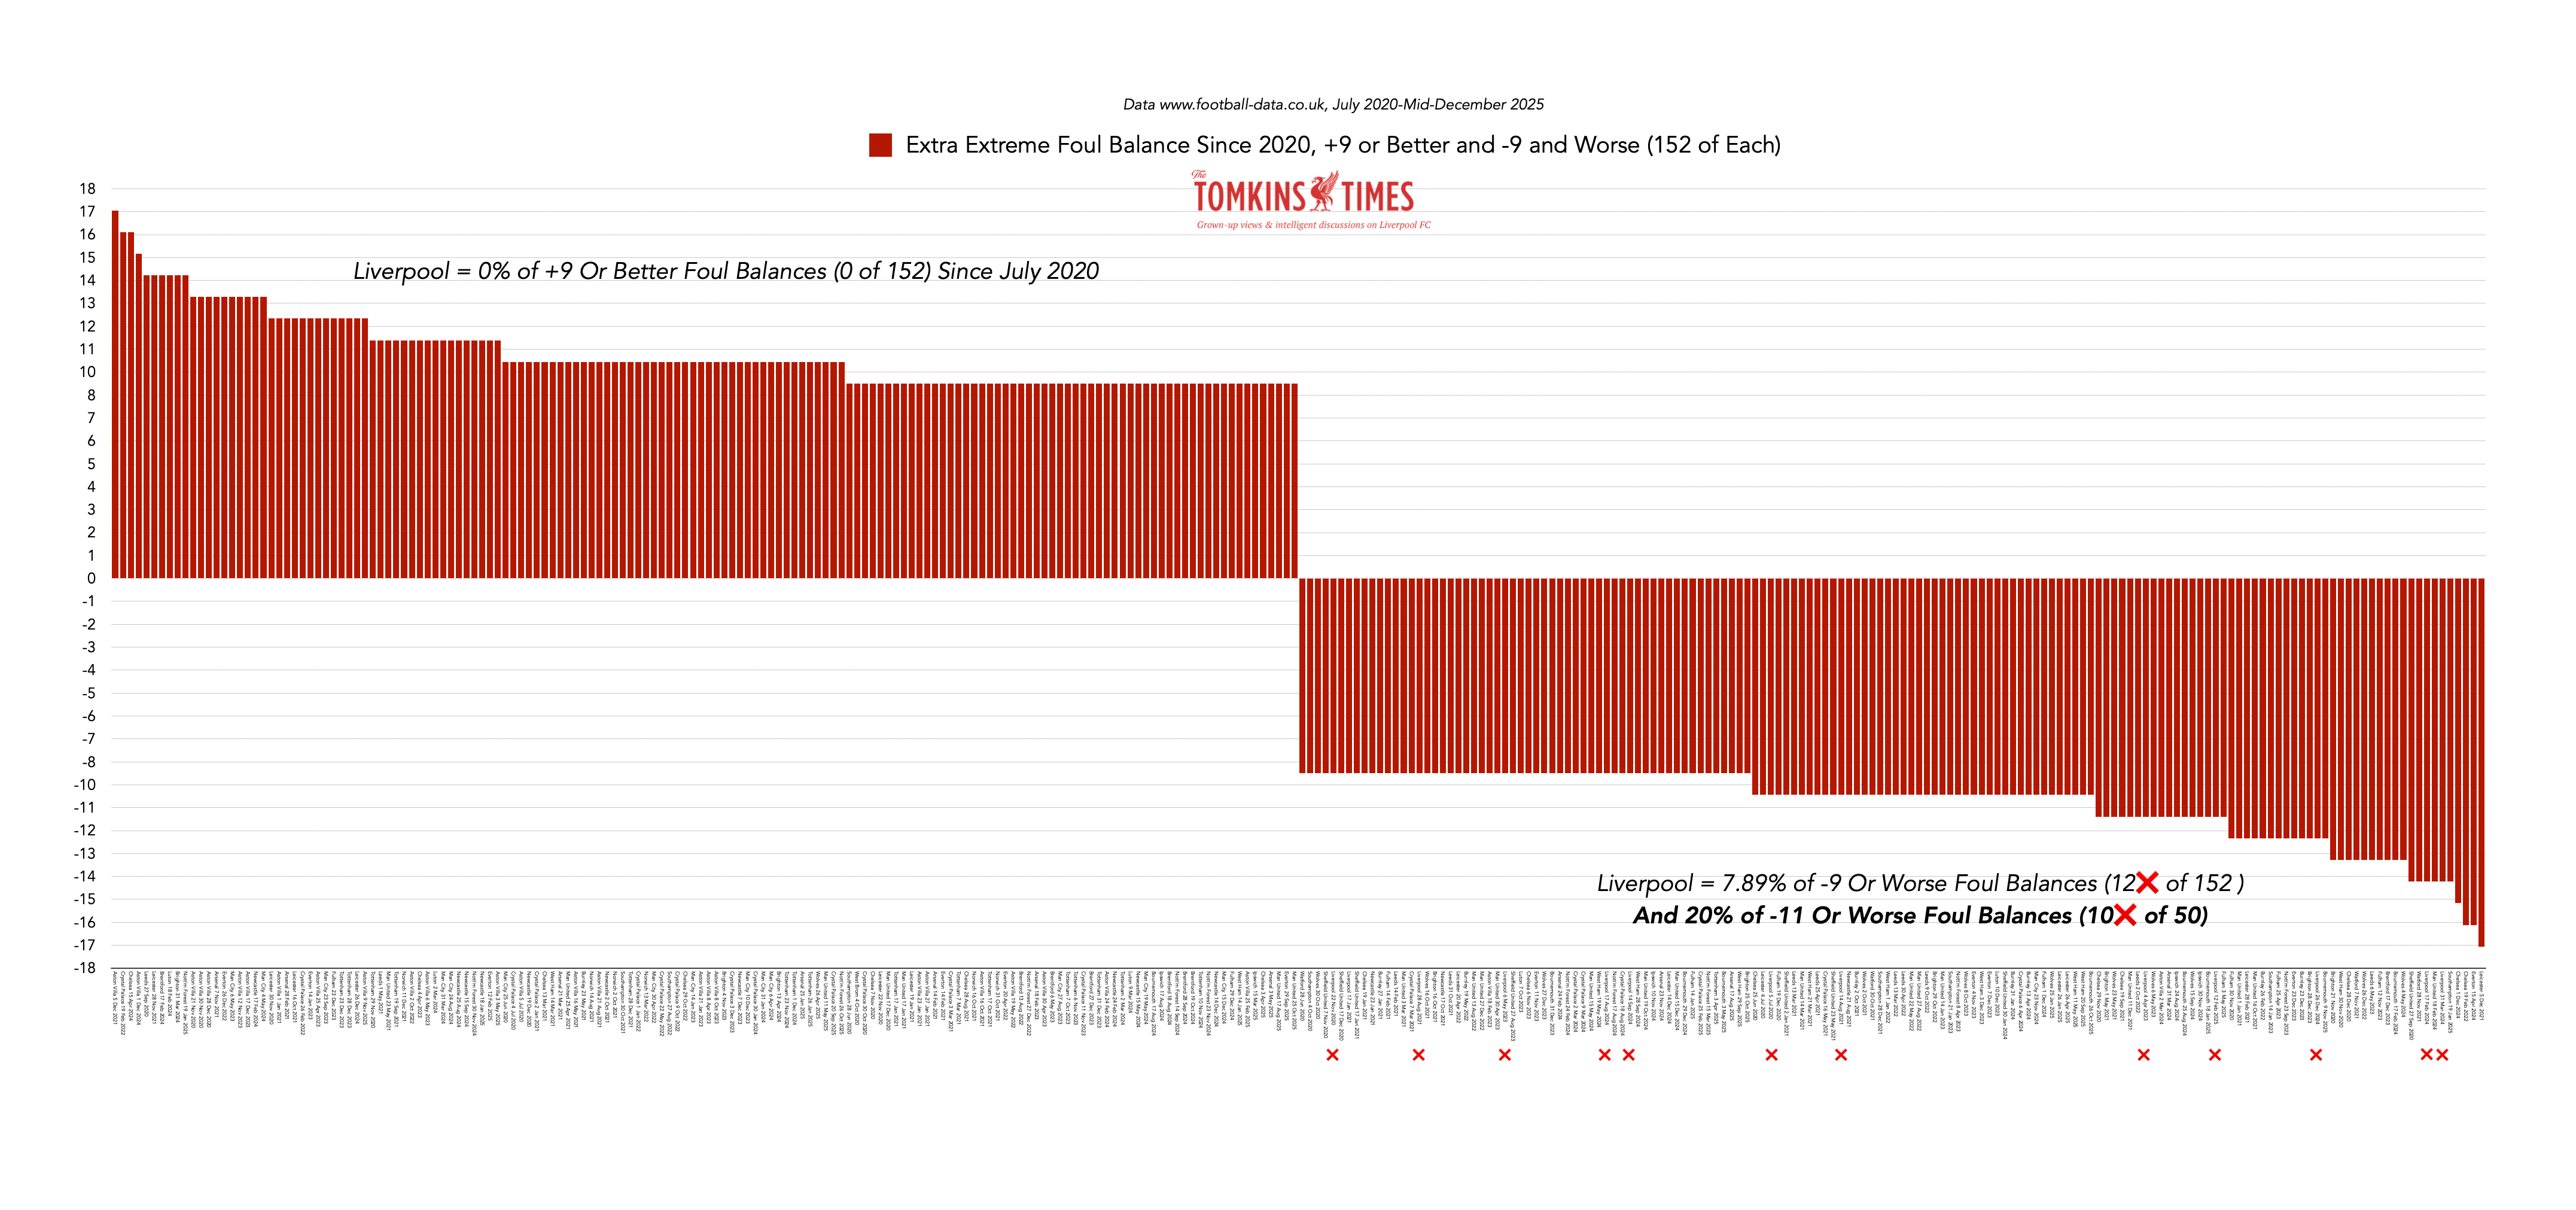
Since 2020, and with all data correct as to a few games ago, there had been 152 instances in all Premier League games of a Foul Balance of +9 (and thus 152 of -9).
Of the +9, Liverpool had zero. Of the -9, Liverpool had 12, or 7.89%.
If you go to Foul Balances of -11 or worse, then Liverpool account for 20%! – 10 of 50 – since the pandemic.
The only active refs who give Liverpool a positive foul balance on average are Craig Pawson and
tumbleweeds.Yes, singular. Okay, with John Brooks also a fraction in the positive.
It’s 141 games since Liverpool received a foul penalty via VAR, and it happened only twice in 247 games, way below the usual rate for other clubs. The VARs were Craig Pawson and John Brooks (before Brooks’ spat with Klopp).
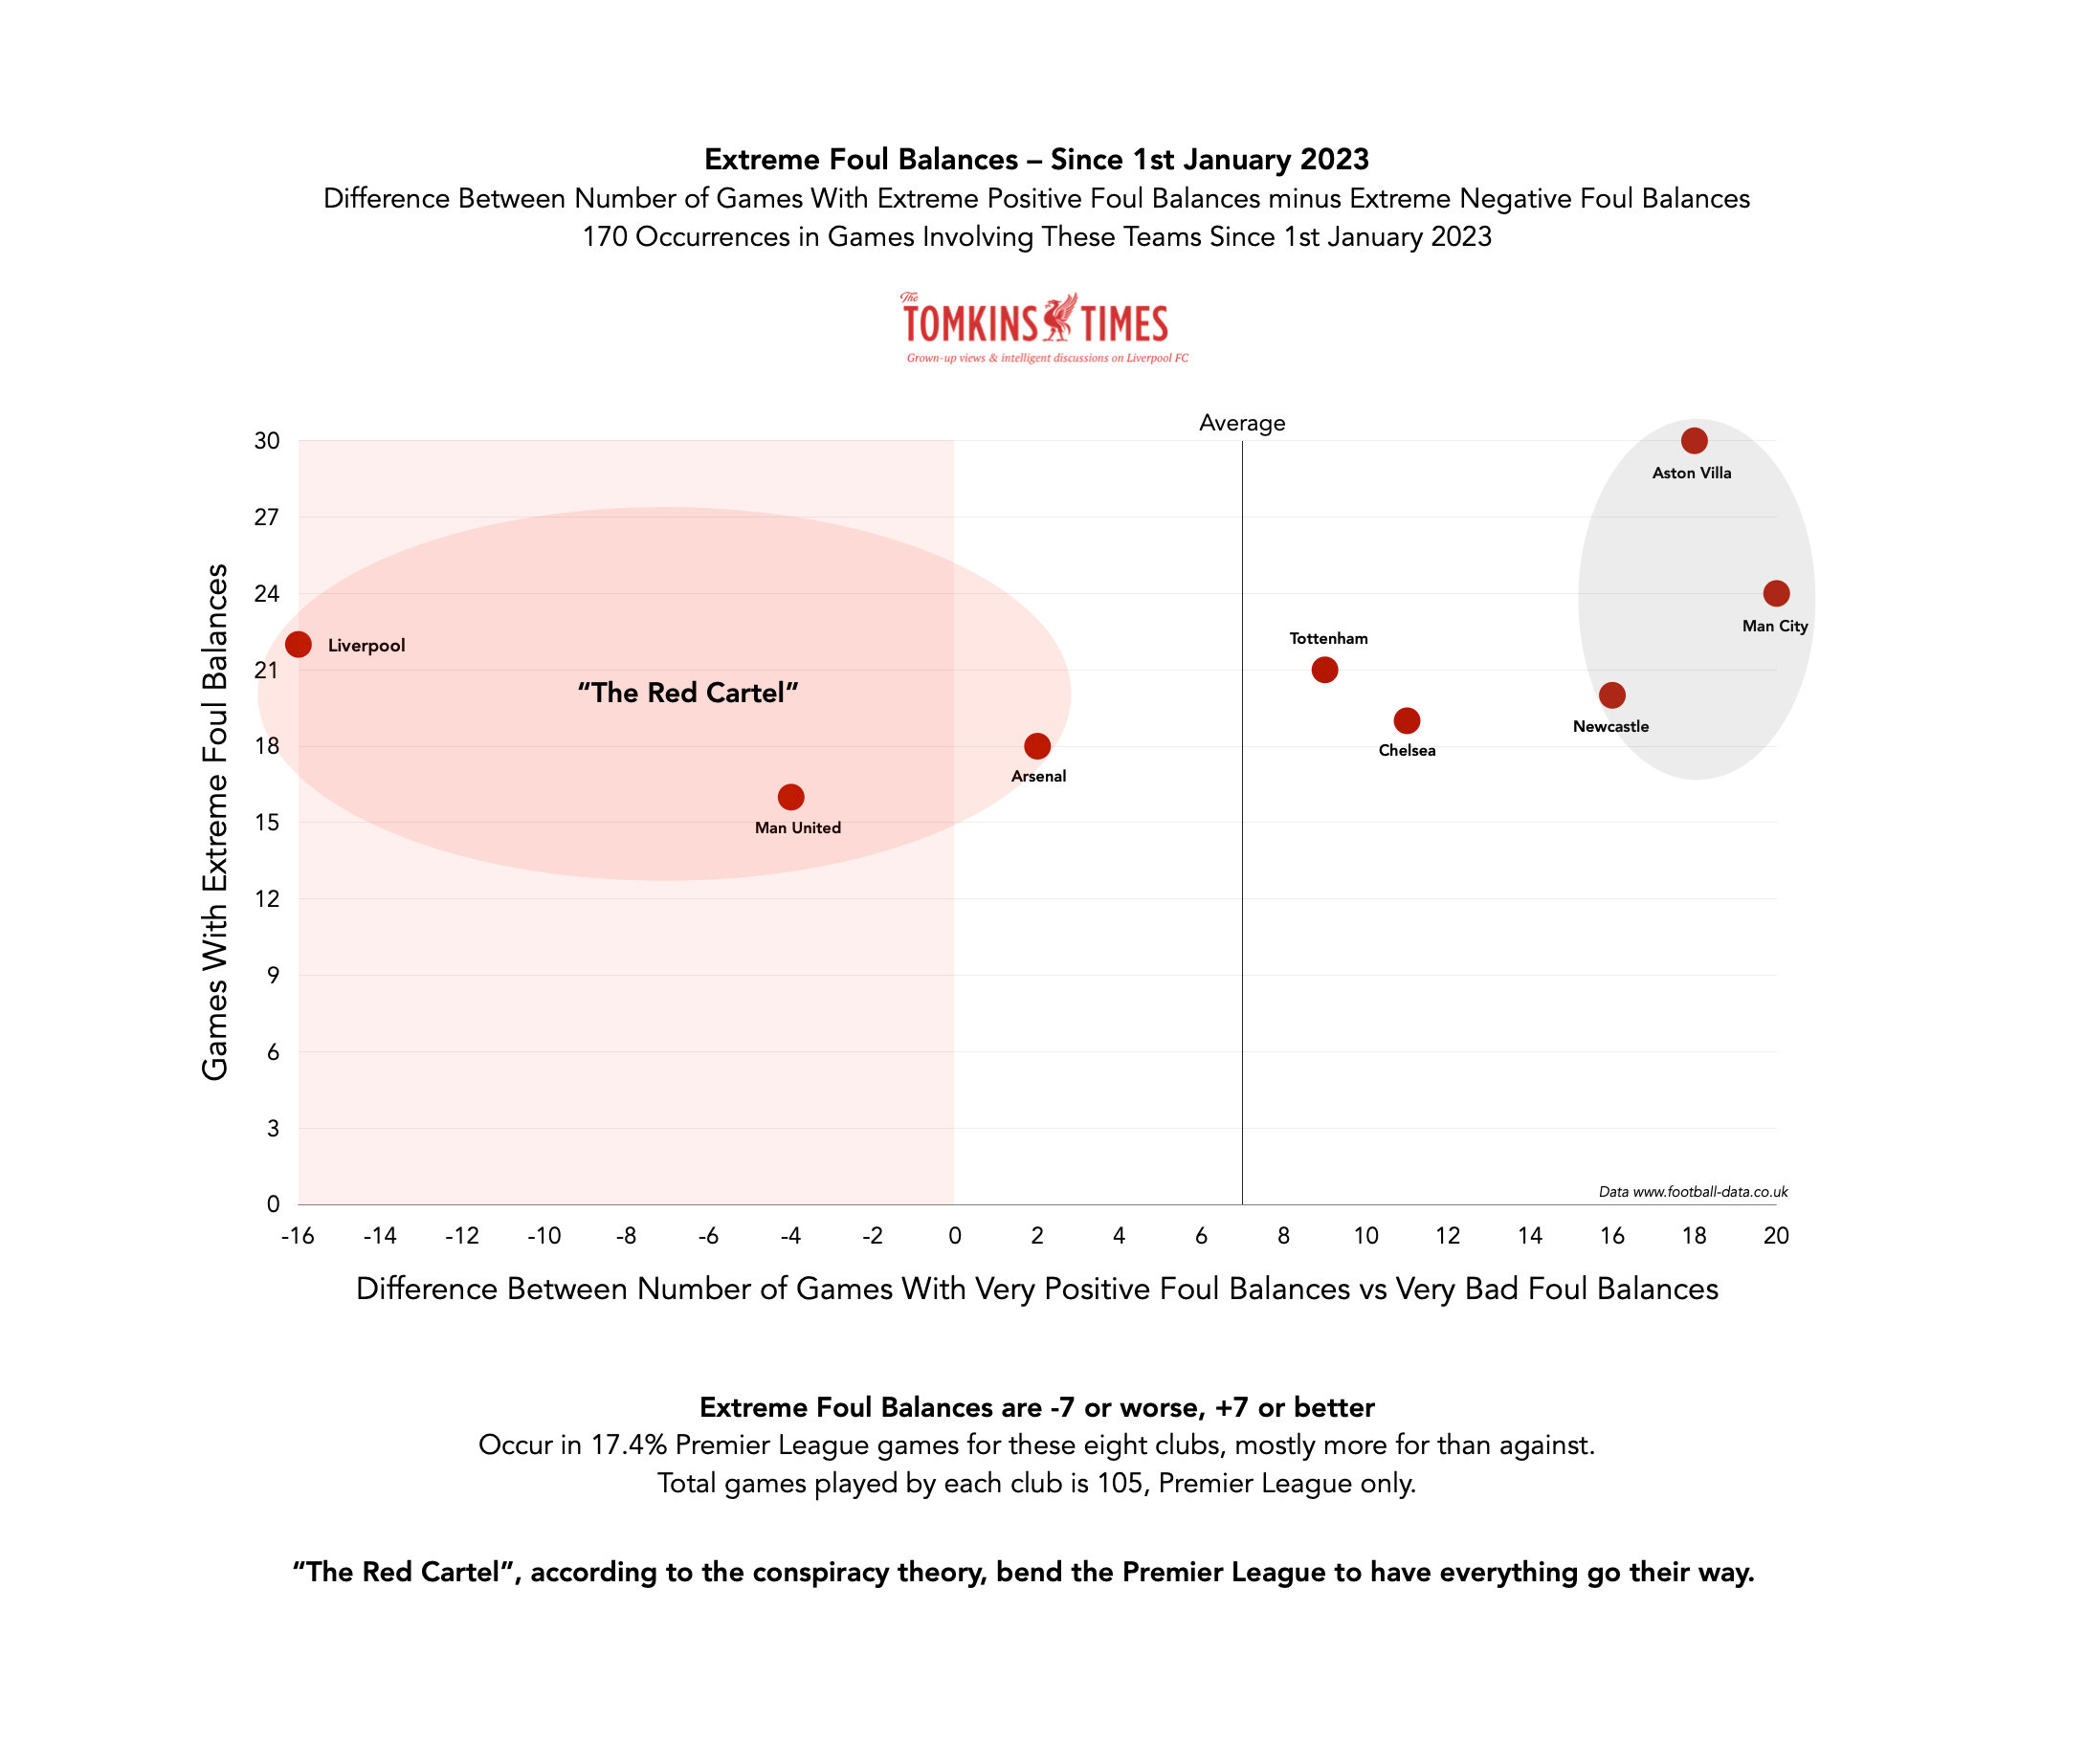
There’s a widespread internet conspiracy theory about ‘the Red Cartel’ (Liverpool, Man United and Arsenal) shaping things to their favour that has made its way into grounds – as seen by cries of “Premier League, corrupt as fuck!” from rival fans (such as when Anthony Gordon was sent off versus Liverpool and Liverpool got a stonewall handball penalty at Burnley).
Liverpool stopped getting decisions after these two early-season games, and the cries of the league being corrupt from fans including those owned by the Saudi state. Meanwhile, we all await the 115 charges…
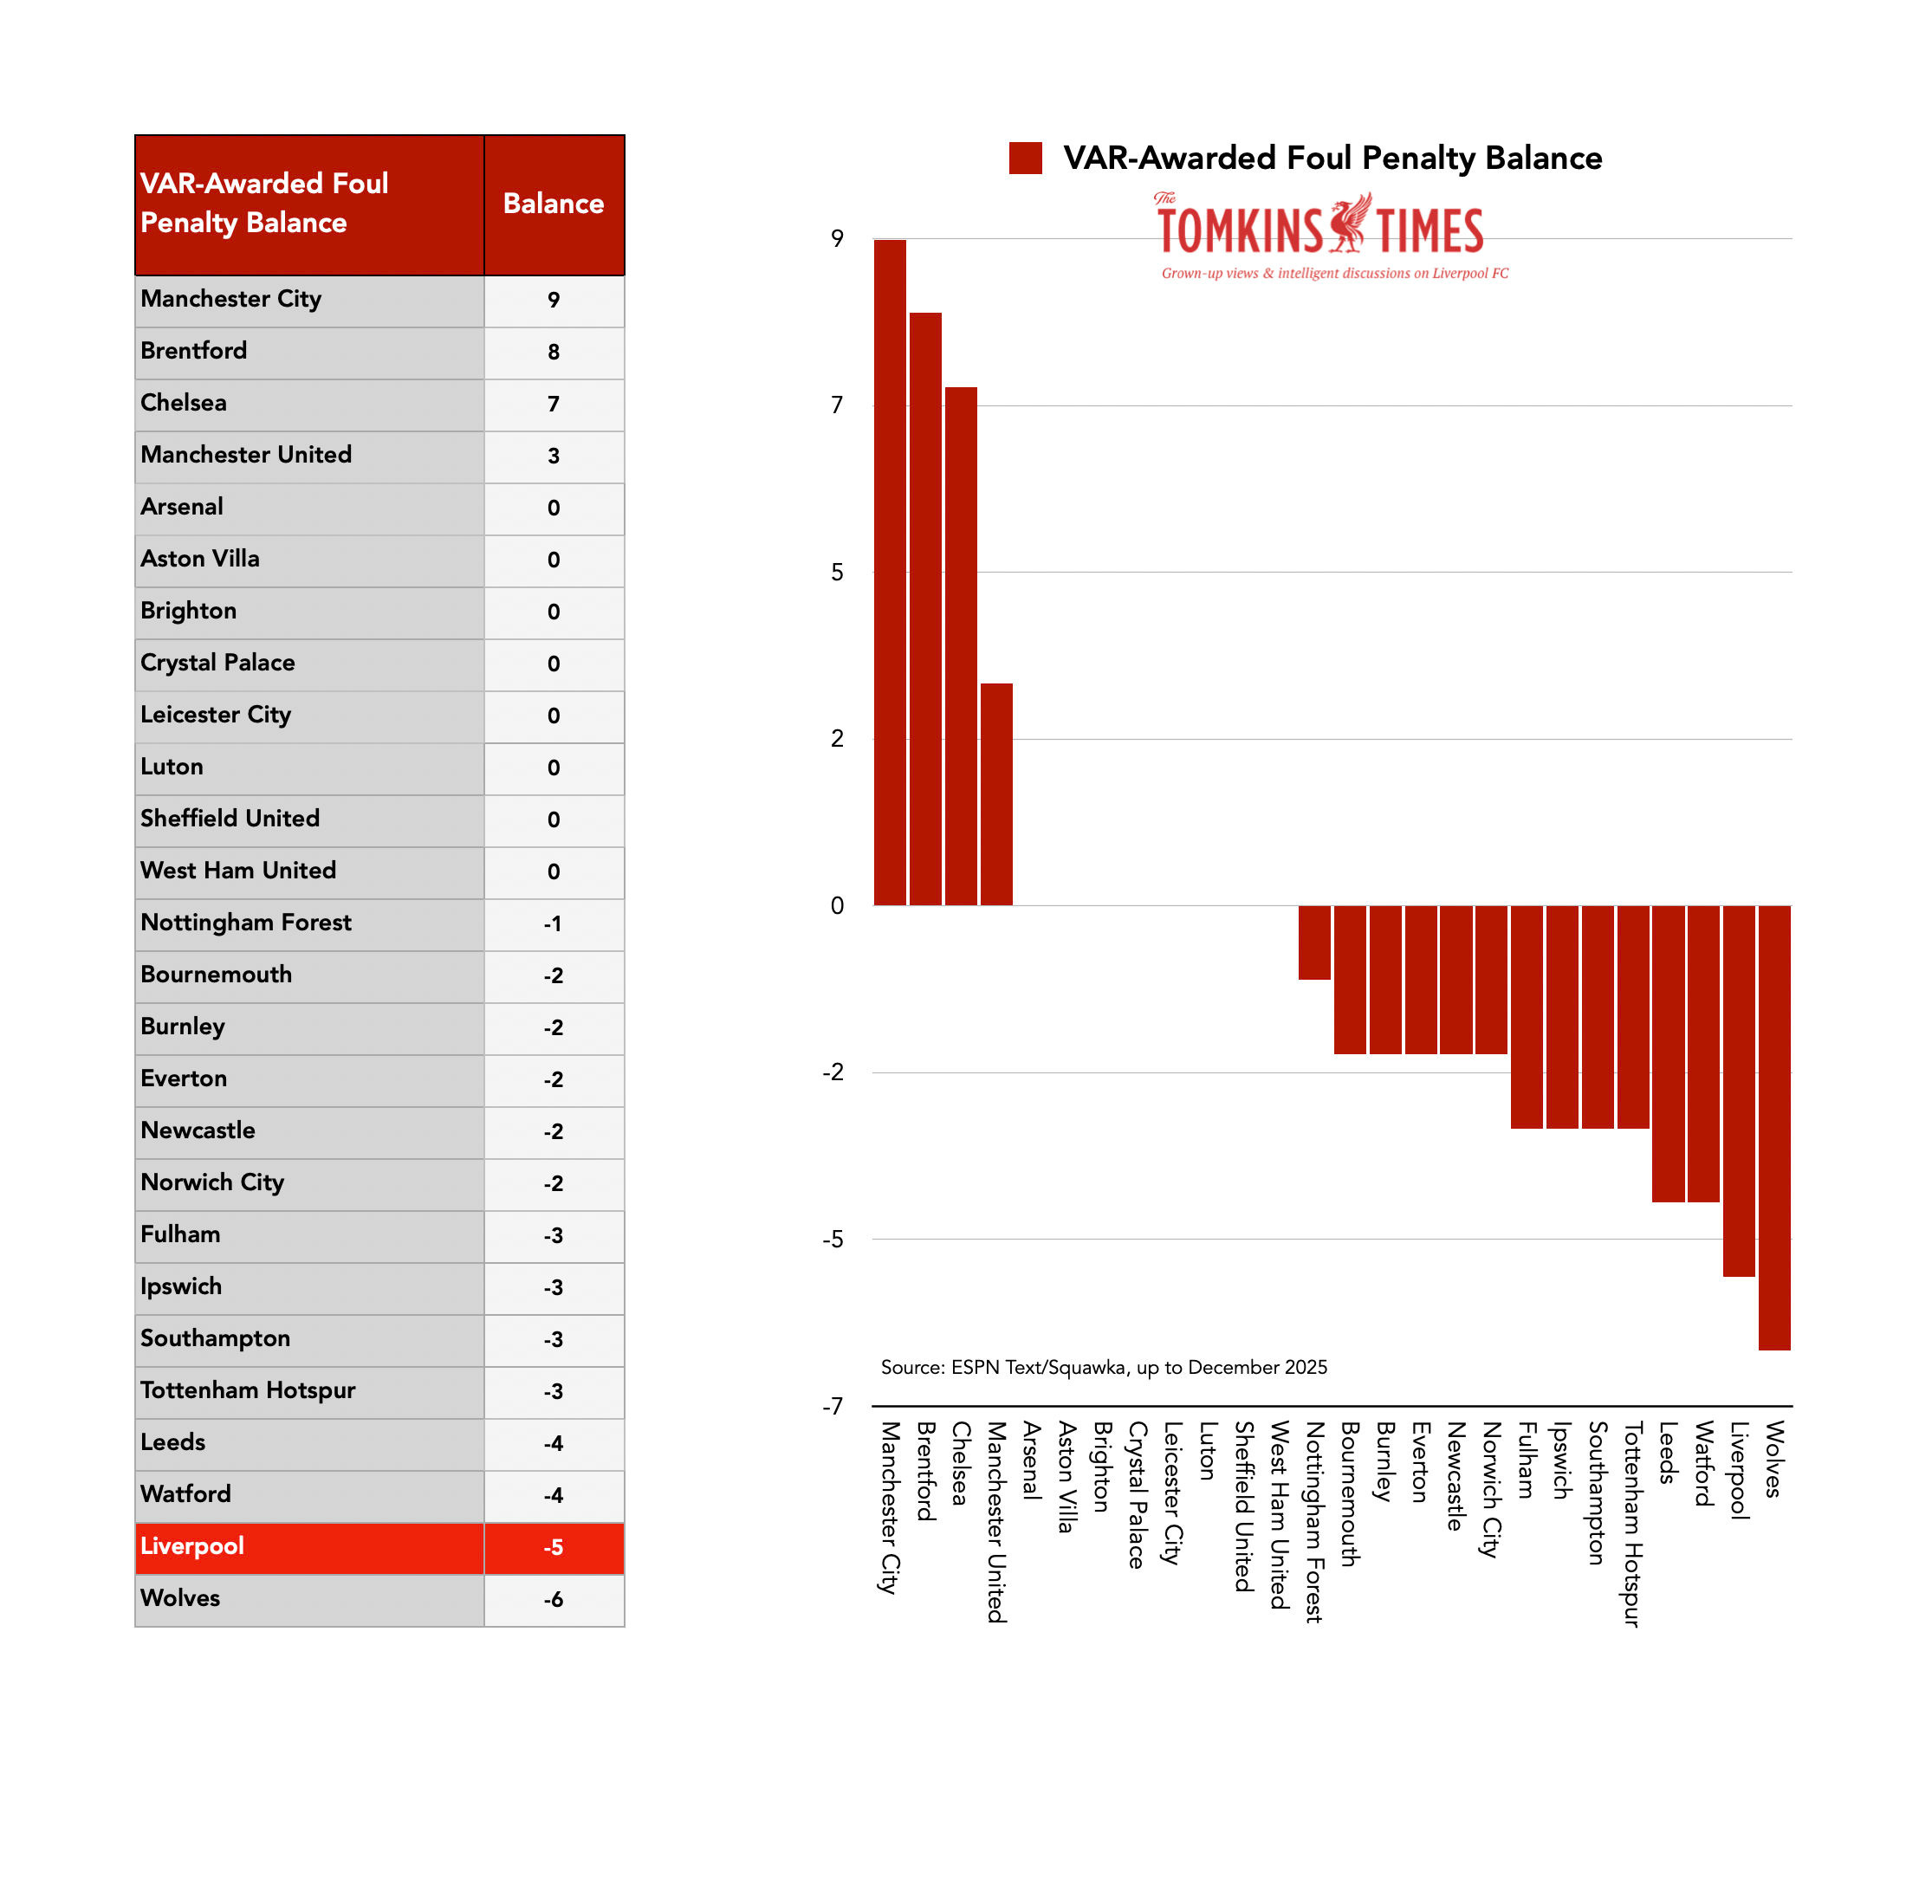
Yet since 2023 (and at times before), this supposed ‘Red Cartel’ are all likely to be far more harshly treated by refs and VARs; while Man City, Newcastle and Aston Villa (whose owner is connected to Man City’s due to moving to their country and voting in line with them on financial issues) are the leaders in Foul Balances and VAR overturn data.
In just over 10 months, and a run of 31 games spread across two managers, Liverpool suffered three of the five (by far) most statistically illogical Foul Balances seen since 2000 for any club in 9,960 games.
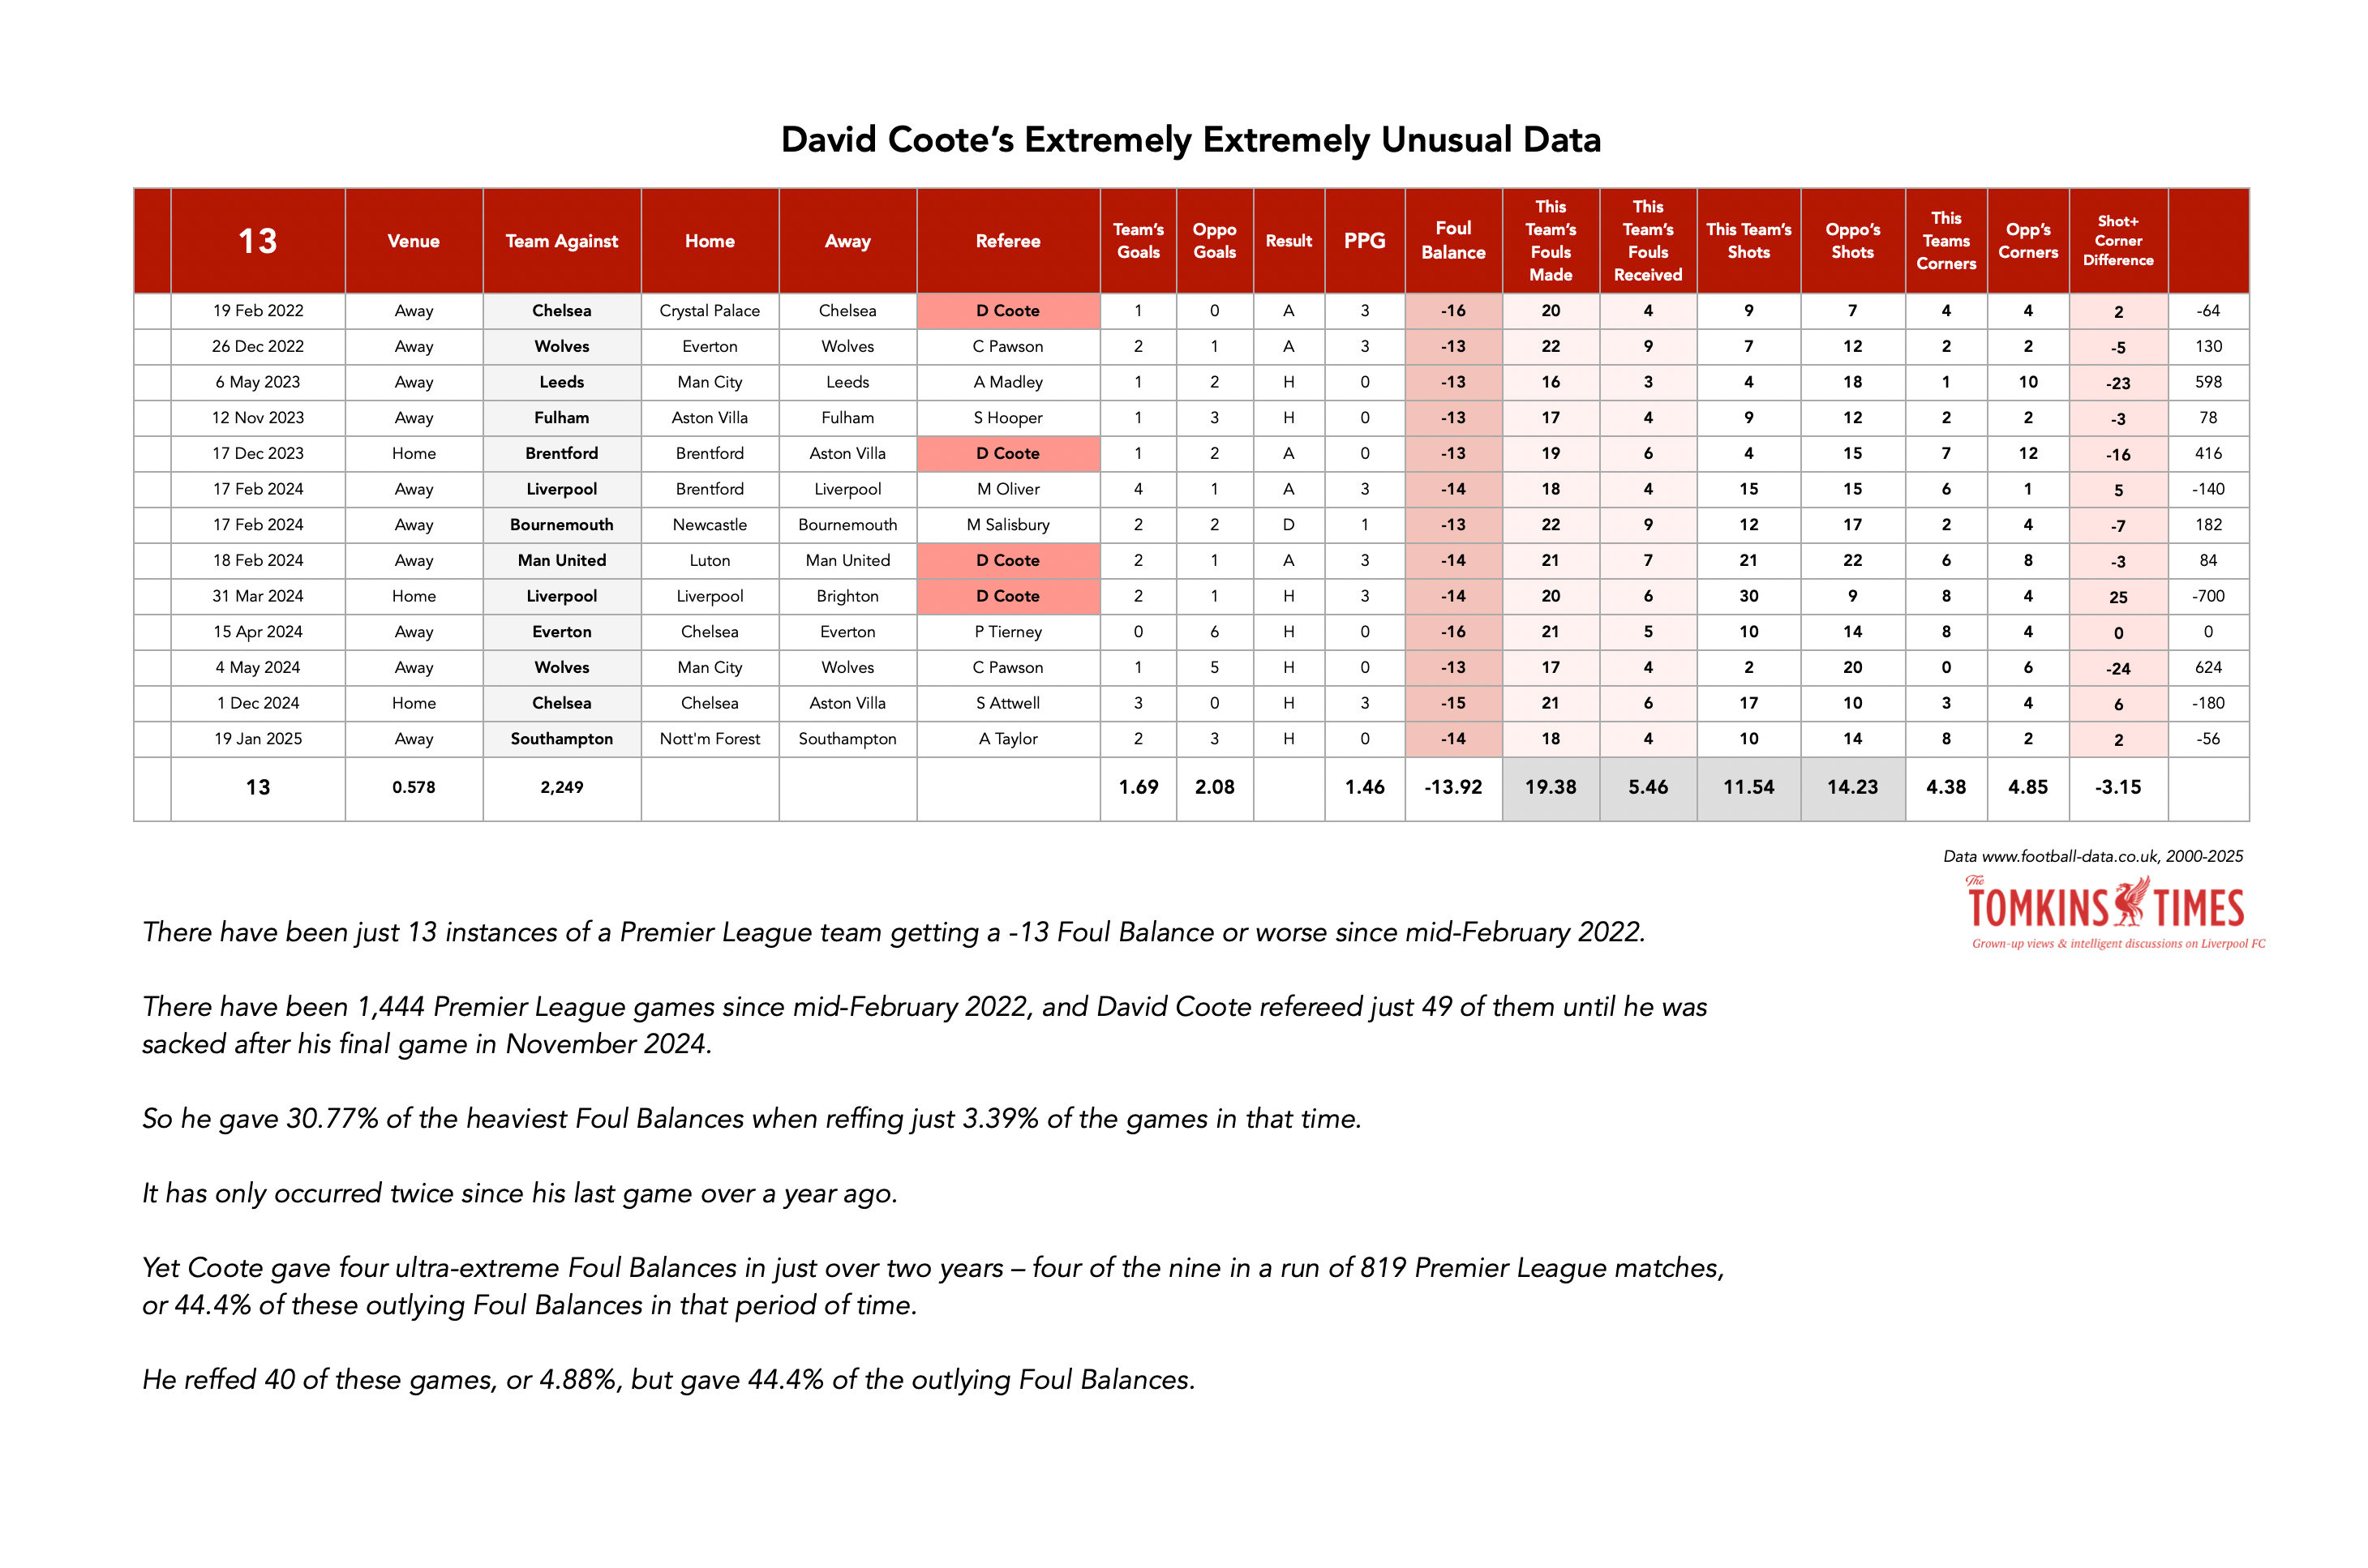
The very worst of these was one of David Coote’s mere three games refereeing the Reds. You know – Mr Integrity, Mr Nice Guy, Mr Indecent Images of a Minor, etc.
Indeed, in March 2024, with Jürgen Klopp’s Liverpool top of the table in the run-in (the same run-in with the ludicrous lack of a penalty from Stuart Attwell as VAR on the Jeremy Doku high boot on Alexis Mac Allister, which ref Michael Oliver couldn’t see but agreed with), Coote was brought back, weirdly, after being kept away from Liverpool games for three years on account of how terrible he was (before everyone knew that his hatred was far deeper than we realised).
Coote was the VAR, working with Oliver, when Jordan Pickford was not sent off, and disallowed a late Liverpool onside winner by calling it offside – just days after he’d been filmed down the pub calling Jürgen Klopp “a German cunt” and saying Liverpool were rubbish. Even without this video, Coote was kept away from Liverpool games.
In general, Coote has by far the most suspicious Foul Balance data of any referee in the last 25 years. I find his data suggestive of someone trying to shift a game towards a certain result; while his VAR interventions suggest someone looking to win a first goalscorer bet by making seven of his eight foul penalty overturns as a VAR incredibly early in games.
But Coote’s most suspicious game was Liverpool vs Brighton, March 2024. Liverpool battered Brighton all game but ended with only six free-kicks won to 20 conceded; an ultra-rare -14 Foul Balance, even more rare for a home team and super-super-rare for a home team absolutely bossing the ball, the shots and the corners.
Coote was suddenly brought back with Slot’s Reds top of the league and in danger of opening up a lead, and Coote denied Mo Salah a clear early DOGSO against Aston Villa (with two crosses of his arms to say no foul) – “inexplicable” said ex-refs – and a couple of days later someone released the damning video as if to say this was no accident.
In a two-year period there were only nine ultra-extreme Foul Balances, and Coote was responsible for FOUR of them. (No other ref appears more than once.)
These are occurrences that are rare since 2000, so to have four in two years – accounting for almost half – seems highly suspect, allied to his VAR data and allied to what we know about his actual lying, criminal behaviour, and the various allegations of drug use and match-fixing, the latter of which was brushed off, lest anyone thing he may be properly corrupt (insert shrug emoji). But more on Coote later.
So, as can be seen with Foul Balances and free-kicks won this season, Liverpool only getting one single foul free-kick in the second half against Sunderland, at Anfield, attacking the Kop with wave after wave of pressure for the whole half, is an example of the points lost due to bad officiating (several clear fouls were ignored); similarly, the Leeds game last night showed that not giving fouls inside and outside the box is costly, as you would think. To win only eight free-kicks when ultra-dominant is odd. To win only five, as Attwell gave the Reds vs Sunderland (and one after half-time) is just bizarre.
Not every game outcome will be explained by Foul Balance, obviously; but when one team is dominant and loses the Foul Balance, it harms their chances of winning. This is about probabilities, and if you don’t get your fair share of free-kicks but are punished for making them (even at just a normal rate, not suggestive of a dirty side) then you will drop points.
Refs clearly favour British born players of any ethnicity to foreign players, based on the data. I showed this in 2019 with a study of the previous 600+ Premier League penalties, where British attackers won more and British defenders conceded fewer, based on percentage of minutes played. Even though the best players were more likely to be foreign.
English players of any ethnicity clearly appear to be favoured amongst those who win the most fouls and the most penalties, beyond their proportional representation.
Liverpool, as noted, do better for fouls and penalties when the team is Brit-managed and/or Brit-heavy with players.
I established this in 2019 for penalties but now I can show that it applies for fouls too. In recent games, see how Curtis Jones was given free-kicks for less obvious fouls than Jeremie Frimpong being kicked and manhandled and pushed over, Mo Salah style.
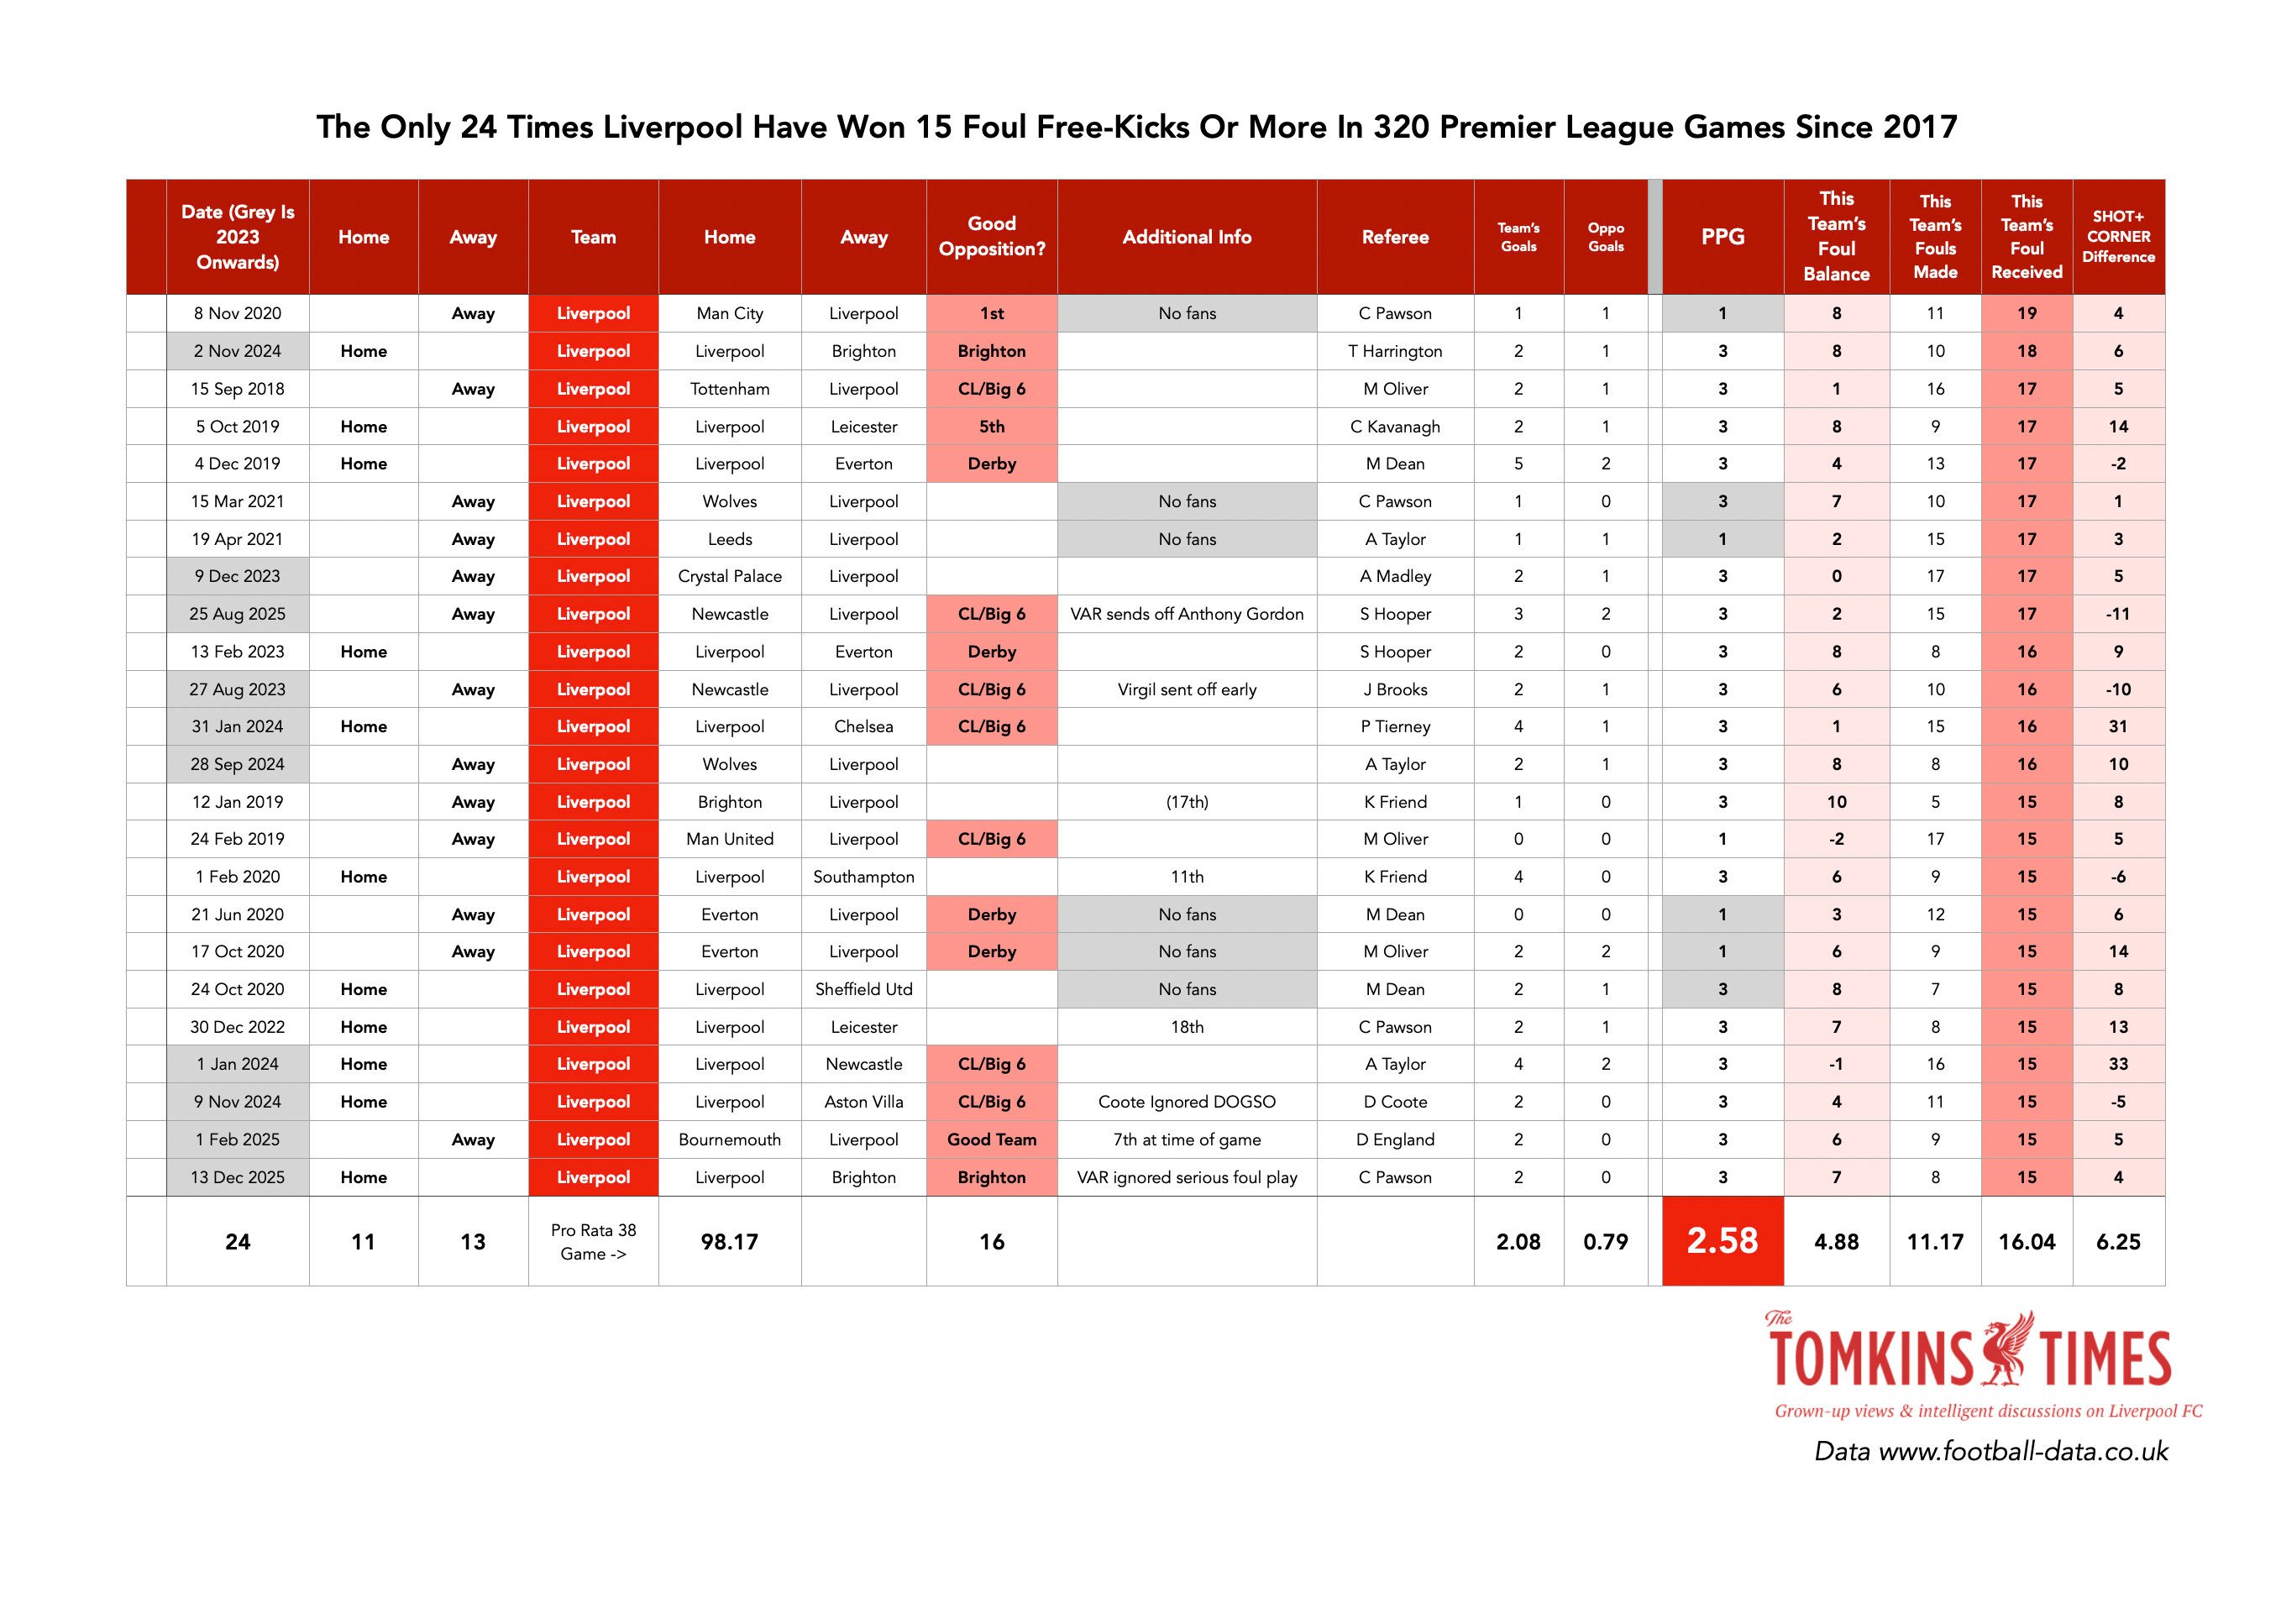
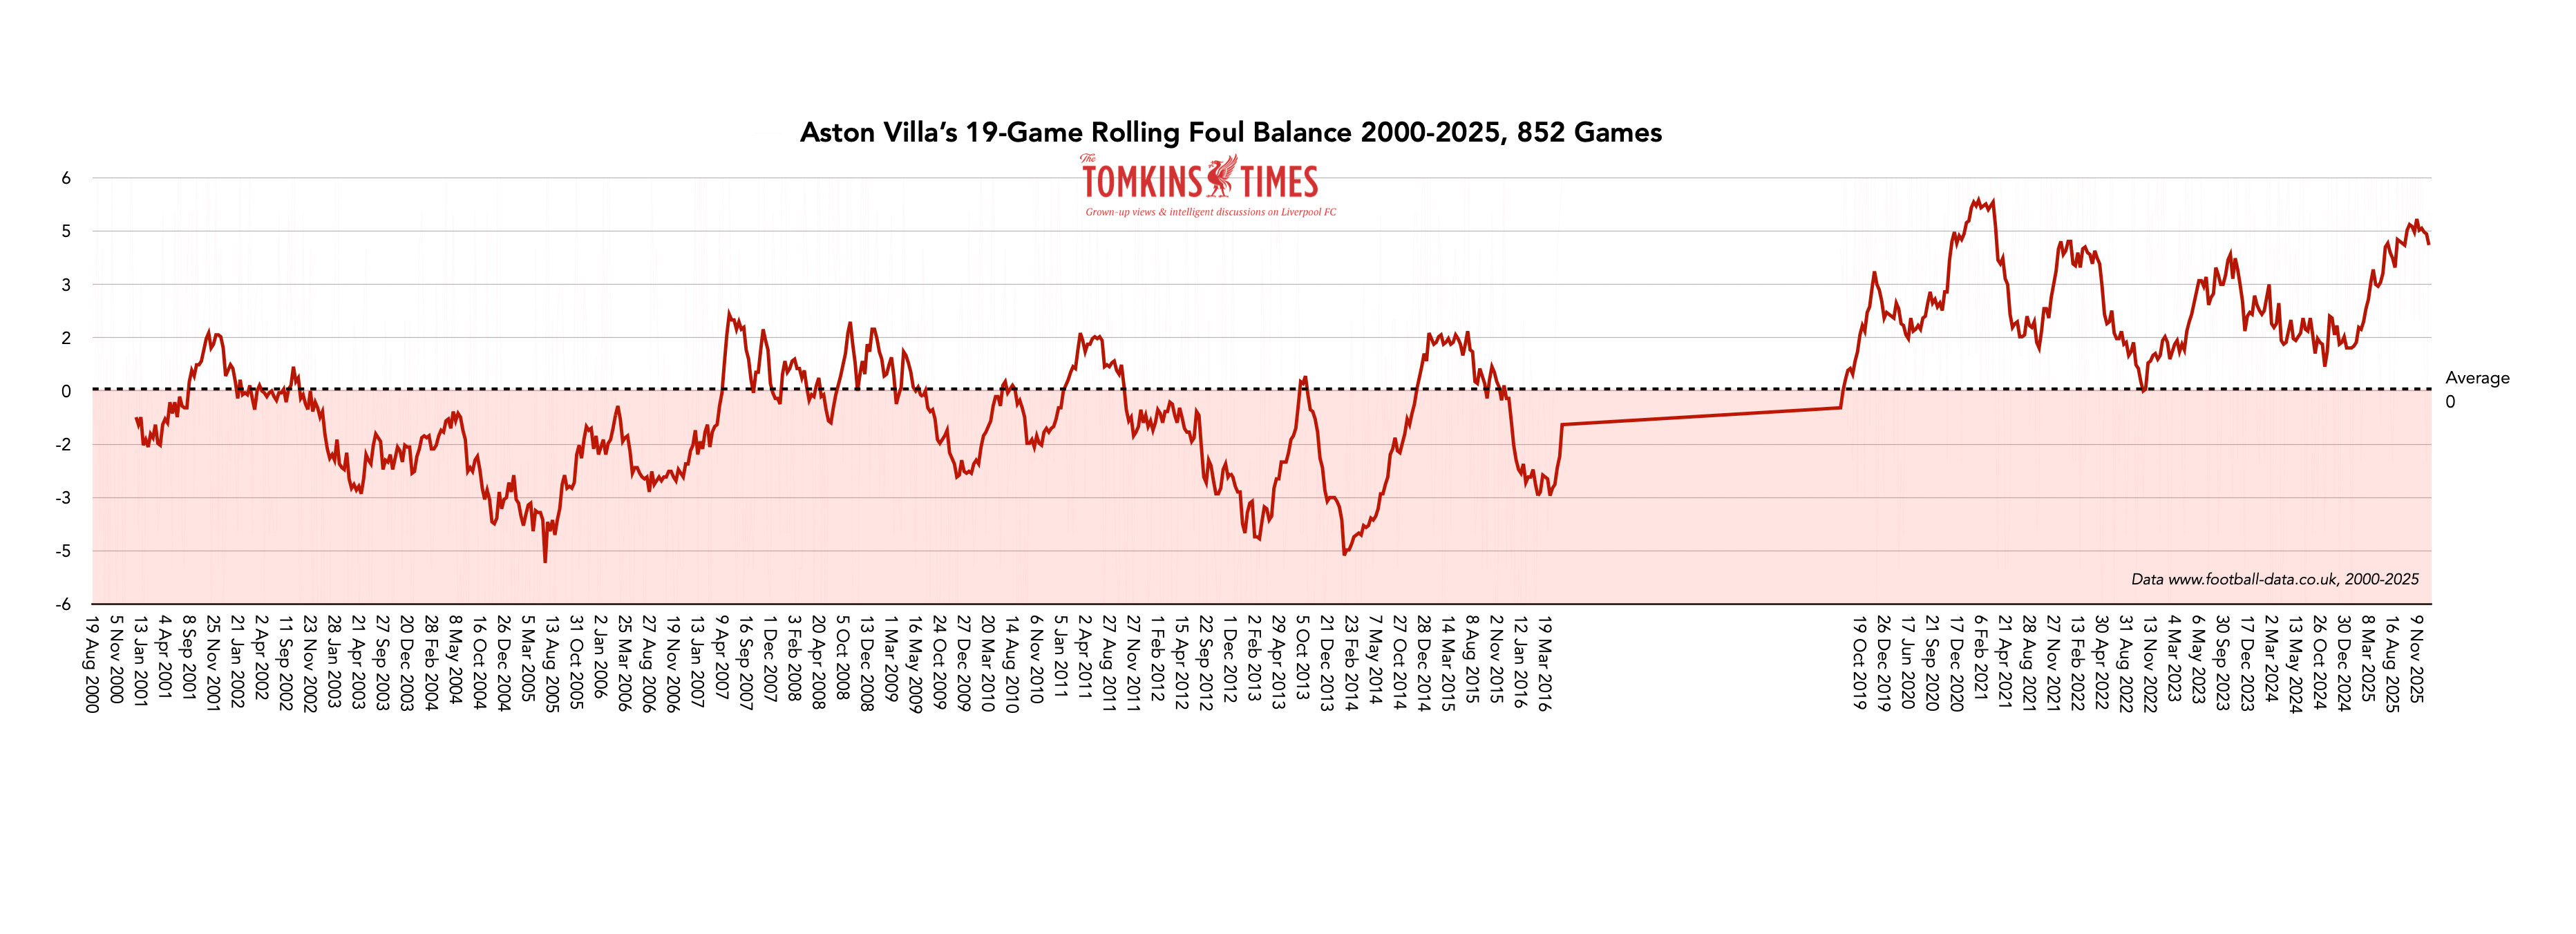
As a comparison, since their promotion in 2019, Aston Villa have won 15+ foul free-kicks a game a frankly astonishing 101 times; 40.9% of games!
Since 2017, Liverpool have received 15+ foul free-kicks a game just 24 times in 323 league games, or just 7.43% of matches.
Results from these 24 games with a tougher than normal opposition = almost a 100-point season pace, 2.58ppg.
Liverpool haven’t won more than 19 foul free-kicks in a game since October 2016. There have been EIGHTY instances of a team winning 20+ in the Premier League since October 2016.
(There have been c.80 VAR overturns for other clubs before Liverpool have ever got one in terms of match-minute; c.80 penalties earlier in a game than Liverpool received one since 2015 by match-minute, bar the empty stadia season; over 80 VAR foul penalties before Liverpool get one in terms of match-minute, etc. And over 80 second-yellow cards with none to Liverpool’s opponents between 2015 and 2023, as just some of the consistently inexplicable data. At least now refs are giving the Reds’ opposition’s players second yellows, albeit often very late in games. No progress on DOGSOs – they only go against Liverpool, not for.)
Again, to use as a comparison, Villa – and don’t ask me why! – have won 20+ foul free-kicks on no fewer than 16 occasions simply since 12th July 2020 (they were not in the Premier League from 2016-2019). And most recently, when Chris Kavanagh was reffing them at home to Wolves in 30th November 2025. And that’s a lot since Jack Grealish left in 2021.
As such, Villa win the Foul Balance by a rate that is beyond all other clubs, albeit Man City, Newcastle and Spurs have been up there in recent seasons. Half of the 16 games Stuart Attwell has done for Villa have seen him award them a heavily positive Foul Balance of +7 or more, and multiple 20+s.
Since the end of 2024, Liverpool have won 15 foul free-kicks in a game just twice (Pawson is again one of the only refs to give Liverpool a normal distribution of anything).
Villa can top that number since just mid-December 2025; three in the last four games. (The data I downloaded a while back doesn’t cover this period, but I just checked.)
And Villa have nine since September, when their form improved.
Villa are a good team, clearly, and maybe they merit all these outcomes – I’m going on the data as I don’t watch each and every game unless it’s Liverpool. Maybe teams just go around kicking Villa specifically.
But it’s odd that a much better, more dynamic team like Liverpool between 2017-2025 should fare so much worse. I’ve also pointed out how Ange Postecoglou’s Spurs had a massively positive Foul Balance, and they were careless, reckless, manic, and for a while, great fun to watch. They kept winning the Foul Balance even with some nutters in their team.
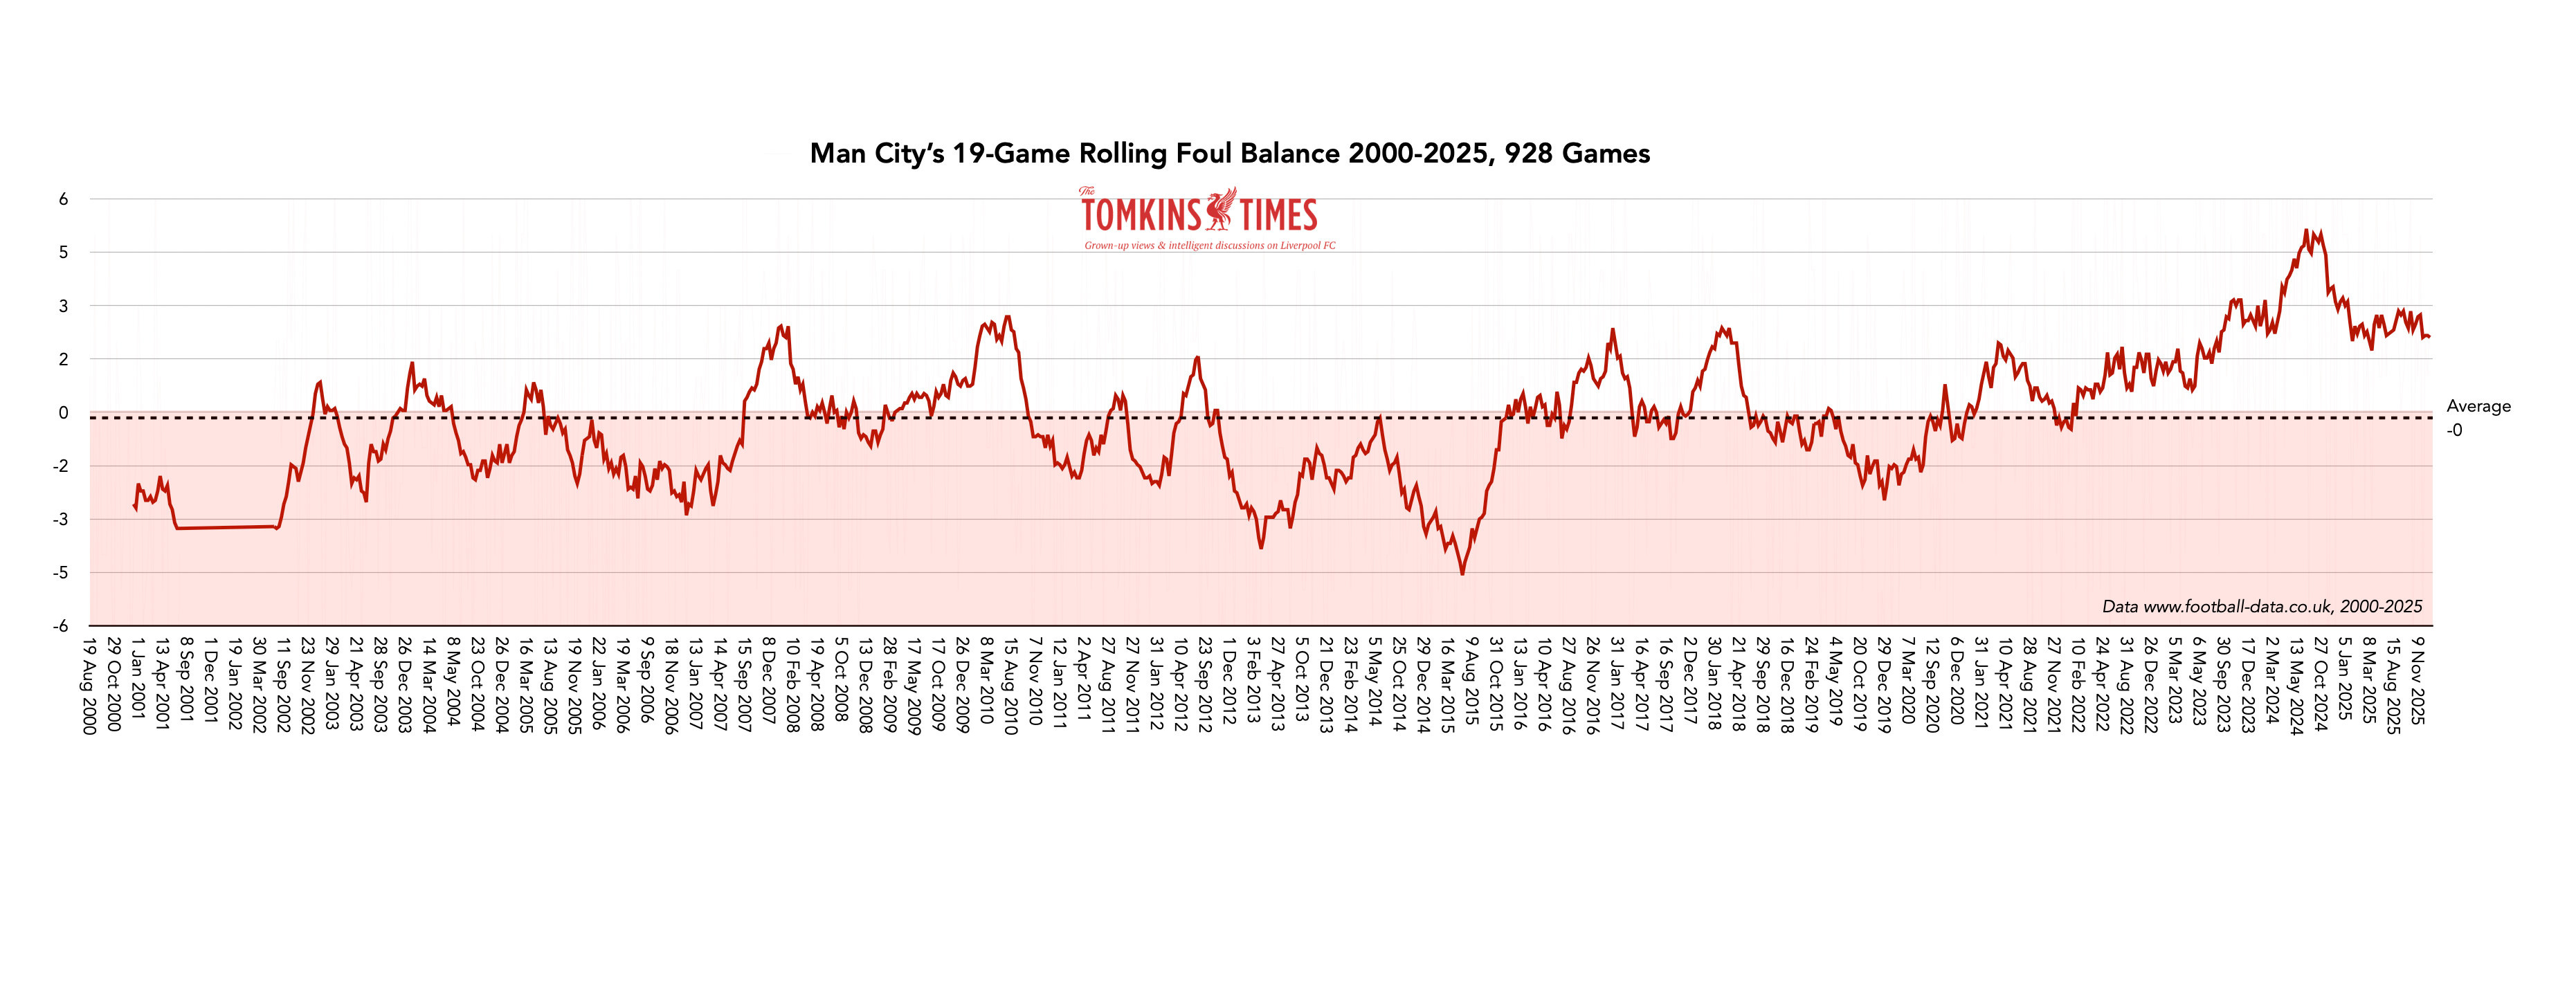
Man City’s Foul Balance hasn’t always matched their superiority (most recently failing to do so in 2019), but it has much more in recent times, especially 2023/24 in the three-way title race that went their way on the back of some terrible officiating blunders and they got a remarkable Foul Balance.
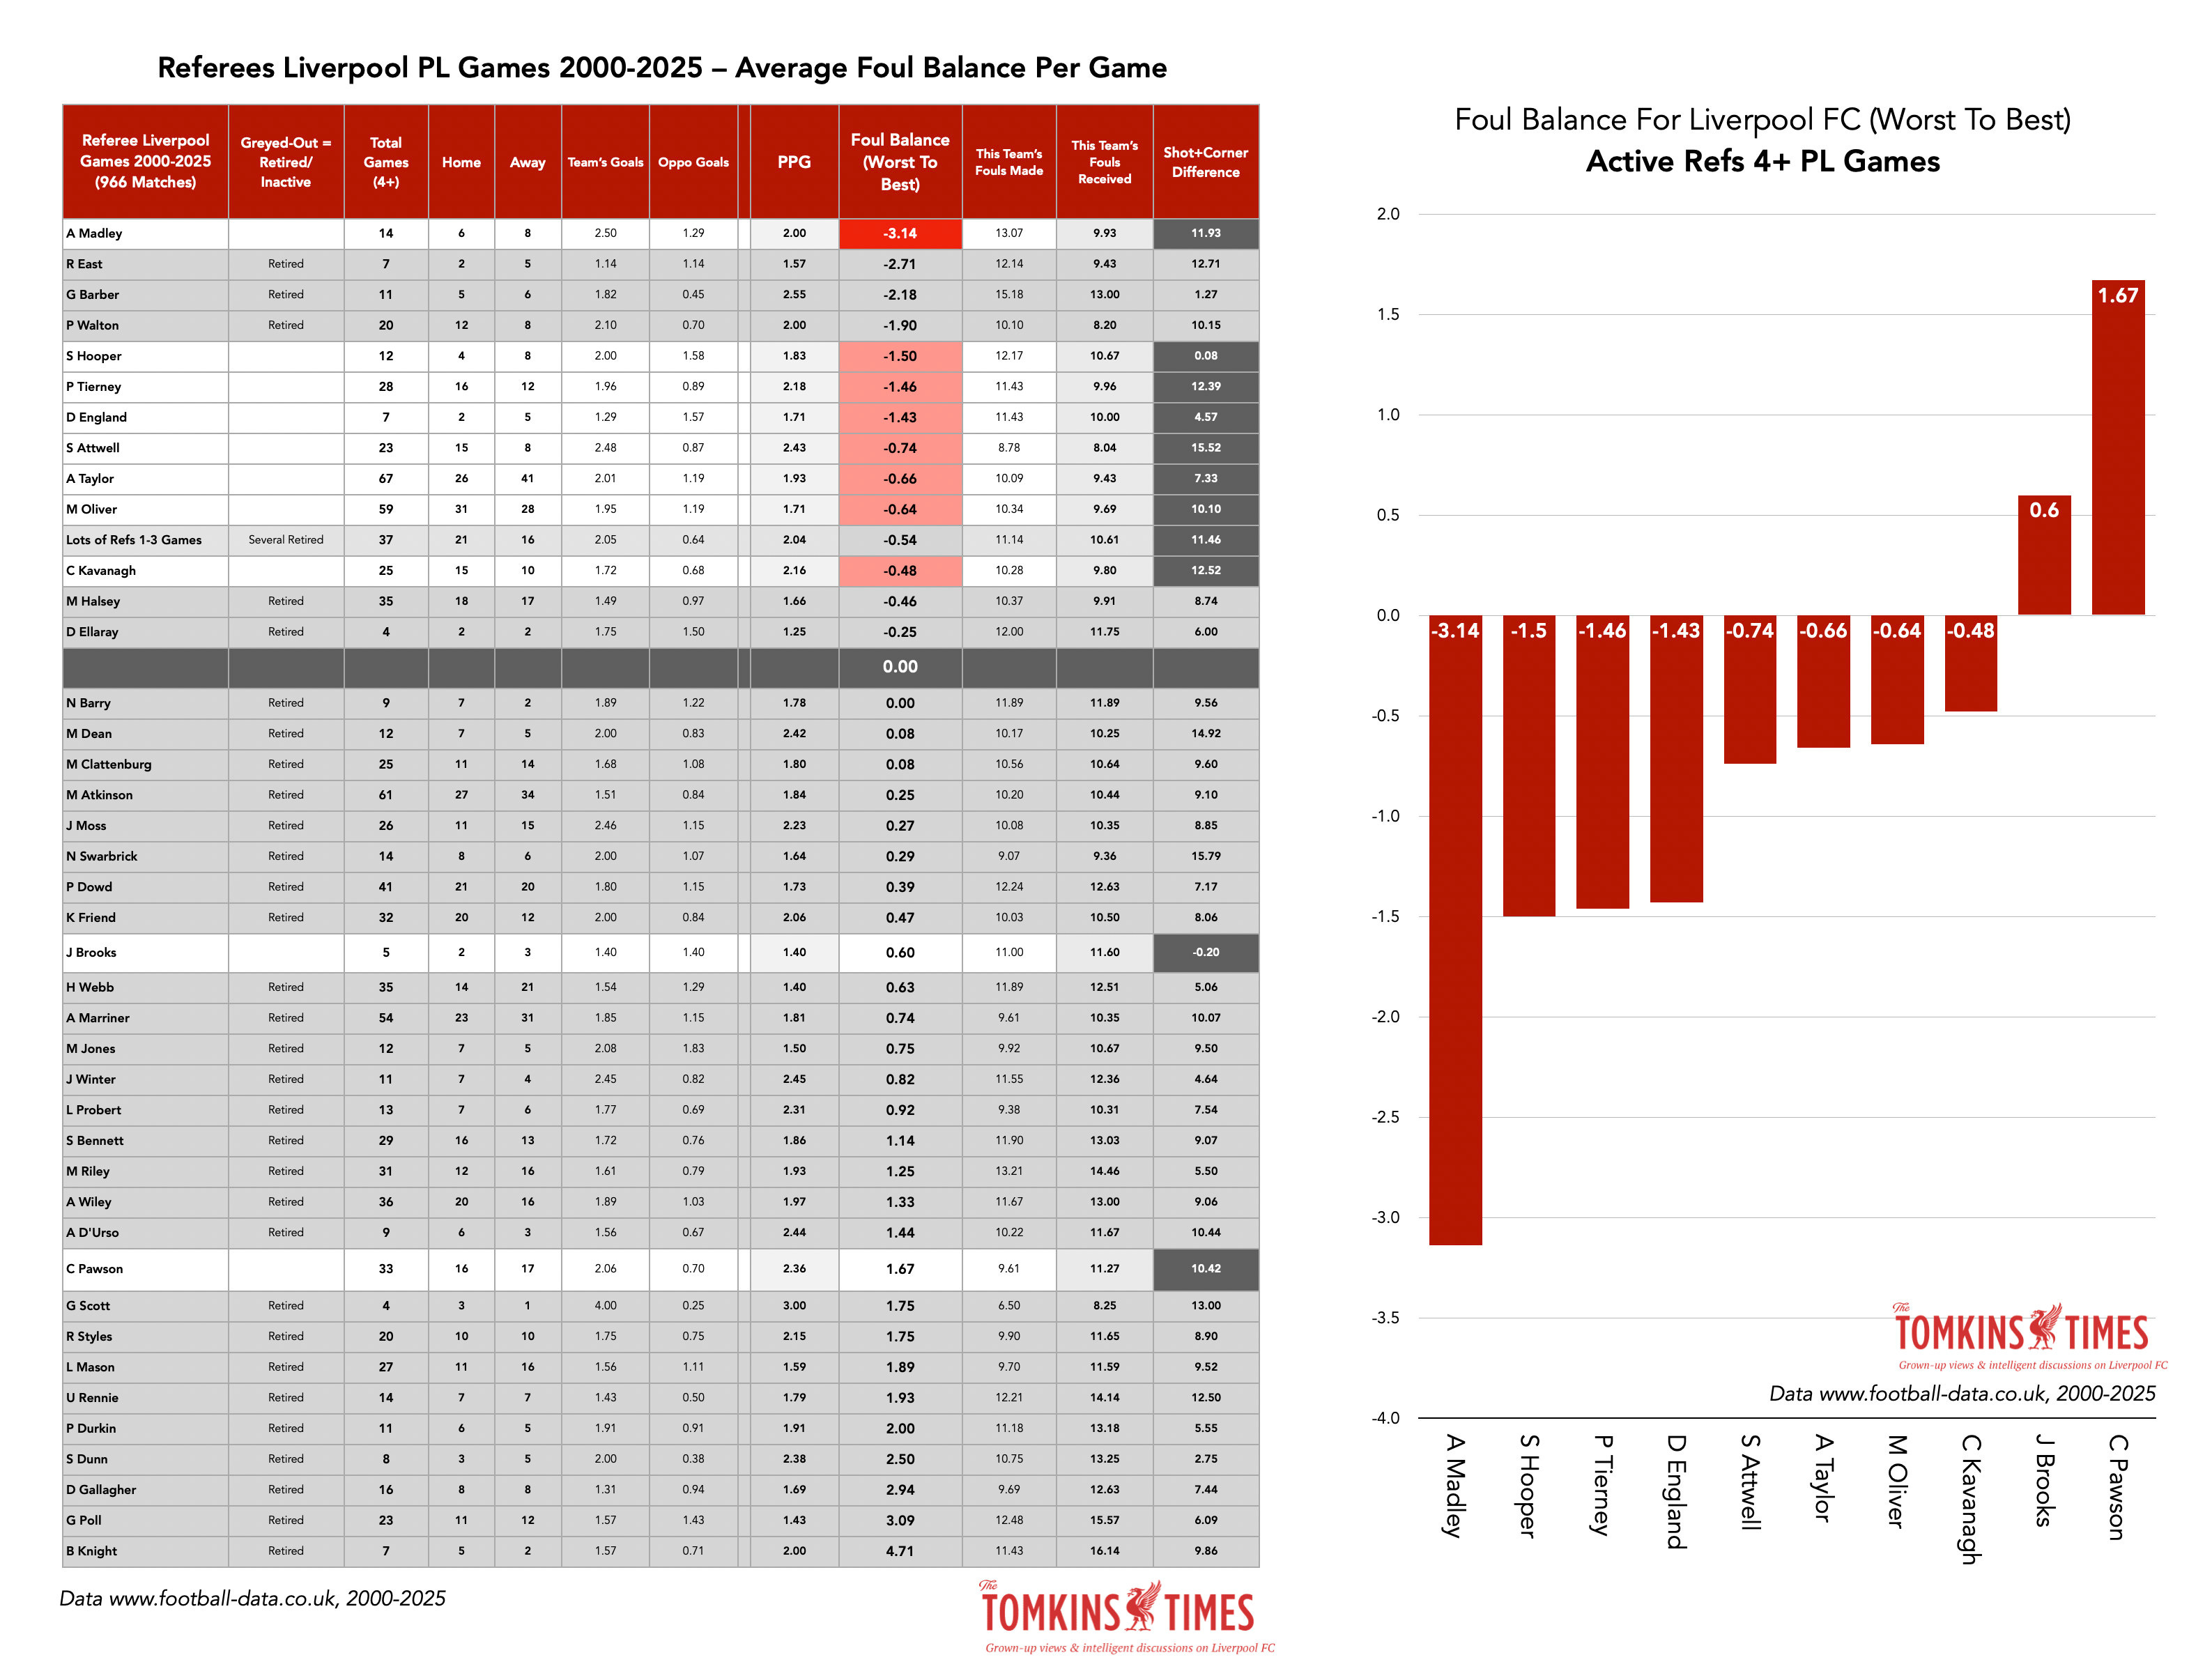
Andy Madley is a horrible, horrible referee for Liverpool; twice as bad as anyone else bar David Coote, who only did three games. We now know Coote’s gripe, we can guess at the gripes of Tierney and Brooks (with Klopp), but what about Madley?
I predicted against Nottingham Forest that Madley would give a bad Foul Balance to the Reds of around -3, as his average, and he did. He gave the Reds only eight free-kicks against a very physical side, and 11 to Forest. Bang-on. I then predicted Craig Pawson would give the Reds a better Foul Balance against Brighton, and he did. I feared Attwell against Sunderland, and he was terrible. I said Brooks might be okay at Spurs, and he was. I feared Chris Kavanagh against Leeds, and I was right to. I correctly predict this shit every week now.
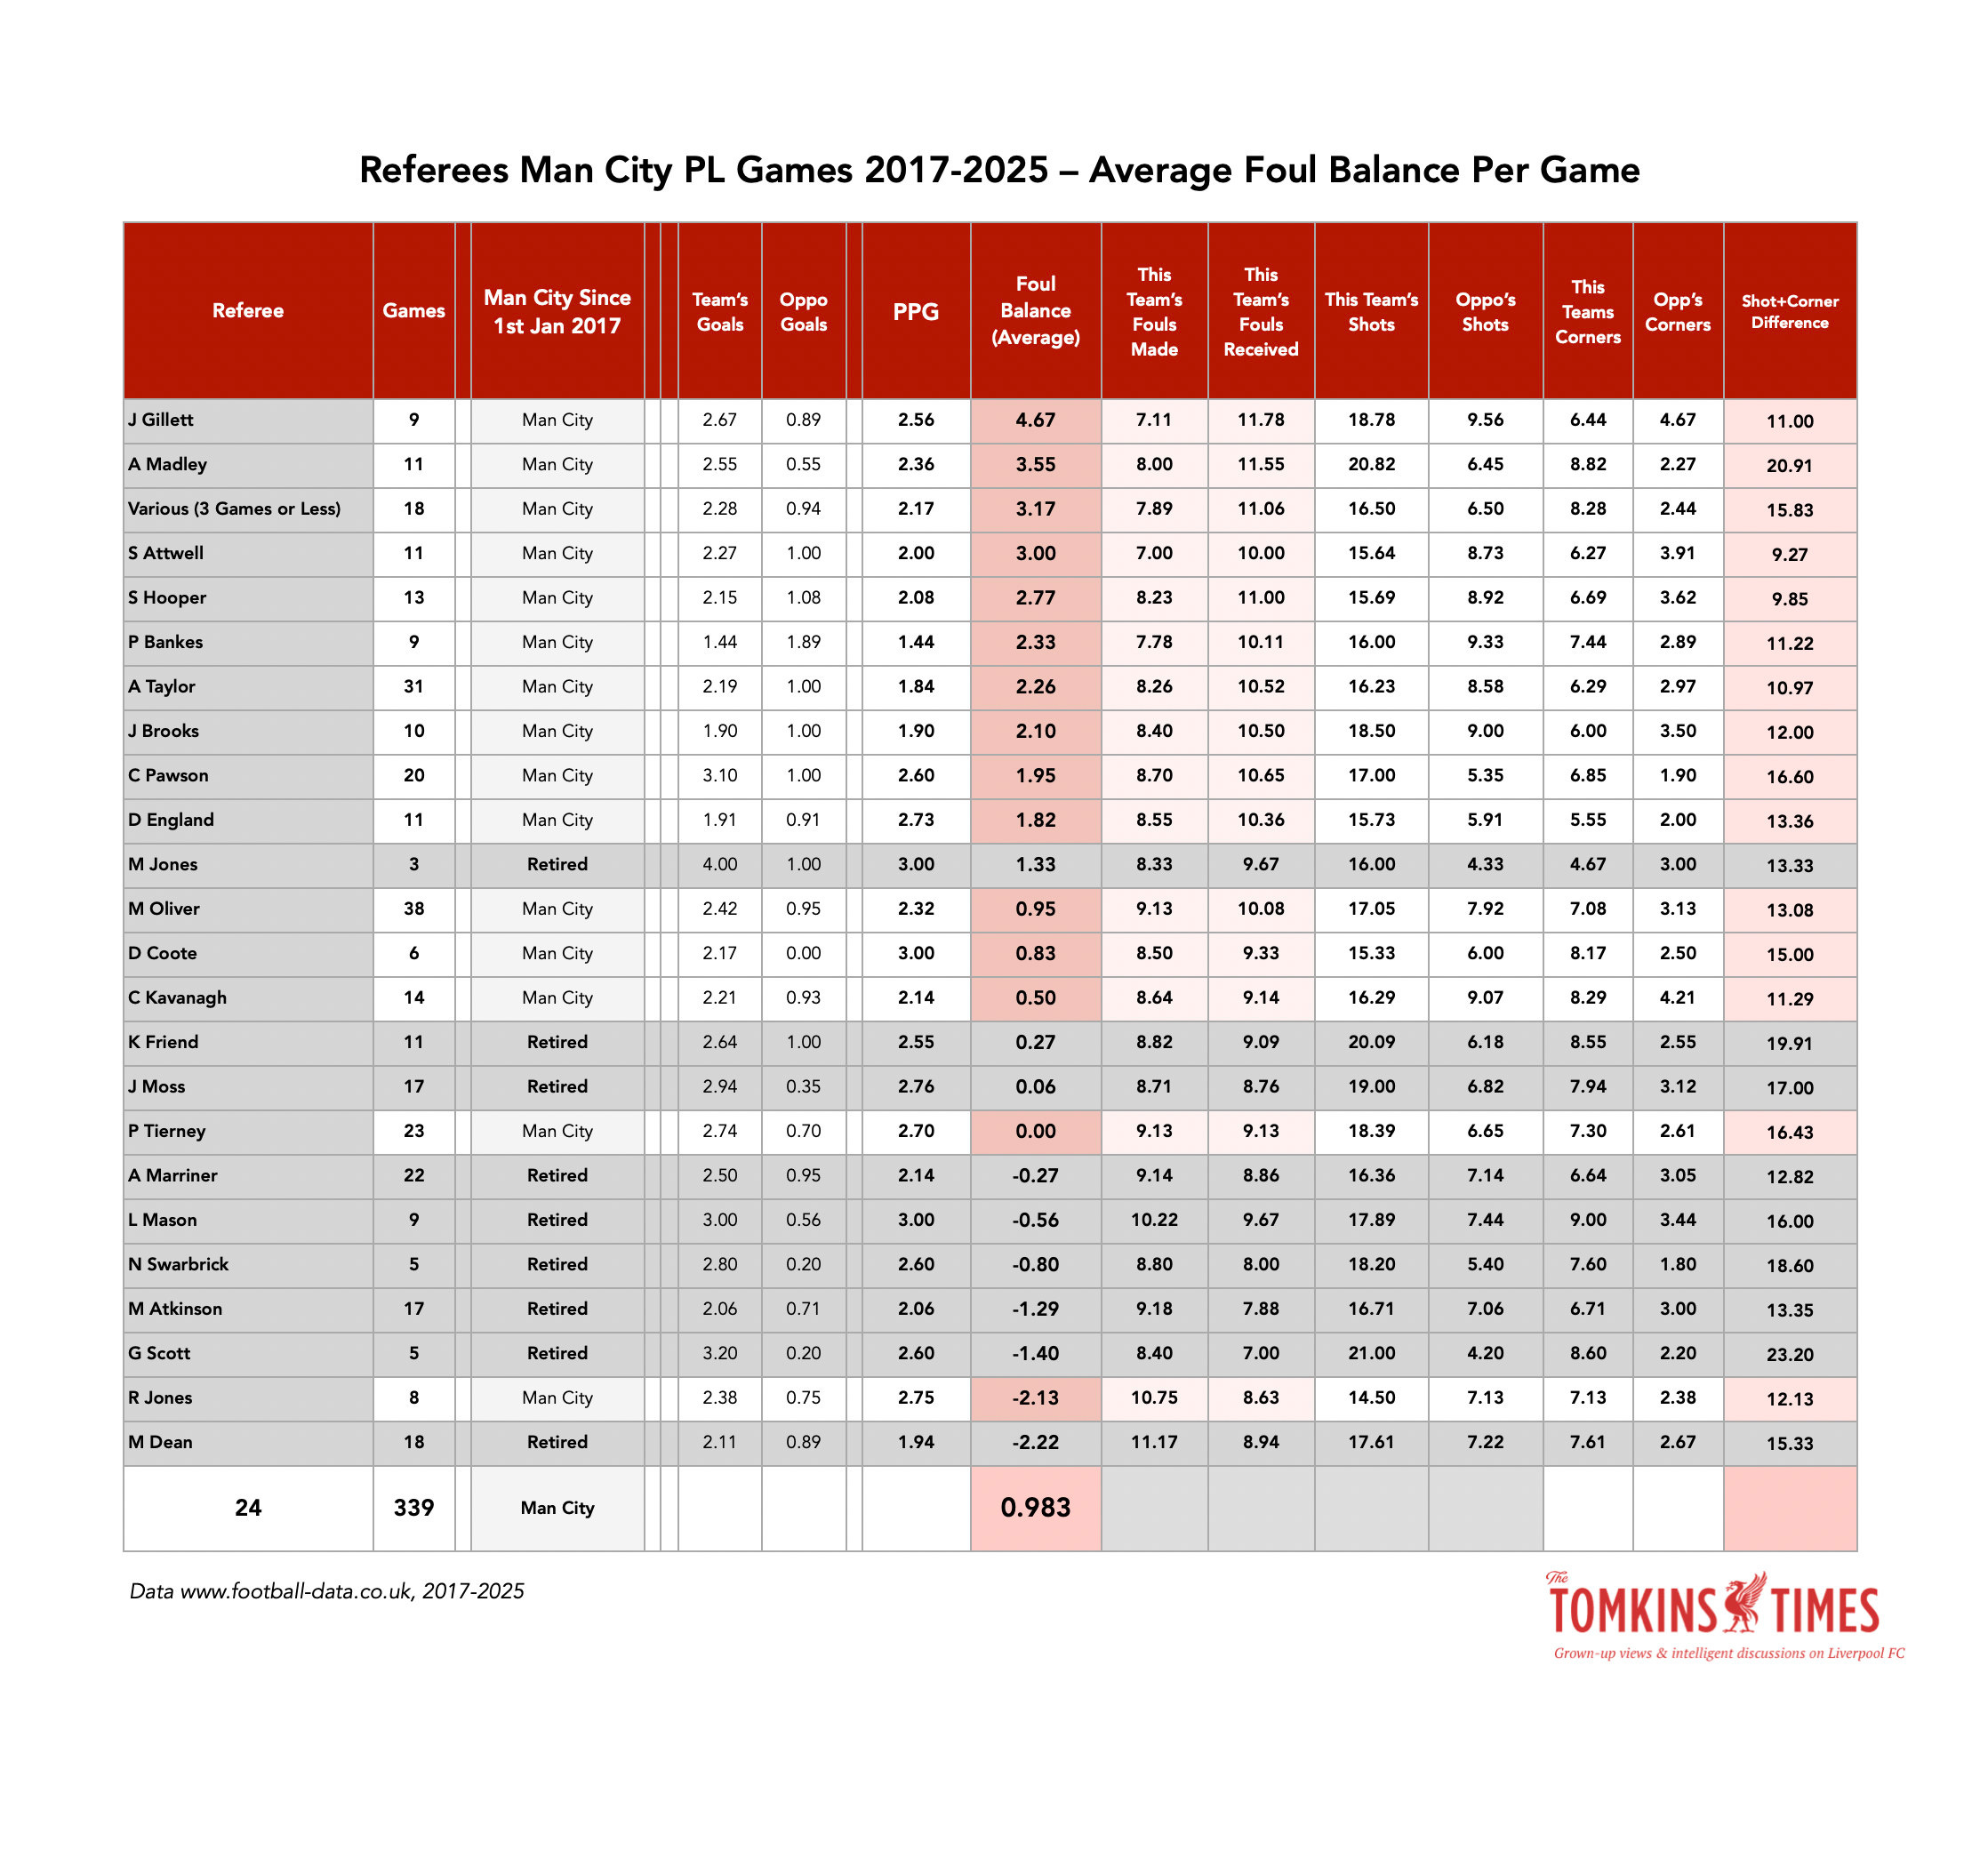
By contrast, Man City only have one ref who always penalises them a lot: Liverpudlian Robert Jones (who Forest have just accused of favouring Man City; the data suggests the opposite). But two of the most generous refs to City are the Liverpool-connected Jarred Gillett (hugely so) and Peter Bankes.
Craig Pawson’s data seems normal for both Liverpool and Man City. This makes him the only ref to do so.
Yet Andy Madley is terrible for Liverpool, great to Man City. What explains this?
Ah, Madley was criticised by Jürgen Klopp in 2022 when Klopp phoned Jon Moss, Madley’s boss, to chastise the ref for blocking the passing lanes the whole match on the opening day against Fulham. Moss, speaking to The Athletic, used it as a source of pride, saying how the PGMOL learnt from Klopp’s pointers, but all it seems to have done is turn Madley into someone who fails to referee Liverpool properly.
This was reported at the time of Klopp forcing the PGMOL to be kinder to Liverpool, but all it did in truth was make things worse. Don’t believe me? Check the data!
Andy Madley should not do Liverpool games, and Robert Jones should not do Man City games. I would list various others, but what’s the fucking point?! Those two are the biggest outliers against each club. Liverpool have no massive outliers in favour of them, but City and other clubs do. City’s includes Madley.
Michael Oliver used to clearly skew towards Liverpool and away from Man City (as the only ref who did so, including for years being the only ref to give Liverpool a normal number of penalties), but a rabid backlash against Oliver, along with his beloved Newcastle becoming Liverpool’s rivals, and also with lucrative trips to Saudi and Dubai, have seen Oliver become a bad ref and VAR for the Reds to have.
Oliver admitted he was not allowed to do Newcastle’s rivals in a relegation battle, but it’s been fine when in a Champions League-spot battle. The issue with Oliver is that he’s a true die-hard fan, not just someone who casually supports them. He seems objectively much worse these days.
While Liverpool have three of the five most illogical Foul Balances in the near 10,000-game sample of all teams since the days of dial-up internet, the worst is Michael Oliver in 2019, when City dominated Spurs to a ludicrous degree yet heavily lost the Foul Balance; however, this was ‘only’ a -12 Foul Balance, so not as extreme in that sense as Coote’s -14 against Liverpool in similar circumstances.
Remember, over time, bad Foul Balances cost points.
Put big money, if you have it, on Aston Villa to win a ton of fouls every game and to win the foul balance; don’t ask me why they do, but they do. (Nothing against Villa, as my granddad was on their books after he did three years in the trenches in WWI, albeit never played a game.)
Ditto on Liverpool to lose the Foul Balance, or to win a weirdly low number of free-kicks.
While this pattern is mostly confined to the Klopp and post-Klopp era, it happened before.
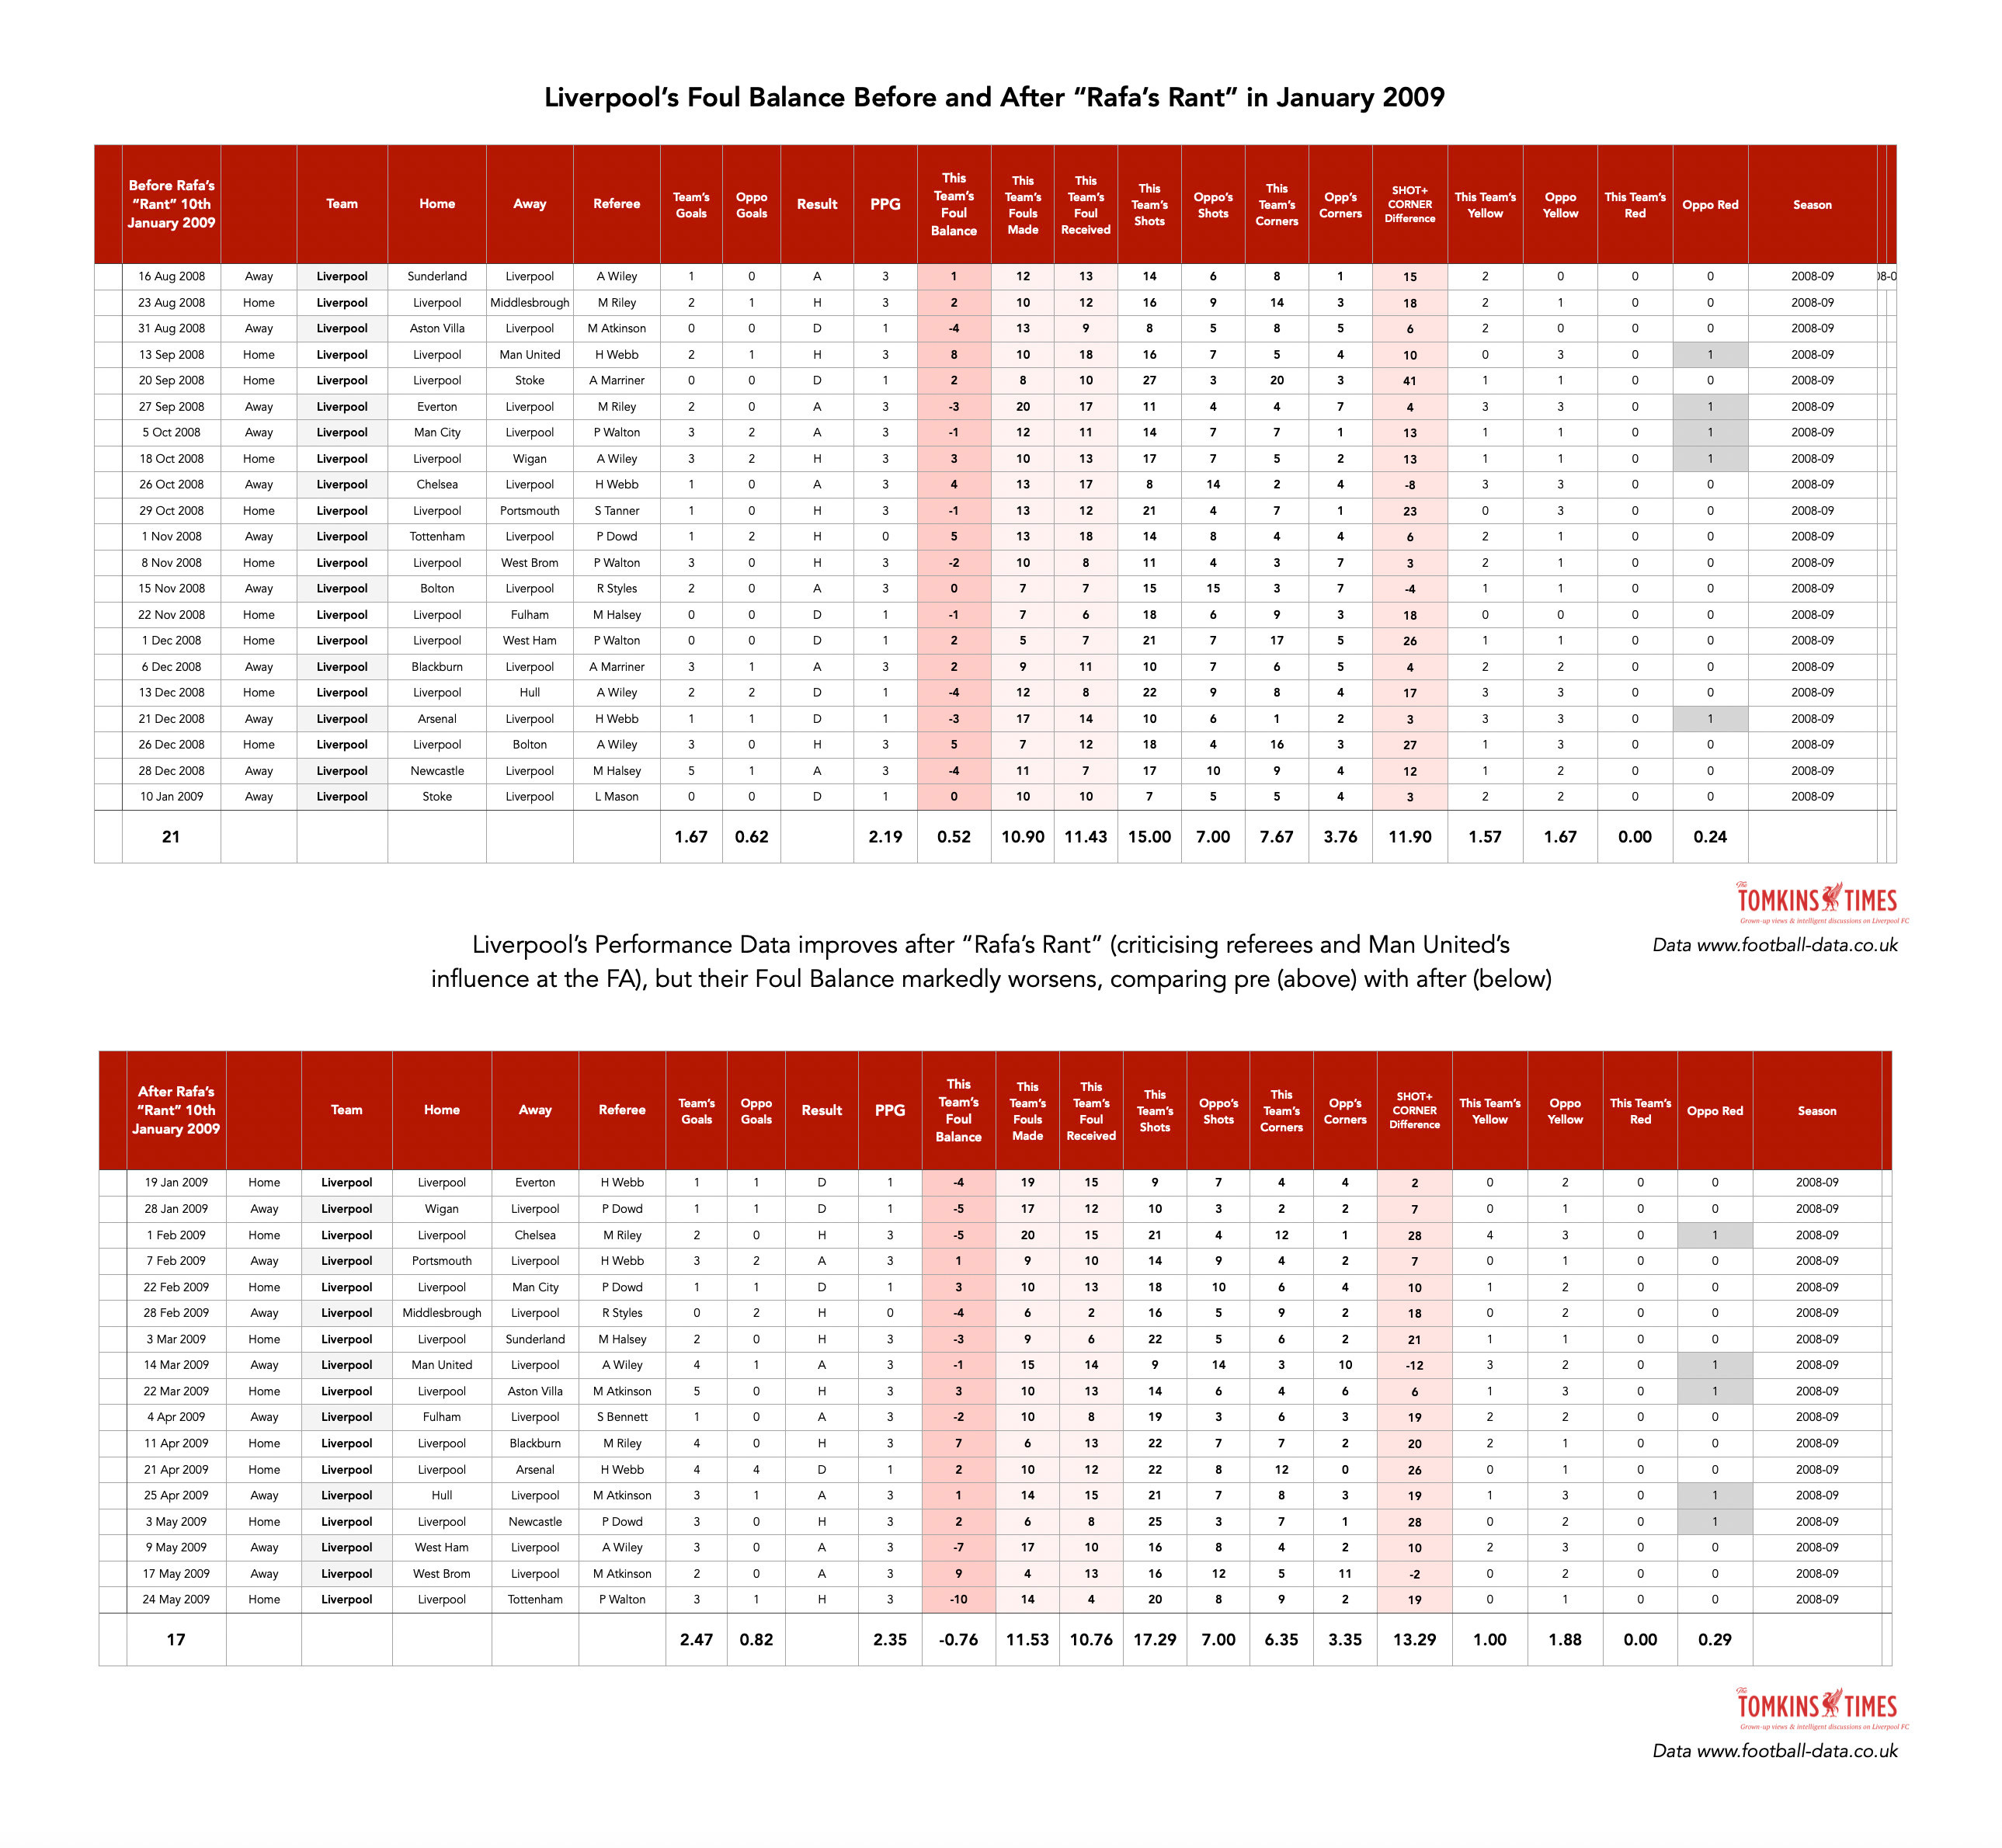
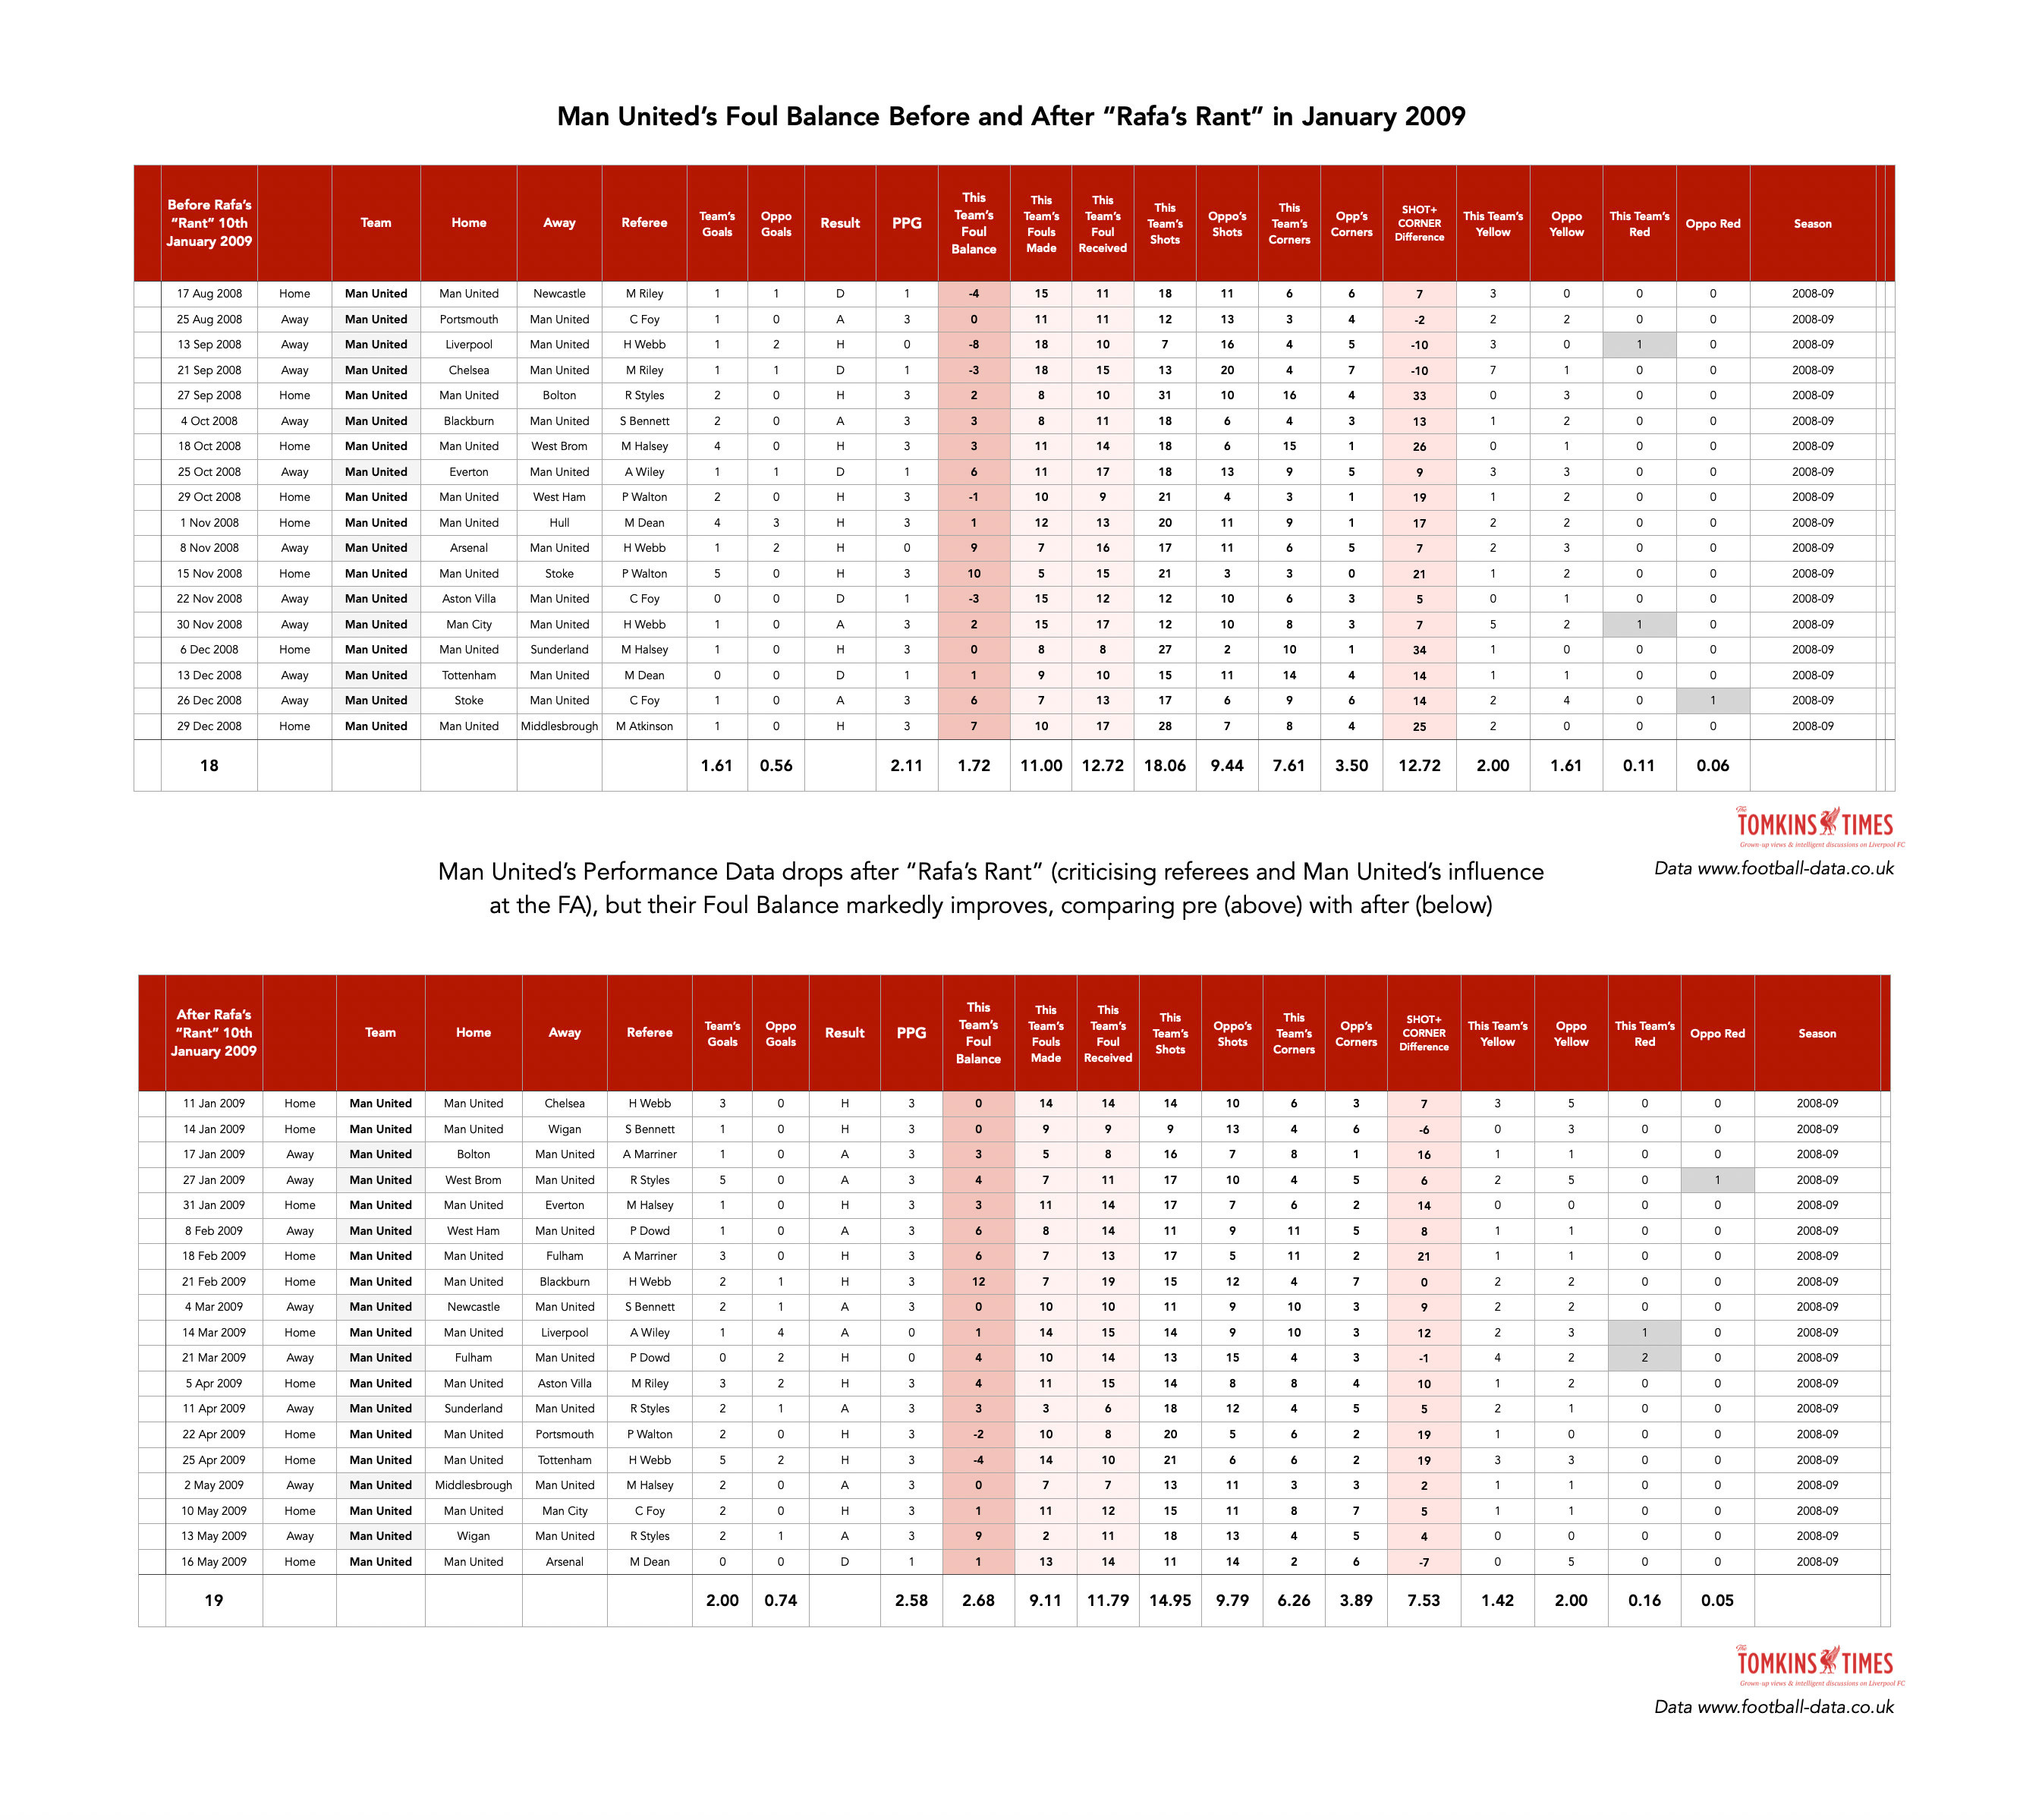
In January 2009, immediately after Rafa Benítez criticised the FA and its Manchester United’s connections regarding officials, Liverpool’s Foul Balance tanked and Man United’s shot up; despite Liverpool’s match-data getting better in the run-in and United’s getting worse.
🤷♂️
(As with all of the other data, how much is coincidence? Some may be, but it’s unlikely it all can be. All I can do is point out all the weirdness, where that weirdness may be beyond coincidental.)
Almost all of the referees since 2000 who gave Liverpool a positive Foul Balance on average have retired.
Meanwhile, for Man City, most are still active.
This is true of City since 2017 too, when they became the best side in the country (and have the best performance data, slightly ahead of Liverpool, since 2017, with the two the standout sides in that time, obviously).
City are officiated as if a top team; Liverpool officiated like they are relegation fodder.
The lack of fouls can be seen in how VARs do not give Liverpool foul penalties (see yesterday’s article linked below).

All this data surely cannot be accidental or coincidental. I’ve even surprised myself when finding much of this stuff out.
Some fear/peer-based officiating that can be most clearly seen whenever the opposition fans sing “the referee’s a Scouser” or “who’s the Scouser in the black”, often at Anfield, and the ref will instantly stop giving the Reds decisions to an almost hilarious degree. (Someone needs to go and track that! And it’s not truly funny, just maddening.)
New refs are especially bad to Liverpool and even more so at Anfield, as if briefed to not listen to the Kop, and thus ignore all legitimate appeals. Darren Bond did Liverpool Leicester as his first game last season, and it was -14 against the Reds – one of the five of the most outlying displays by a ref in the 9,960 game sample.
More weird shit happens with refs at the Kop-end. This is mostly anecdotal, but something I’ve loosely tracked for about a decade. As if refs know they will be pilloried for giving Liverpool something at home, and even more so if it can be said they were swayed by the Kop (which is hardly the baying crowd of the 1970s!).
Memes like #LiVARpool and rival fan paranoia based not on data but confirmation bias or the availability heuristic warp the conversation, and pundits back the underdogs when the favourite is Liverpool (as has also happened to Man United, and to a lesser degree, Arsenal, albeit Arsenal’s approach has been more direct and physical than Liverpool’s).
The meme should be #NeVARpool, when it comes to foul penalties, and any subjective VAR decision before the first third of the match has been played.
While penalties shape results massively, Foul Balance does so to a lesser degree but more frequently. Both add up.
The baying mob has altered all forms of culture, sport and politics. People come for you online and organisations and individuals cave in. (But only if they care about the opinions of those coming for them.)
For Liverpool, there are no neutrals. You either support Liverpool or you oppose them. Ditto Man United.
Liverpool got a lot of early VAR decisions for offsides with the ultra-high line in 2019, and that set the narrative. Now it’s confirmation bias all the way.
If Liverpool do get a penalty from a VAR, it’s likely to be handball; often bloody obvious ones, too.
Obviously I’m biased, but is the data?
As a Liverpool fan, you can simply compare to when the Reds were treated better – or normally? – by the refs. You can have sympathy for Klopp and now Slot, and what they have faced.
There is loads more I haven’t been able to cover, but this is as comprehensive as I can make it without going into full TL;DR territory, and where, any shorter, there would be accusations of flimsiness or lack of evidence.
(Any errors I will edit and mark with the word ‘edit’. I may also add anything I have forgotten to include.)
I apologise in advance for anything not covered, but equally, I think it’s the best I can do. It’s both too much, and yet, never enough.
Please read it all and study all graphs and data before countering what I’ve said. My aim is to see fair officiating, that makes sense across the board.
So, before the data, a bit more on David Coote.
More On David Coote
Before getting onto the graphs and data and other stuff, a bit more depth on David Coote, who remains the most suspicious of all referees, for so many reasons.
I’m curious if the PGMOL had any suspicions given that he was accused of having indecent images of a minor many years ago (and nothing was found at the time, but history tells us it was now probably likely), as well as other issues.
Why was he brought back to do Liverpool games after three years of being kept away, and brought back at vital times, given how he’d done in previous games? Did they know how much he despised Jürgen Klopp? It can’t have been a secret, surely?
Aside from being convicted of having images of underage boys (sentencing next week) and potentially having an expensive drug habit, the suspicions I have purely from the data include:
The timing and distribution of his Foul Penalty awards as a VAR are highly irregular.
The escalation of his extreme Foul Balances within games was even more highly irregular, tying in with Euro 2024 and the “cocaine” video.
Both could be suggestive of trying to push a result in a certain direction.
And while the previous indecent images of a minor charge was not upheld, the recent one saw him change his lying plea from innocent to guilty; so is the same true of his betting/match-fixing?
“Allegedly, Coote had prearranged to hand out a yellow card during the Championship game between Leeds United and West Brom in October 2019, in order to benefit a friend through betting. Coote denied any wrongdoing.”
Yellow cards are easy to track – something refs may be wise to – as they’ve been a betting staple for years, but Foul Balances and early VAR overturns (before you even knew who the VAR was) seem less overt.
I think I’m the only person to deeply investigate Foul Balances (but please, some go and do the same with the data!)
Via the VAR data (ESPN and Squawka) I can only track VAR decisions given; just as nowhere lists the thousands of decisions not given over a long period of time. These leave no lasting trace, beyond video and anecdotes, that may not be timestamped.
As an aside, I did previously list all of the “too early for Liverpool” incidents in the article below, just to show how many things were inexplicably not given, and since then we’ve had the Ekitiké non-penalty to add to the list, and the non-red card for Brighton’s Gomez (first half, Kop-end).
See the article below for photographic evidence and lots more data:

In total, Coote reffed 112 Premier League games, and was VAR on a further 110.
Just after Coote was suspended (so including games up to 9th December 2024), Paul Tierney had been VAR on 163 occasions, Stuart Attwell 158, Peter Bankes 135, Jarred Gillett 135, Chris Kavanagh 115, and just behind Coote’s 110, Darren England with 107. So he wasn’t one of the super-VARs, and more mid-ranking on number of appointments.
(Tierney, who fell out badly with Klopp, has VARred Liverpool about 40 times and never given any kind of subjective overturn; but four against, three for Manchester clubs, two of them inexplicable. Again, coincidence?! Several of the officials cannot do Liverpool games yet this does not seem to apply to Manchester officials?)
Of those, many have now been VAR plenty more since early December 2024; John Brooks was on 93 at the time, Simon Hooper 82. Darren England has no surpassed Coote’s tally. (After England sent of Curtis Jones at Spurs for a good tackle where his foot rolled over the ball, and incorrectly ruled out Luis Díaz’s key goal in the same game, the media and pundit narrative was that he mustn’t be allowed to even things up for Liverpool; and so, of course, he hasn’t. He’s given the Reds fuck-all.)
But anyway, back to Coote.
My study into foul rates, Foul Balances, and the ways referee administer such decisions, led me to look again at VAR-awarded fouls.
Offsides are mostly objective, handballs can be messy, but foul penalties are interesting. What makes a VAR award them? It often seems arbitrary.
As with Foul Balances, Coote is a total outlier.
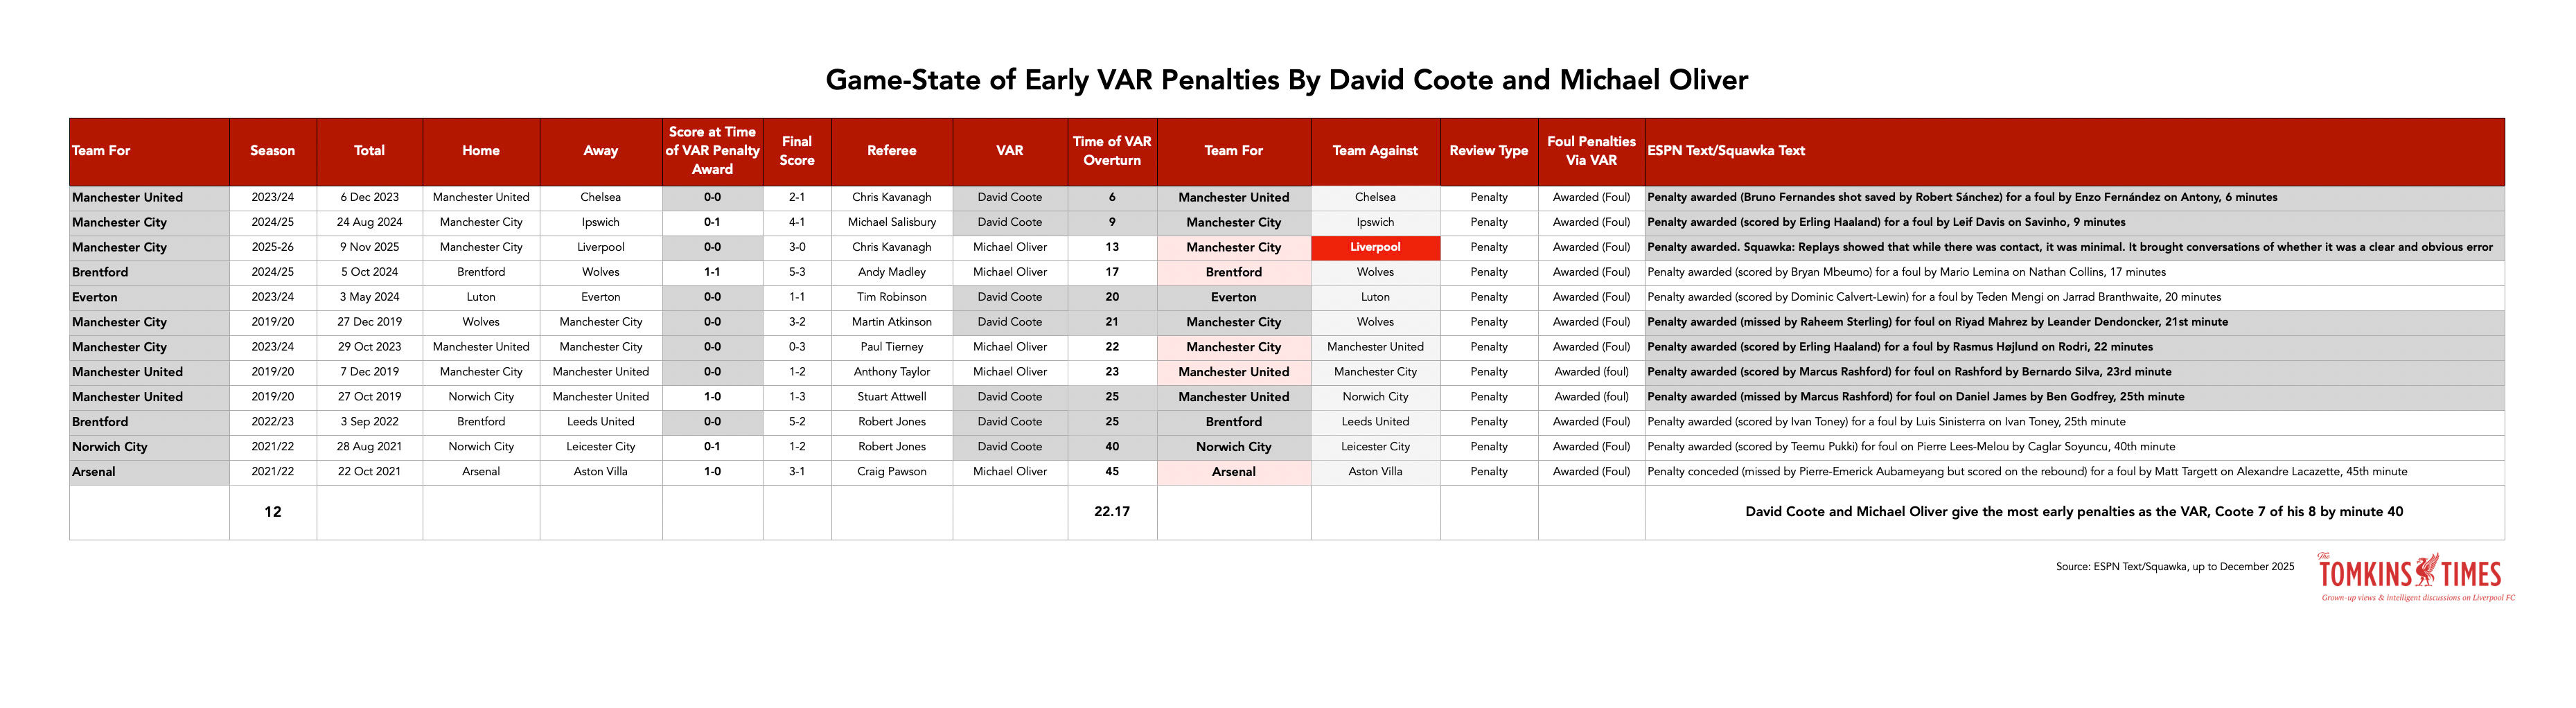
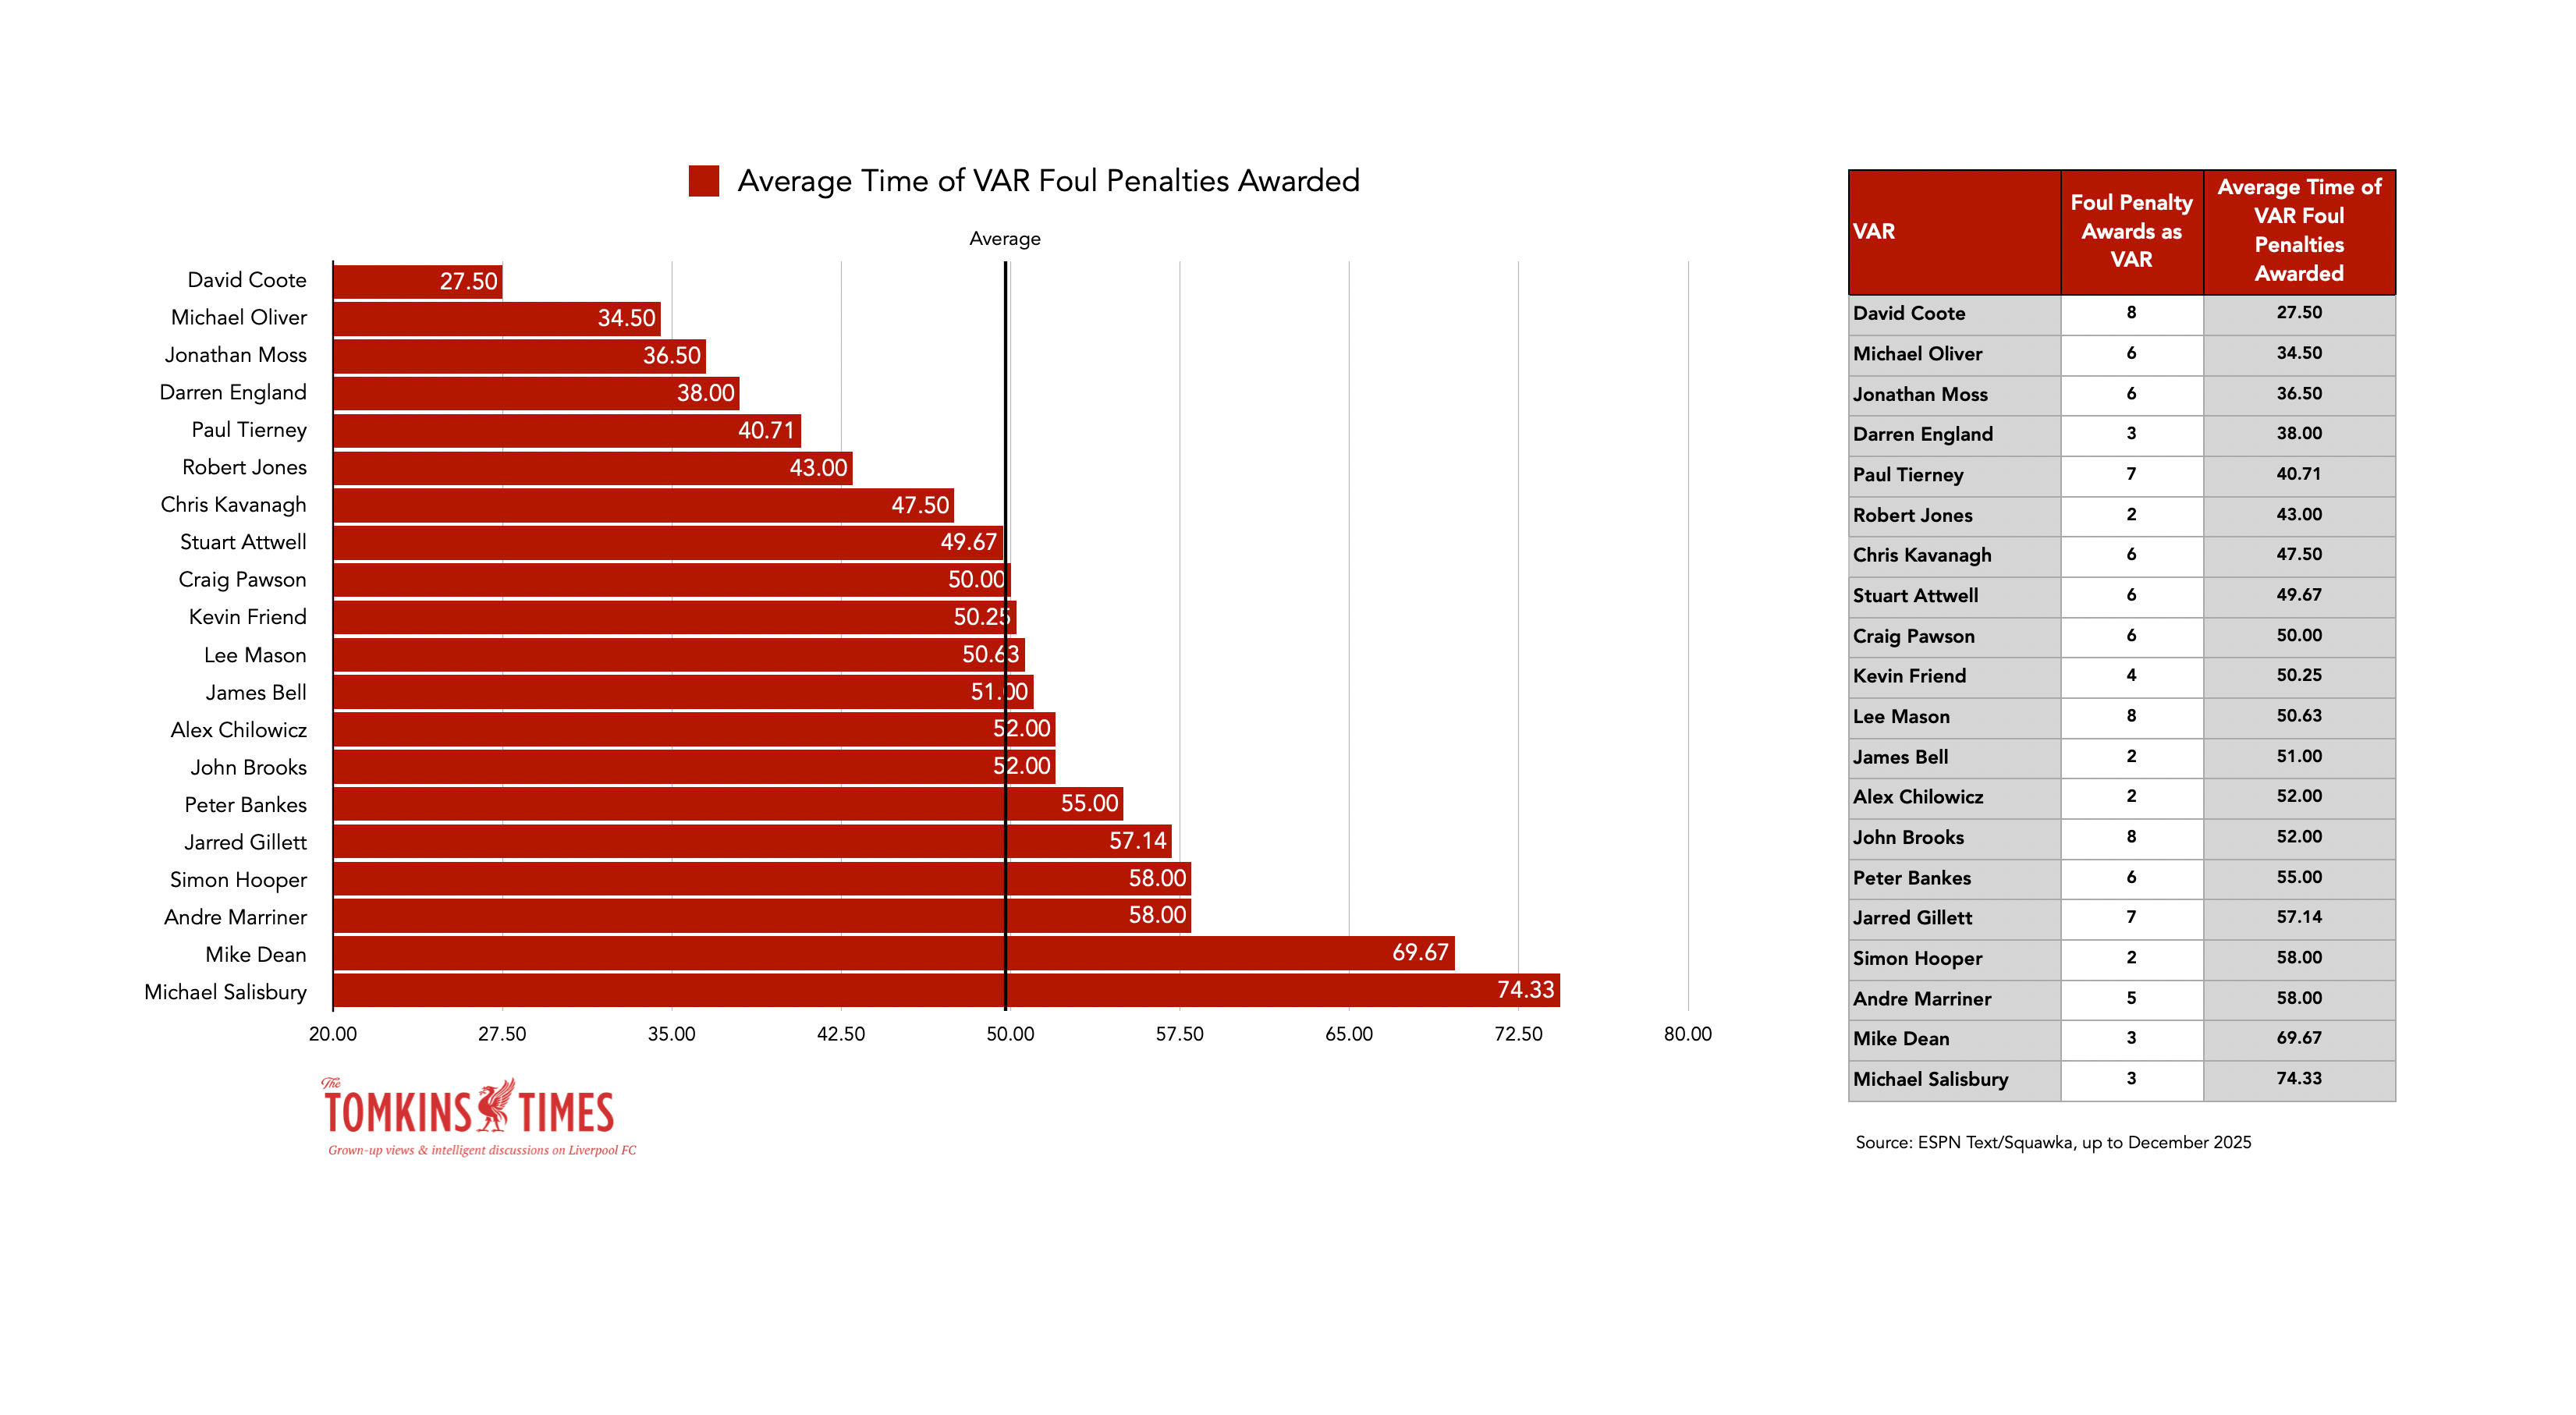
He awarded the joint-most Foul Penalties as a VAR – in total, eight, in 110 games.
3 Sep 2022 David Coote, 25th min, Brentford
3 May 2024 David Coote, 20th min, Everton
24 Aug 2024 David Coote, 9th min, Manchester City
27 Dec 2019 David Coote, 21st min, Manchester City
6 Dec 2023 David Coote, 6th min, Manchester United
27 Oct 2019 David Coote, 25th min, Manchester United
30 Mar 2024 David Coote, 74th min, Newcastle
28 Aug 2021 David Coote, 40th min, Norwich City
John Brooks and Lee Mason also awarded eight. (Other VARs average 1-6.)
Lee Mason, who once tried to give a penalty against Fabinho for a normal tackle in the box that won the ball (the referee on pitch did a rare thing and stuck with his original decision as Mason appeared to be off his tits on something) had done 95 games as a VAR before, “18 Feb 2023 — Lee Mason: Video Assistant Referee leaves PGMOL and will no longer work on Premier League games after error cost Arsenal vs Brentford.”
Coote was mid-range for number of games as a VAR (he was VAR on c.5% of all games), but slightly more than Mason before both left the PGMOL, while Brooks has now done a lot more games.
So, some stats and facts on Coote:
Fully half of Coote’s foul penalties as a VAR went to Manchester clubs, having spent years working for the Manchester FA in the mid-2010s.
Coote gave each Manchester club an early penalty in games, comprising two of the five earliest ever in terms of match-minute.
He did the same for the same two Manchester clubs in terms of the chronological ‘earliness’ of games in the very first VAR season, with Coote awarding two of the first seven foul penalties ever awarded by VARs in the Premier League.
The eight penalties Coote’s awarded for fouls average an incredibly early time of just 27.5 minutes, meaning each was much earlier than the average of 48.30 overall.
27.5 minutes is earlier than any single subjective VAR decision Liverpool have received in 247 games (the 28th minute – Coote ironically, but in a dead-rubber final game of the season when it was easy to slip one in, to cover his tracks, perhaps.)
The earliness of the times suggests games that were close at the point of invention; if anything, most officials avoid early decisions, as we know (and with Liverpool especially), as they know it can have an outsized influence on the result.
This is why the average for all other VARs is 50 minutes (removing his eight), when not including added time to the first half. Everything skews slightly later, normally.
Also, anyone can bet on the first scorer, and a VAR would know who is likely to take an early penalty that could open the scoring.
Of the 20 VARs to have awarded at least two foul penalties, Coote is a reasonable distance away from everyone else in terms of how early his interventions were. Only one ref is remotely close. (Michael Oliver.)
Seven of Coote’s eight foul penalties were awarded by the 40th minute, which also seems odd.
His four for the Manchester clubs happened more or less within the first quarter of the match, give or take a minute or two.
That he worked for the Manchester FA for many years makes this at least worthy of investigation, as to who he might have potentially tipped off, even if he didn’t support either Manchester club. The Manchester FA was based at the old Man City training ground and then moved to the Etihad Campus, which again, makes it notable. It’s hardly conspiratorial to tie outlying data with a close working proximity.
David Coote 6th minute for Manchester United
David Coote 9th minute for Manchester City
David Coote 21st minute for Manchester City
David Coote 25th minute for Manchester United
(Liverpool’s earliest foul penalty from the VAR remains the 85th minute, remember; and the Reds’ second, and only other VAR foul penalty, in the 86th minute, both with Liverpool already ahead. Neither altered the outcome. And again, Liverpool haven’t had a penalty of any kind earlier than 15 minutes with fans in the ground since the start of 2015, or over 350 games.)
Of the 25 VAR foul penalties awarded by the 25th minute of all games, Coote awarded six, or 24%.
Next comes Michael Oliver with four, Jonathan Moss with three, and no one else has more than two.
Of the 10 early penalties given as a VAR by Coote and Oliver – the two who skew earliest in games – seven went to Manchester clubs; three to United and four to City.
Michael Oliver, 13th min, Manchester City
Michael Oliver, 17th min, Brentford
Michael Oliver, 22nd min, Manchester City
Michael Oliver, 23rd min, Manchester United
(City get a lot of early penalties as I’ve shown before, and that may be legitimate as they’re a top team; what is not is Liverpool’s lack of them with so many stonewallers in that time.)
Four of Coote’s seven early penalties awards as the VAR were with the score at 0-0, one with the home team 1-0 up (Man United) and two with the home team 1-0 down (Norwich vs Leicester, and Man City, two minutes after surprisingly going 1-0 down against Ipswich last season).
After 47 games as a VAR, Coote only awarded only two foul penalties, both to Manchester clubs.
Despite his clearly known connections to the Manchester FA, eight of his first 18 VAR appointments were to do Manchester clubs. This seems very trusting of the PGMOL.
(Not included is when he gave Manchester United a goal when Divock Origi was clearly fouled from behind in the build-up; no intervention back in 2019. So that’s not even in the data, as with his failure to send off Jordan Pickford and all the other inexplicable failures.)
No foul penalties were awarded by Coote between his 12th and 46th game as a VAR. But then he gets going again.
Just either side of Euro 2024, where the videos of apparent cocaine use were shared, he gave a very early penalty on May 3rd 2024, and then again on 24th August 2024 (to Man City when 1-0 down to Ipswich after nine minutes).
He’s suddenly ramping up his interventions, just after his ridiculous Foul Balance in the March 2024 Liverpool vs Brighton game. Between 2022 and 2024, Coote’s data gets more extreme across the board. (See data in Appendix.)
Remember that these early penalties may be valid, but Coote comprises a big chunk of early-given VAR penalties. (And remember how some clubs, like Liverpool, will not get early penalties at all, via refs or VARs.)
Remember, the PGMOL and ex-refs defended David Coote’s integrity very publicly a year ago.
So?
All individual decisions (and lack thereof) in the full 9,960 games covered by this study cannot be adjudged on their merit, just the statistical probability.
One clear indicator of the problem is that Sky Sports did not even show a replay of the Díaz goal wrongly chalked off at Spurs, even though it was the biggest talking point of the month, let alone the day; which backs up the otherwise odious Richard Keys’ claim that they were told not to focus on officiating mistakes.
Sky were unhappy with losing 10% of viewers when Liverpool won the league, and the “product” is perhaps seen as protected by favouring the underdog across the media as a whole. Liverpool and Manchester United are seen as the establishment. TV companies want to show them, but ideally show them losing. Their narratives work against these clubs who remain the most hated according to polls.
The PGMOL use various post-hoc explanations on decisions that change when challenged. They use the media to pretend to be transparent. They silence critical ex-refs. Keith Hackett, who once led the PGMOL, is scathing most weeks.
Refs used to be naturally intimidated by crowds, but now bow to social media and other online rage, and the television narrative. The PGMOL tells its officials not to make themselves the story, but this leads to ‘crimes’ of omission. (Don’t give anything to Liverpool, for example, as people will get angry; and they do.)
Most corruption often starts as incompetence, but in covering up incompetence and bias, proper corruption occurs.
Coincidences also occur, of course – but data is often used to spot suspicious patterns in all walks of life, that then need following up on.
Some readers may be much better statisticians than me, but I’ve tried to use logic, averages, frequencies and r2 correlations.
I have drawn some subjective conclusions as noted above, but mostly let the data tell the story. More of that data is below.
Feel free to pore over it and make of it what you will.
The Data and the Graphs
The following are a whole host of charts, tables and graphs that cover what I’ve discussed above. It’s only the tip of the iceberg, but I don’t want to spend the rest of my life in a mental Arctic Circle.
Some of the data in the graphs I haven’t included in the facts above, as there’s just too much. With some of the graphs I’ve included some further explanations.
These are the numbers in the sample:
9,660 games.
14,848 goals by the home teams.
11,434 goals by the away teams.
131,446 shots by the home teams.
104,347 shots by the away teams.
108,939 fouls by the home teams.
113,638 fouls by the away teams.
58,209 corners by the home teams.
46,037 corners by the away teams.
Foul Balance Correlations
Liverpool are the only major team, as can be seen below, where the Foul Balance remains in the red in all three levels of domination.
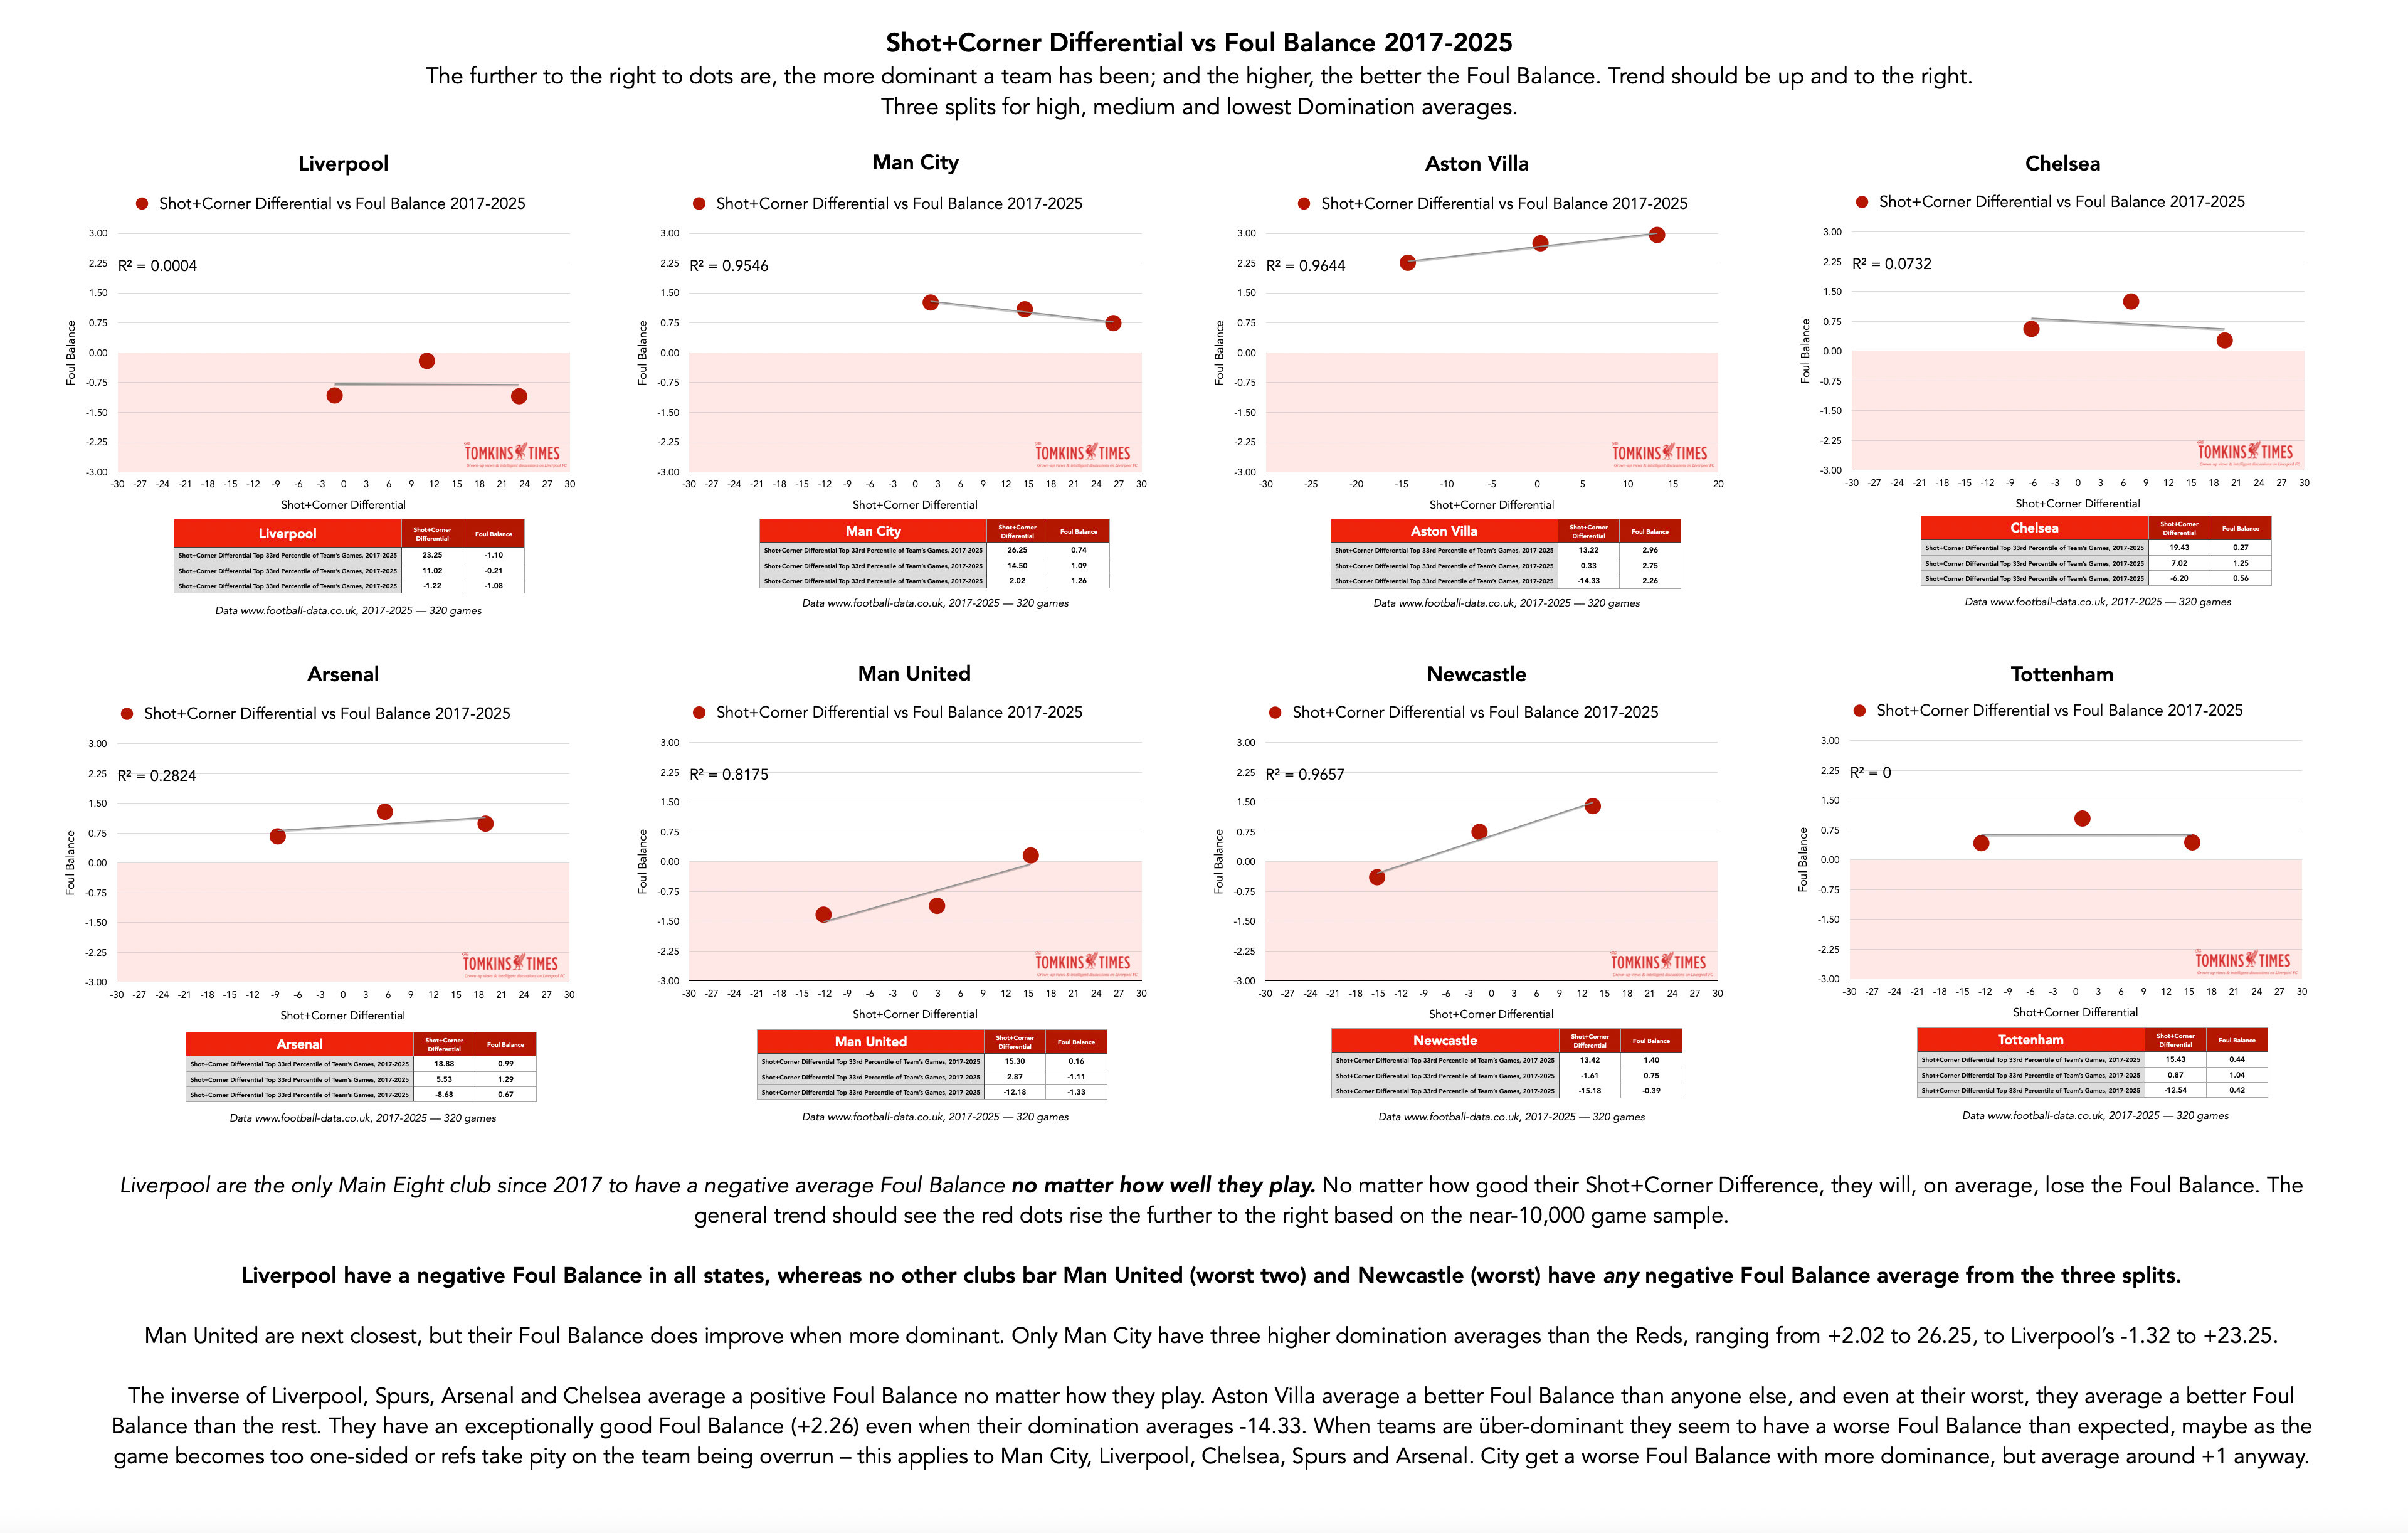
This below is important, as it shows that since 2017, no matter how Liverpool play the Foul Balance will remain the same.
They are not being officiated on what’s happening but what refs feel they can (or want to) give. All graphs should be up and to the right, albeit at super-high possession or domination the Foul Balance can go a bit haywire.
Premier League Trends since 2000
The Foul Balances of Champions
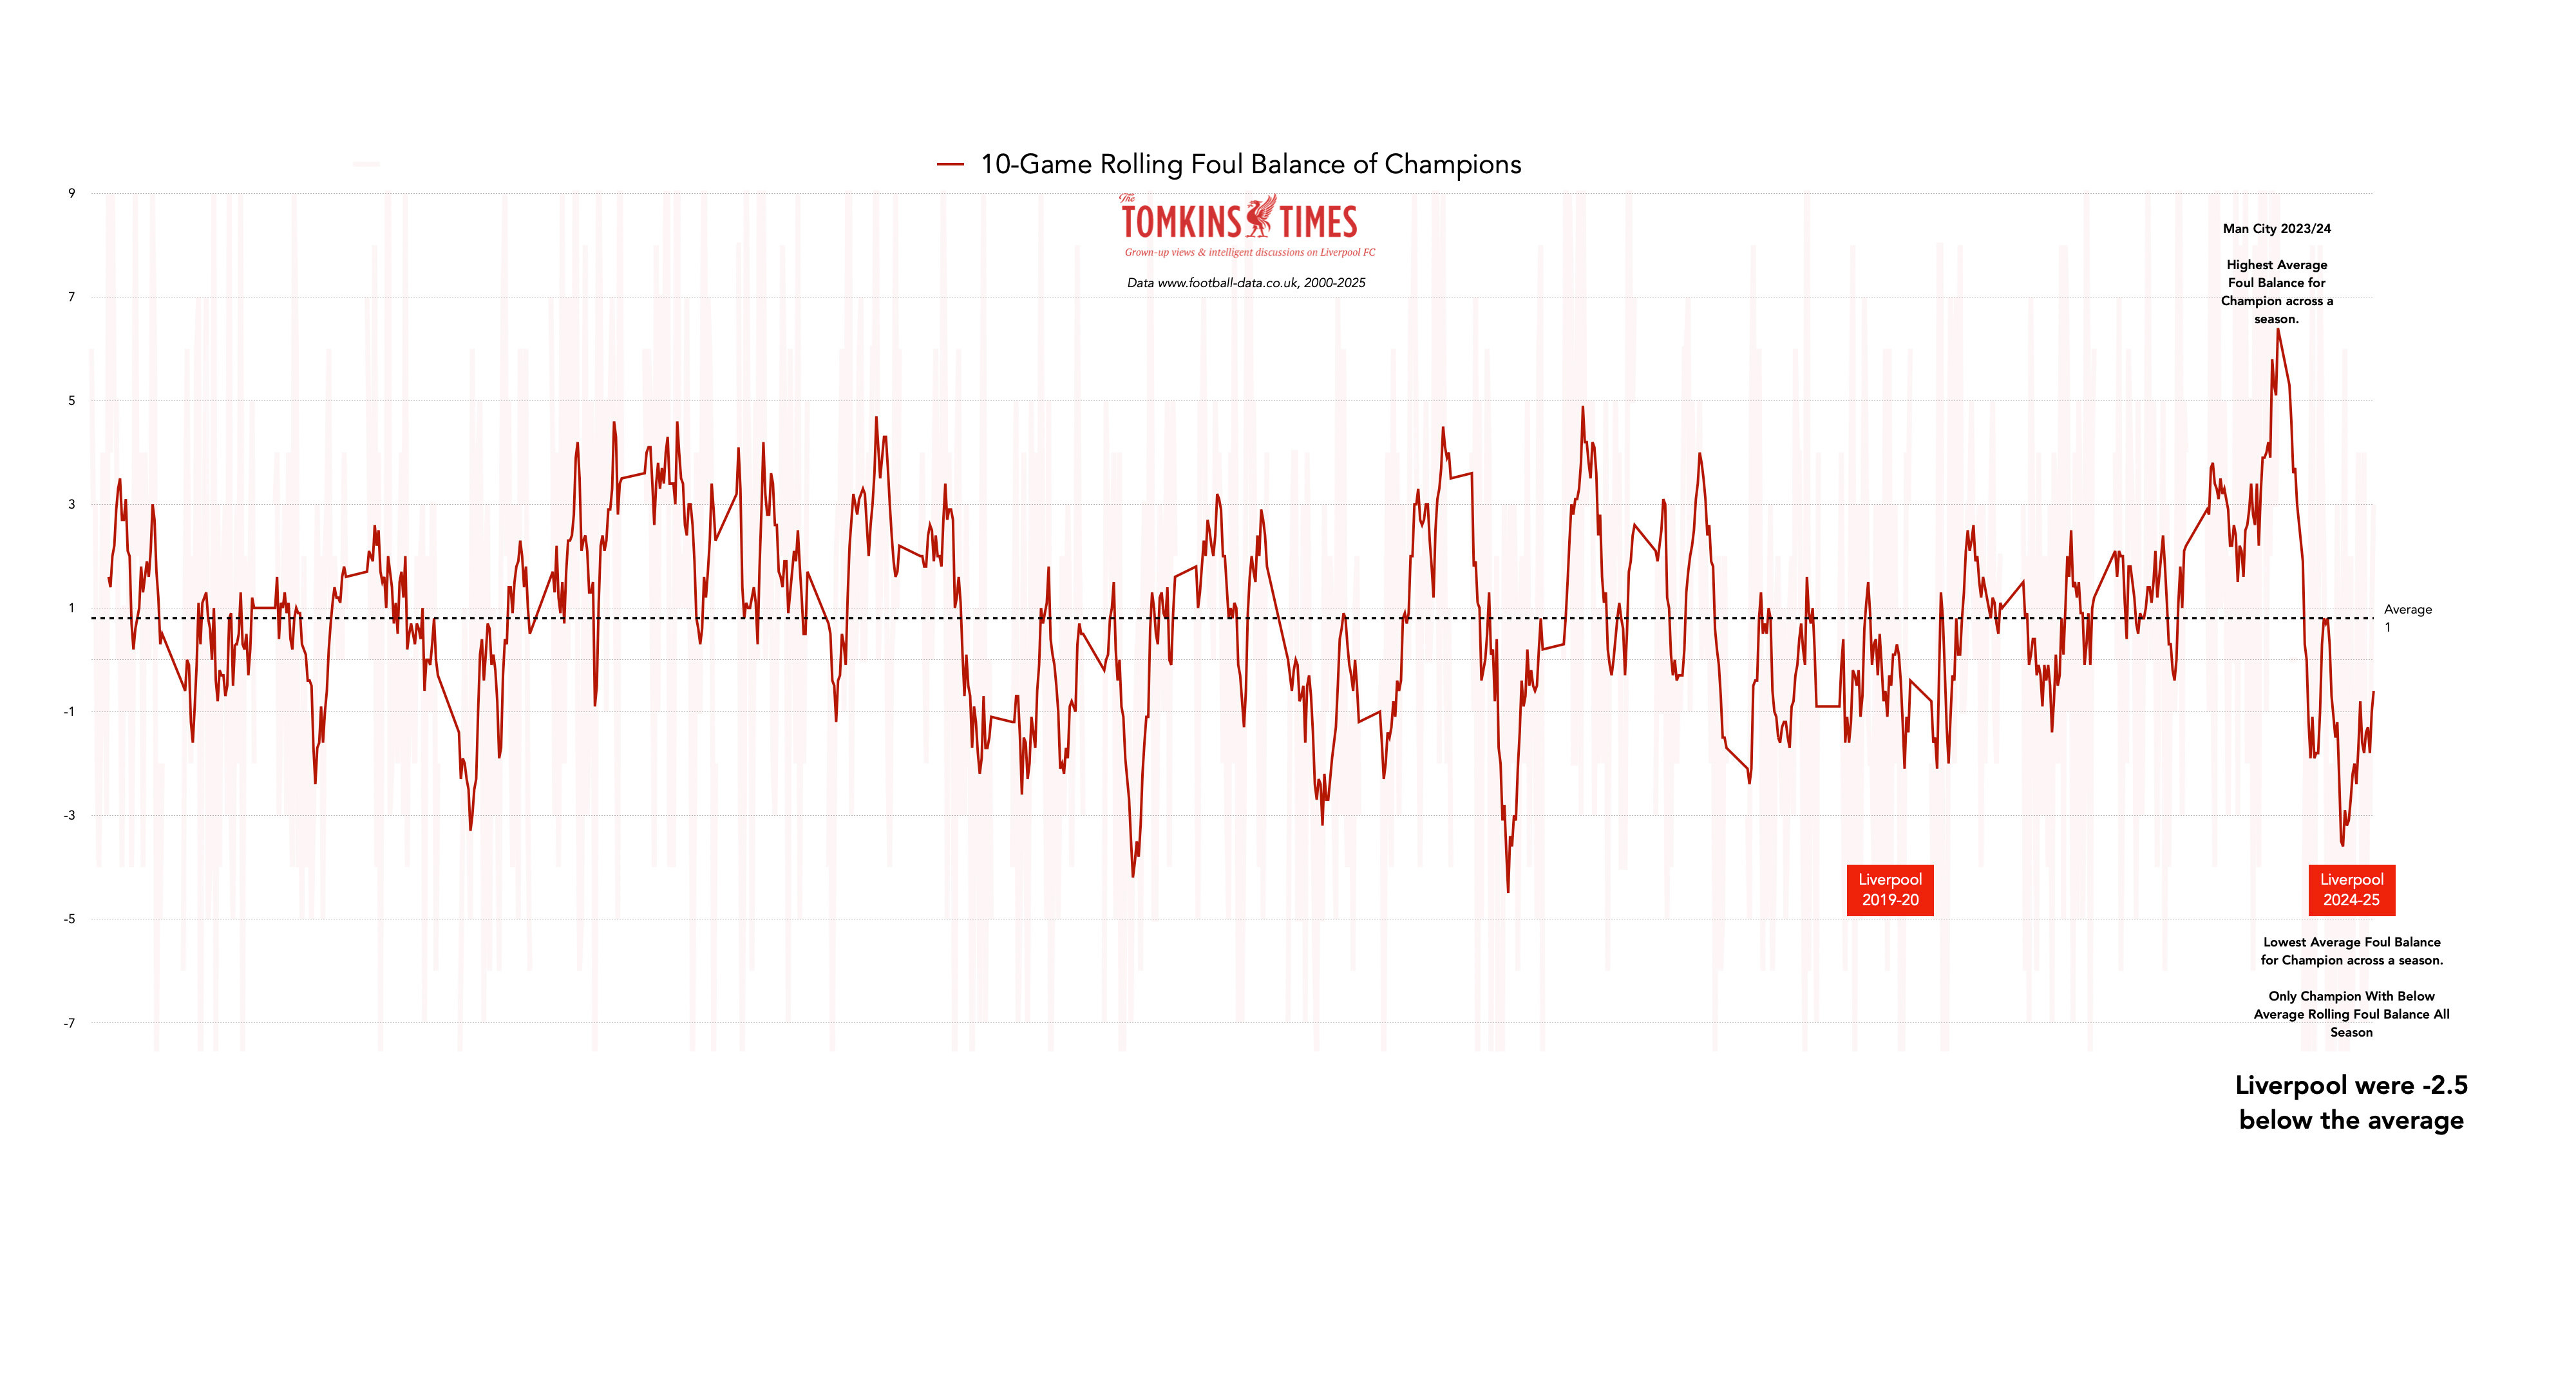
A small number of clubs had lower troughs, but none stayed below average all season. Most troughs turned into peaks for other clubs within the same season.
Liverpool/Man City Referee Comparisons
Extreme Foul Balances Since 2020
Rafa’s “Rant” January 2009
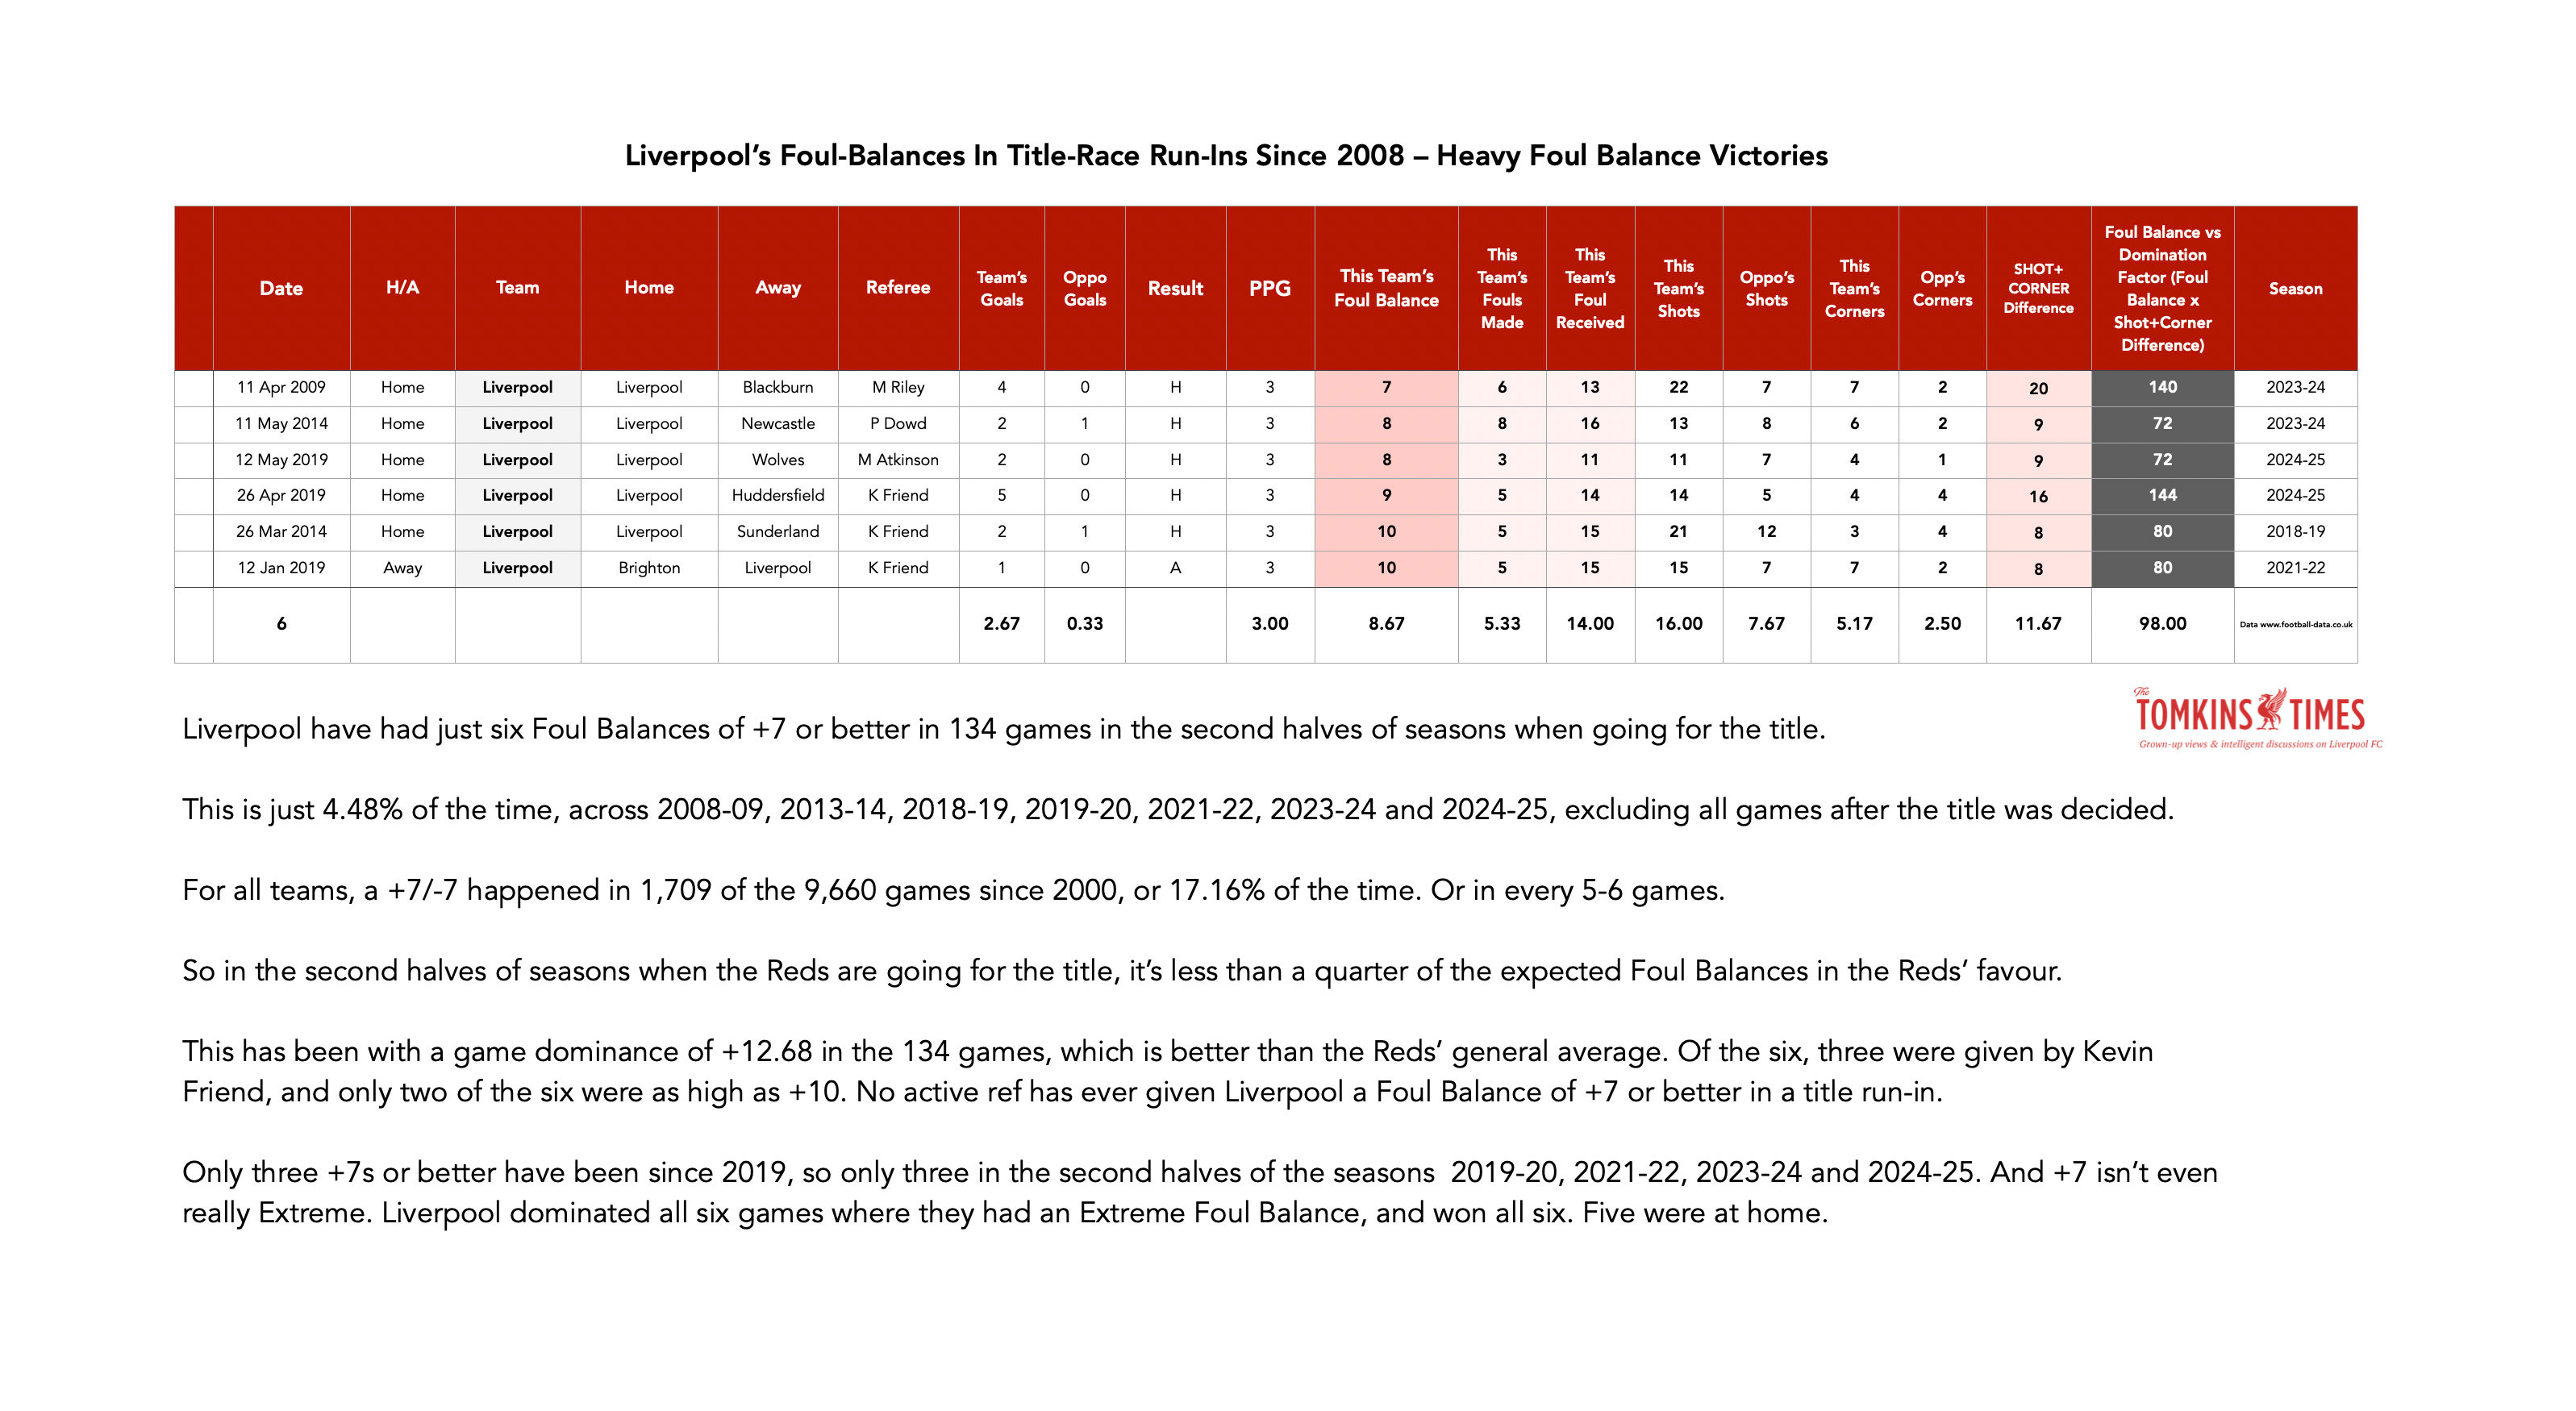
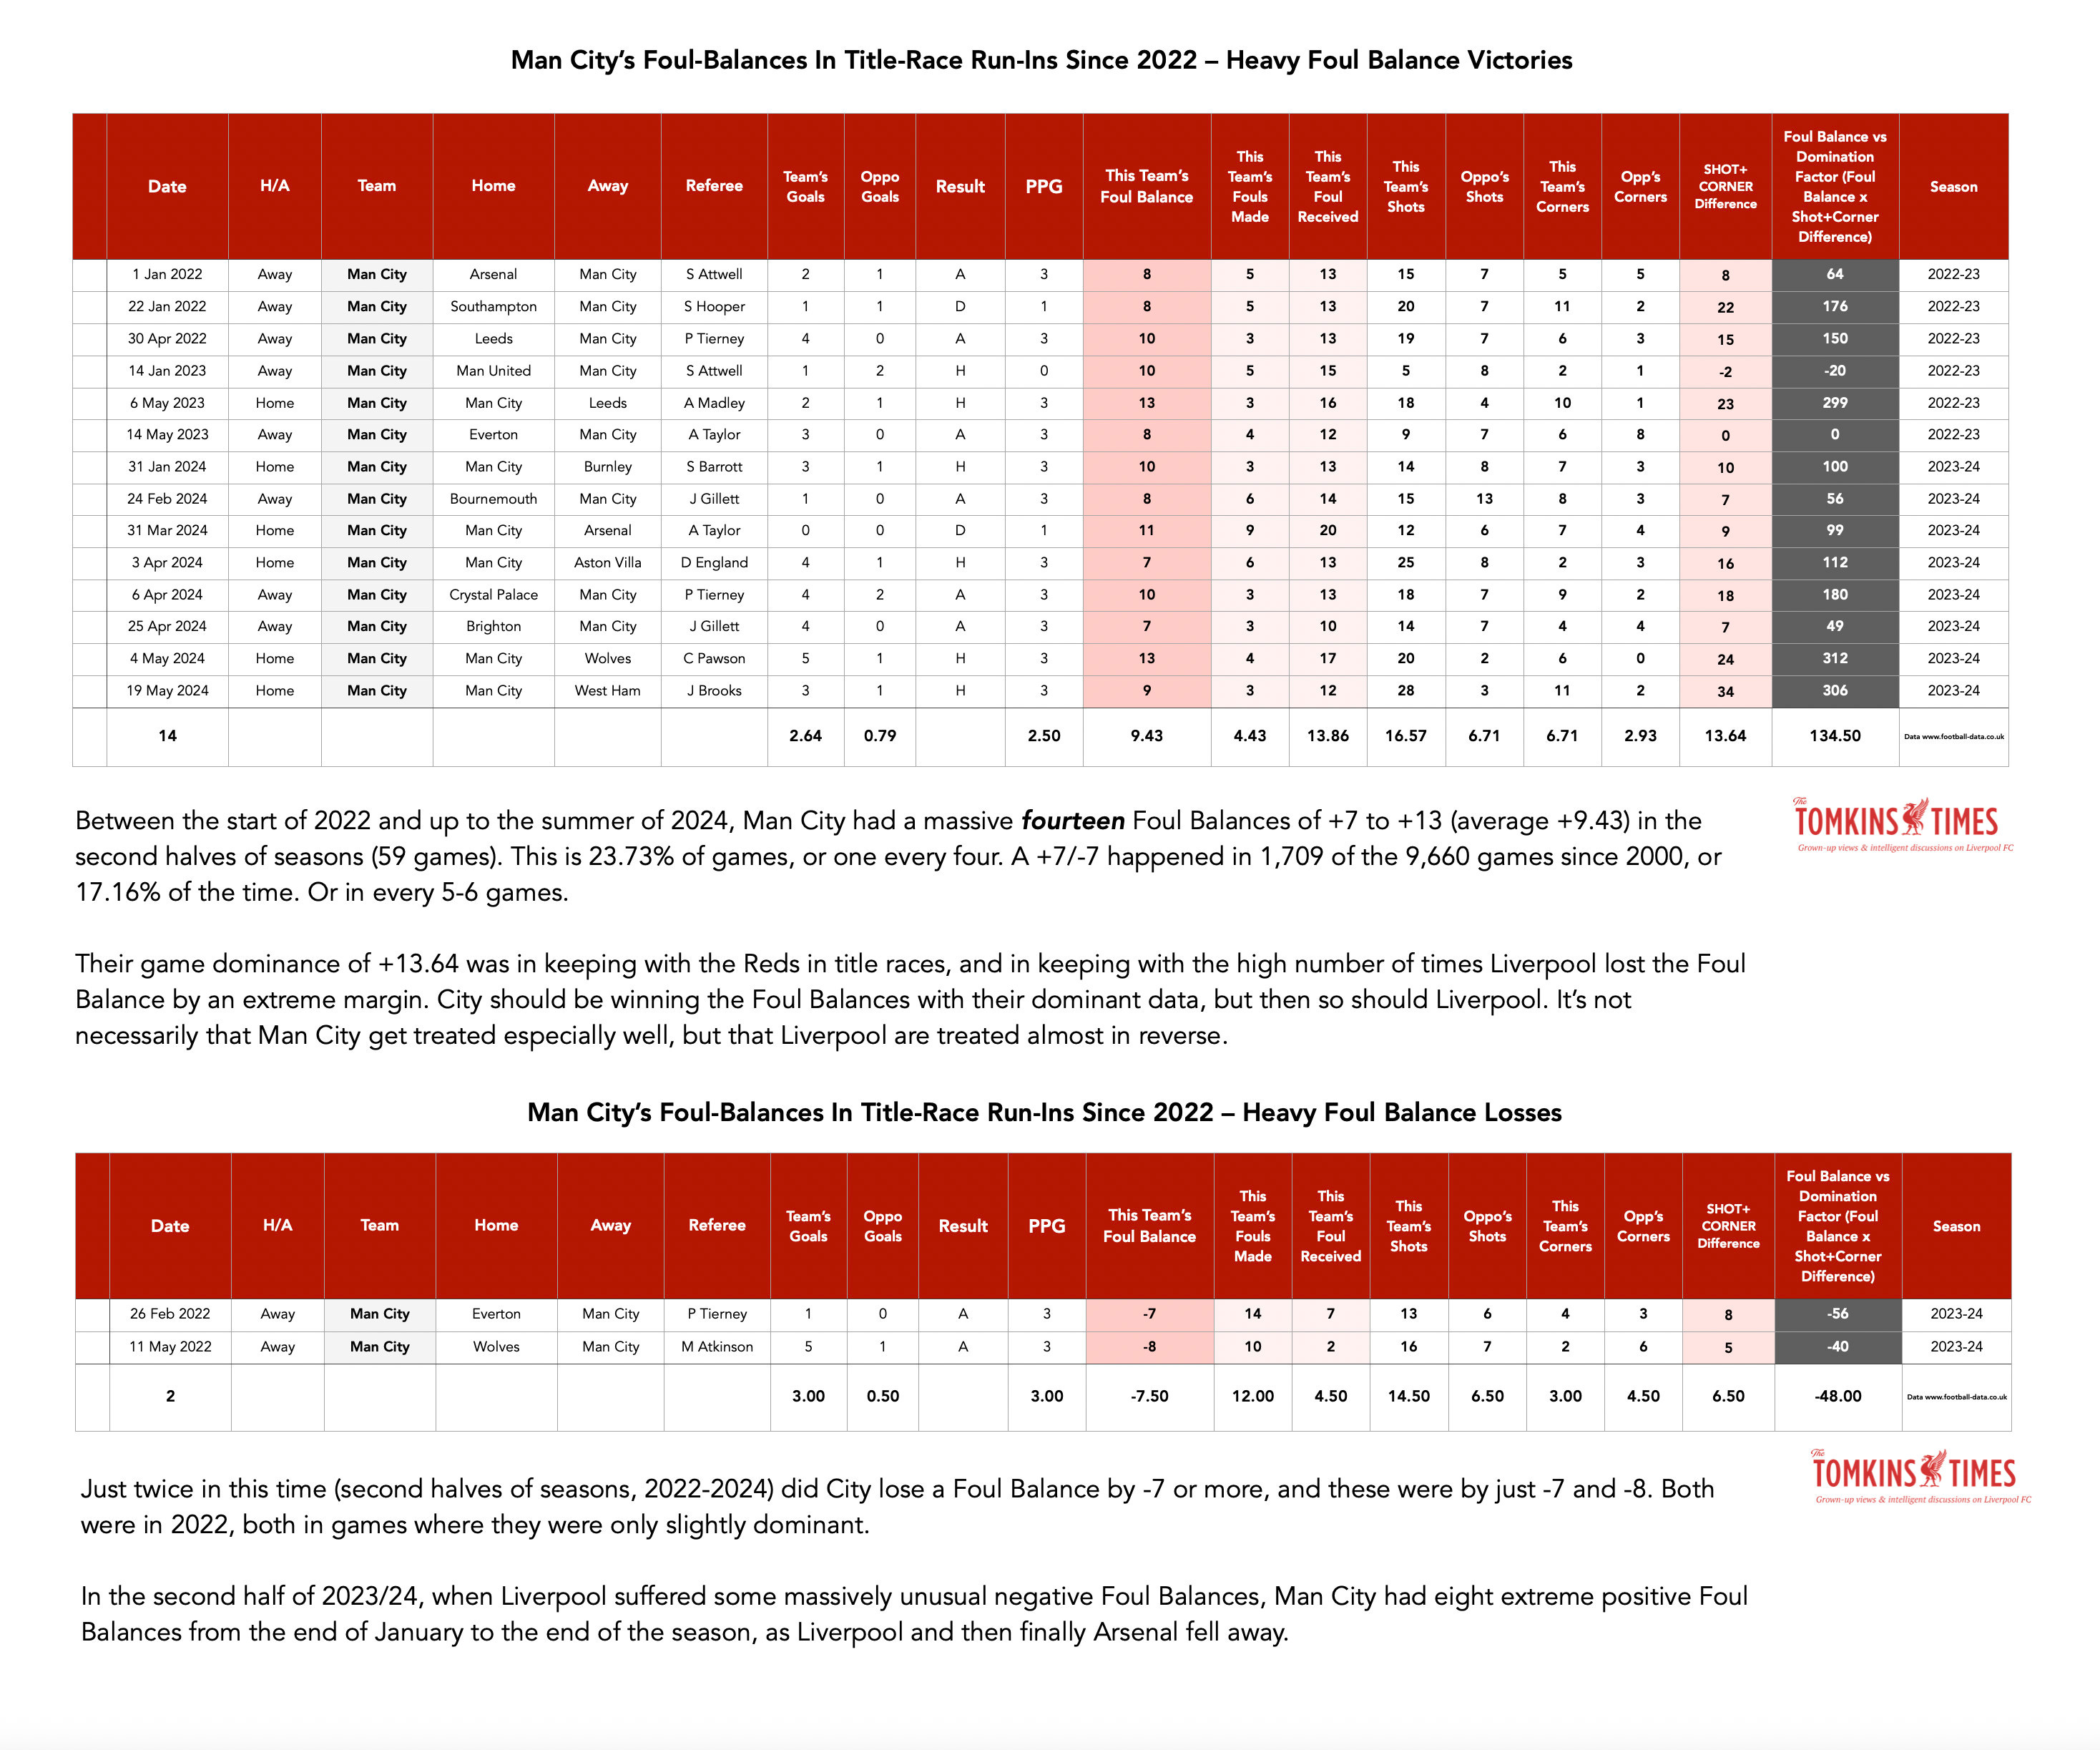
Foul Balances in Recent Title Run-Ins
Extreme Foul Balances (For vs Against) in Last 3 Years
Strangely Rare Occasions Liverpool win 15+ Fouls In A Game Since 2017
(Now 323 games.)
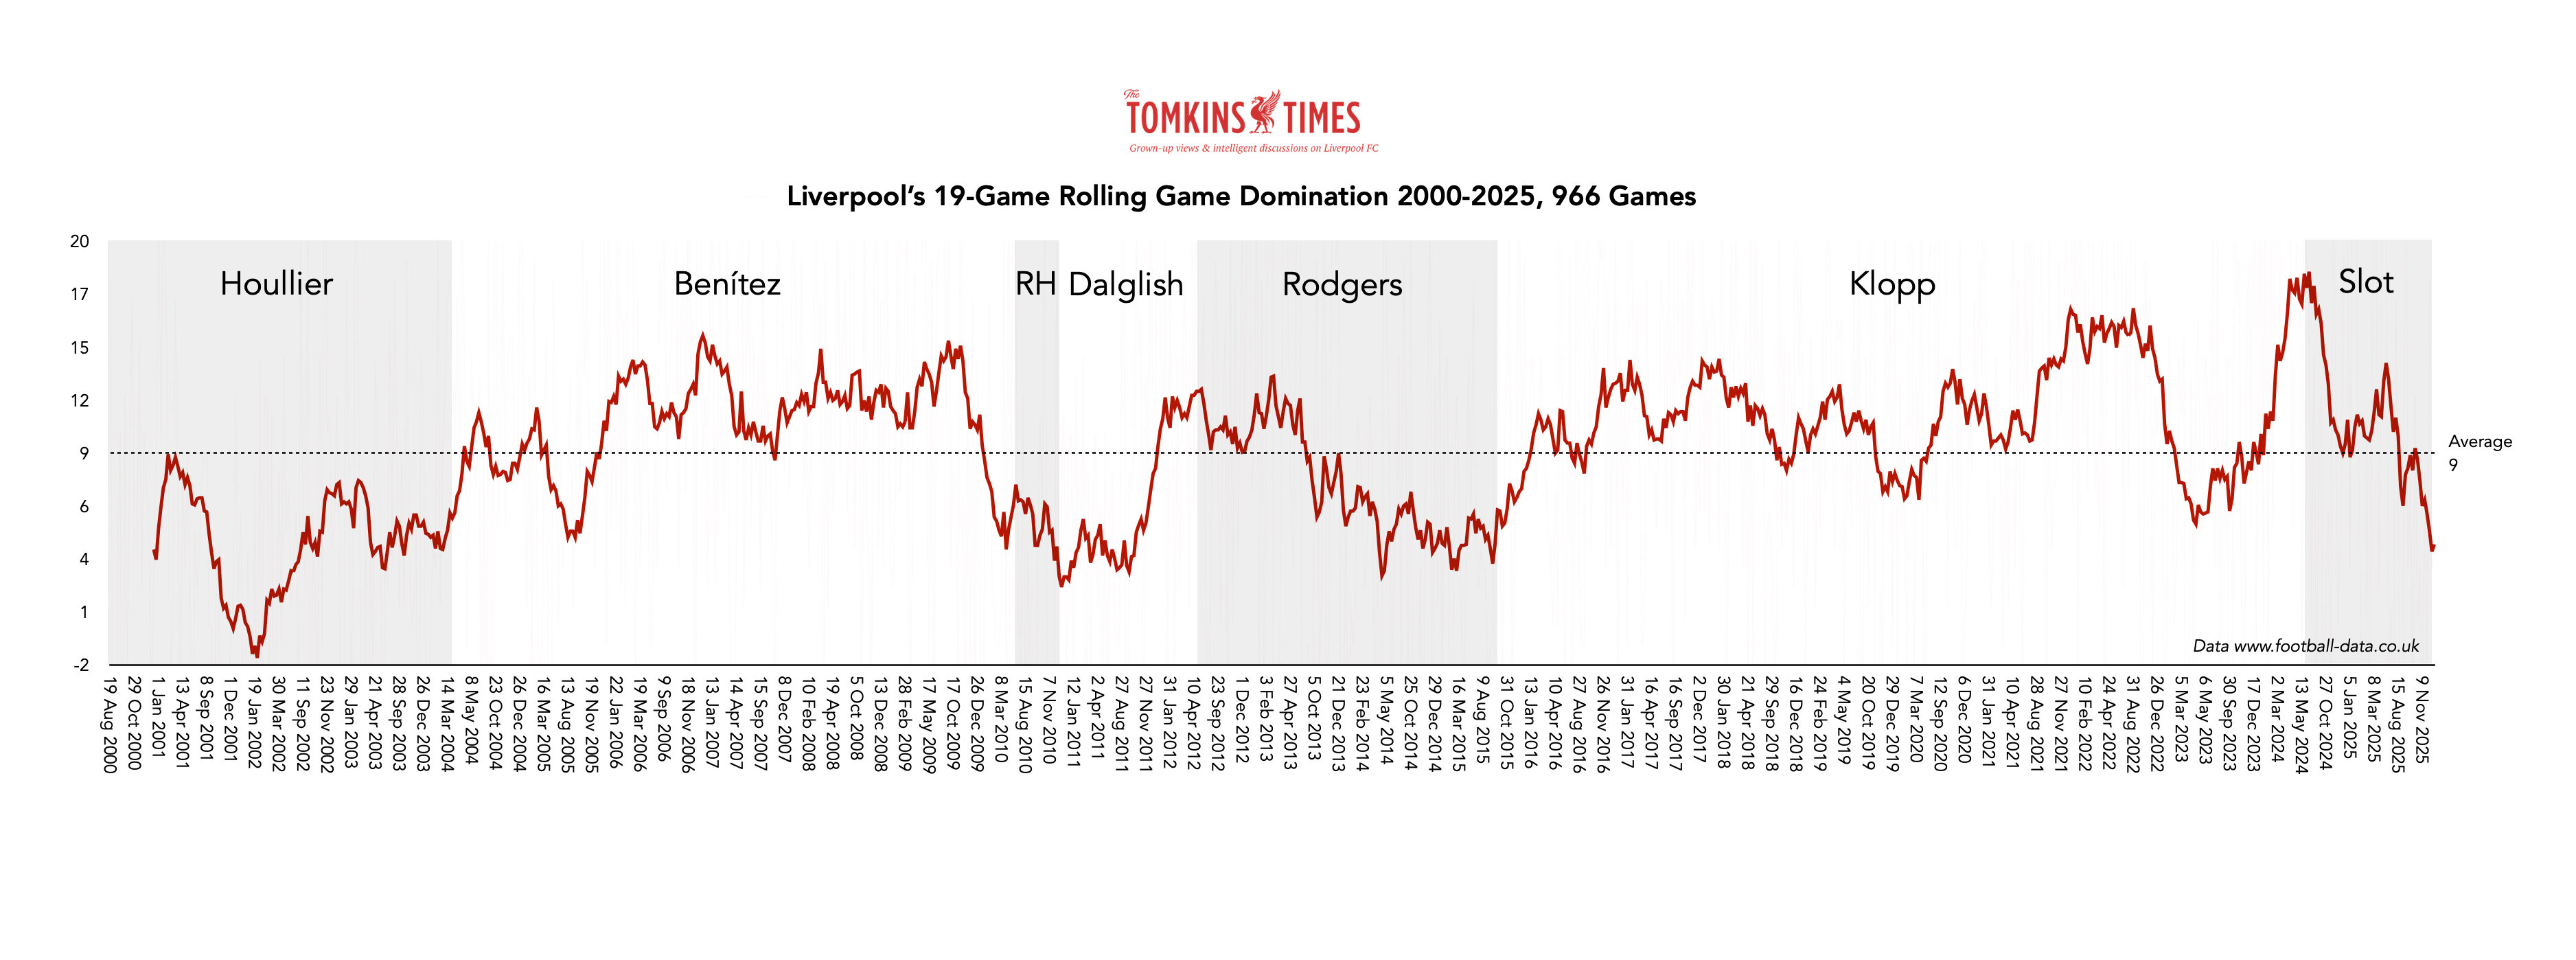
Liverpool’s Rolling Data Since the Year 2000
Game domination, then Foul Balances. See the contrasts over time, and I’ve included home and away splits. (Liverpool’s dominance has increased in the last few games since the data was recorded.)
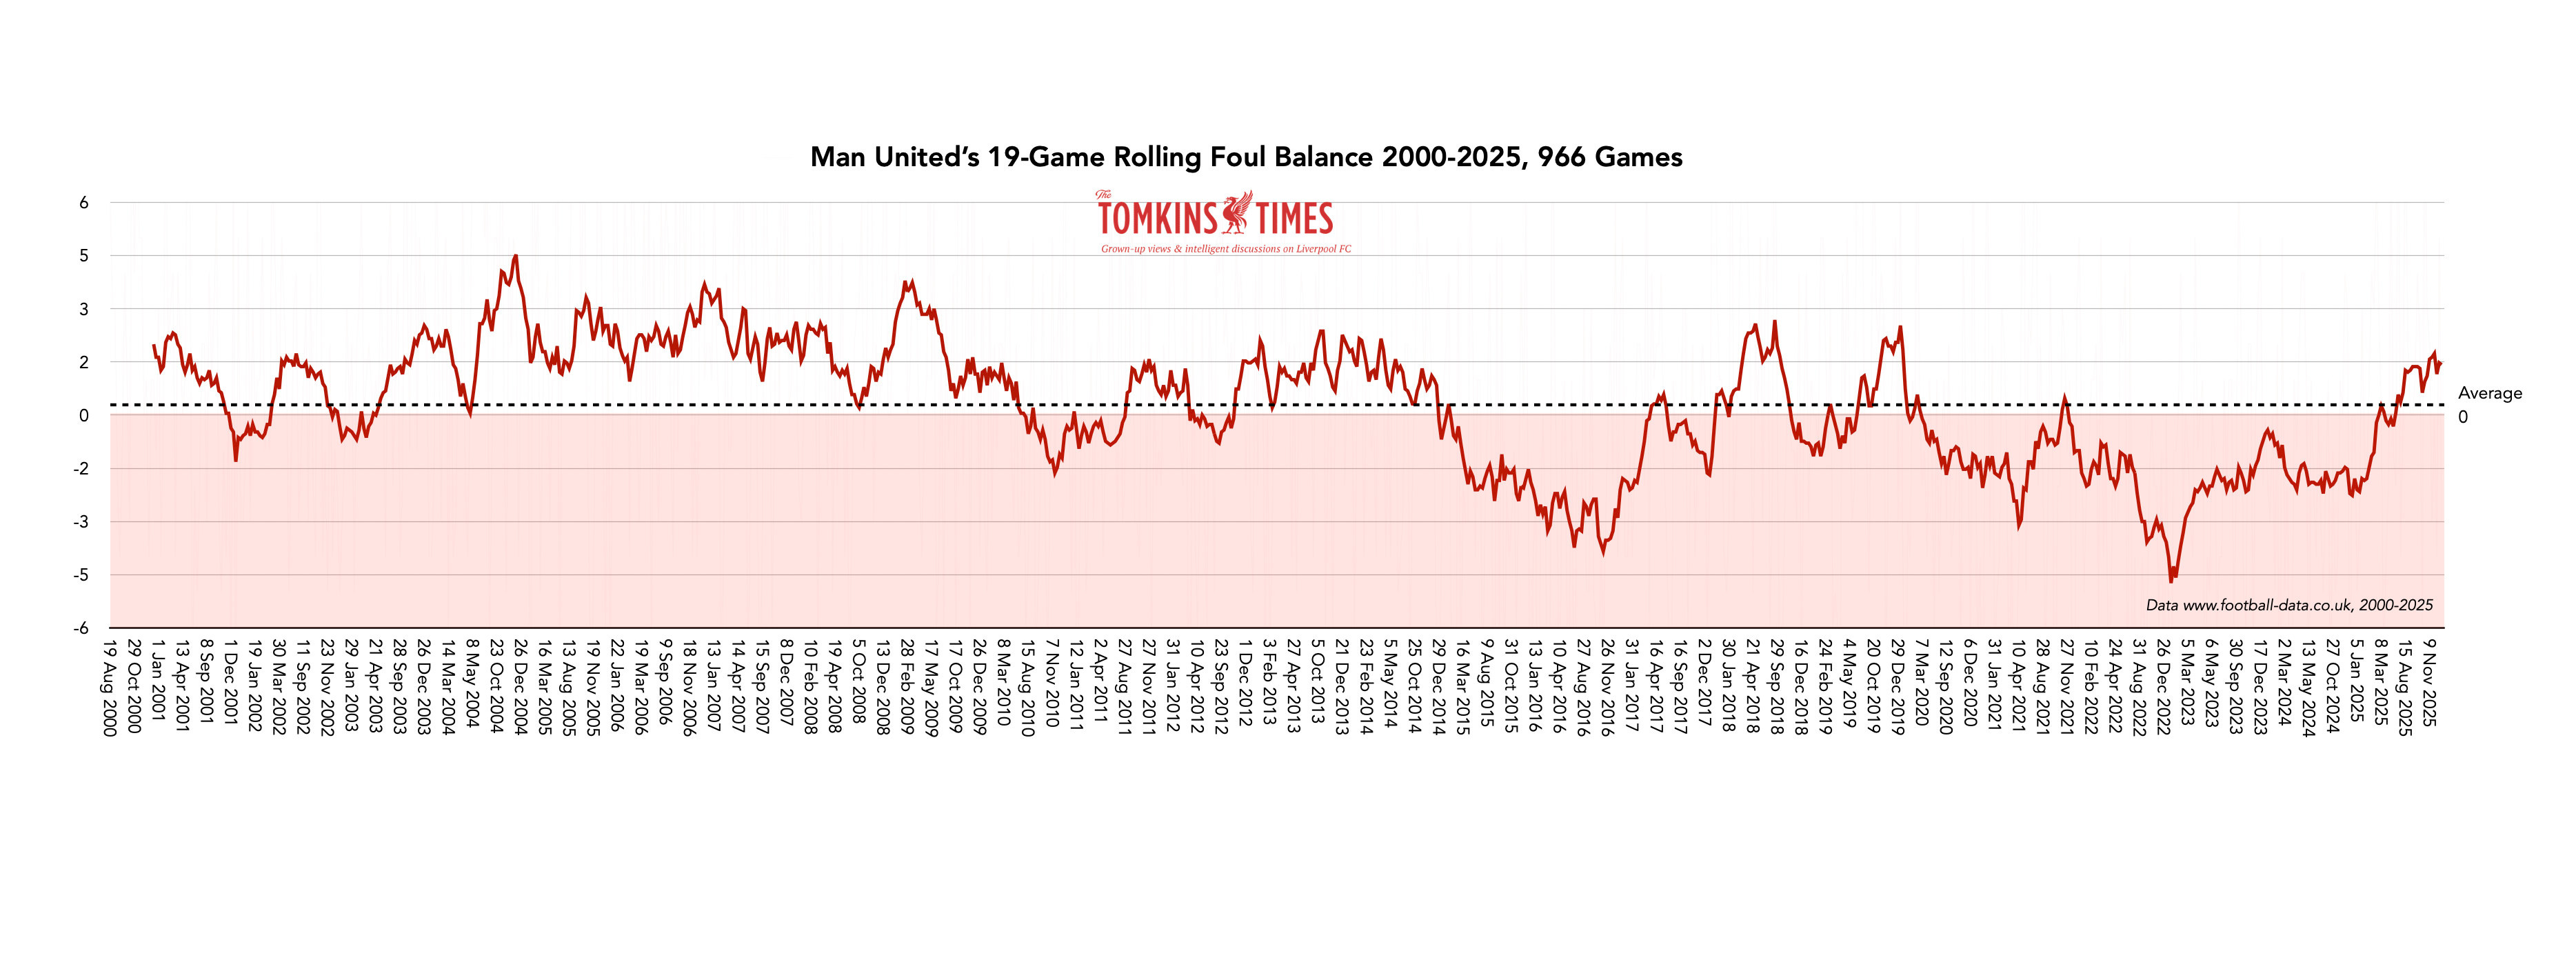
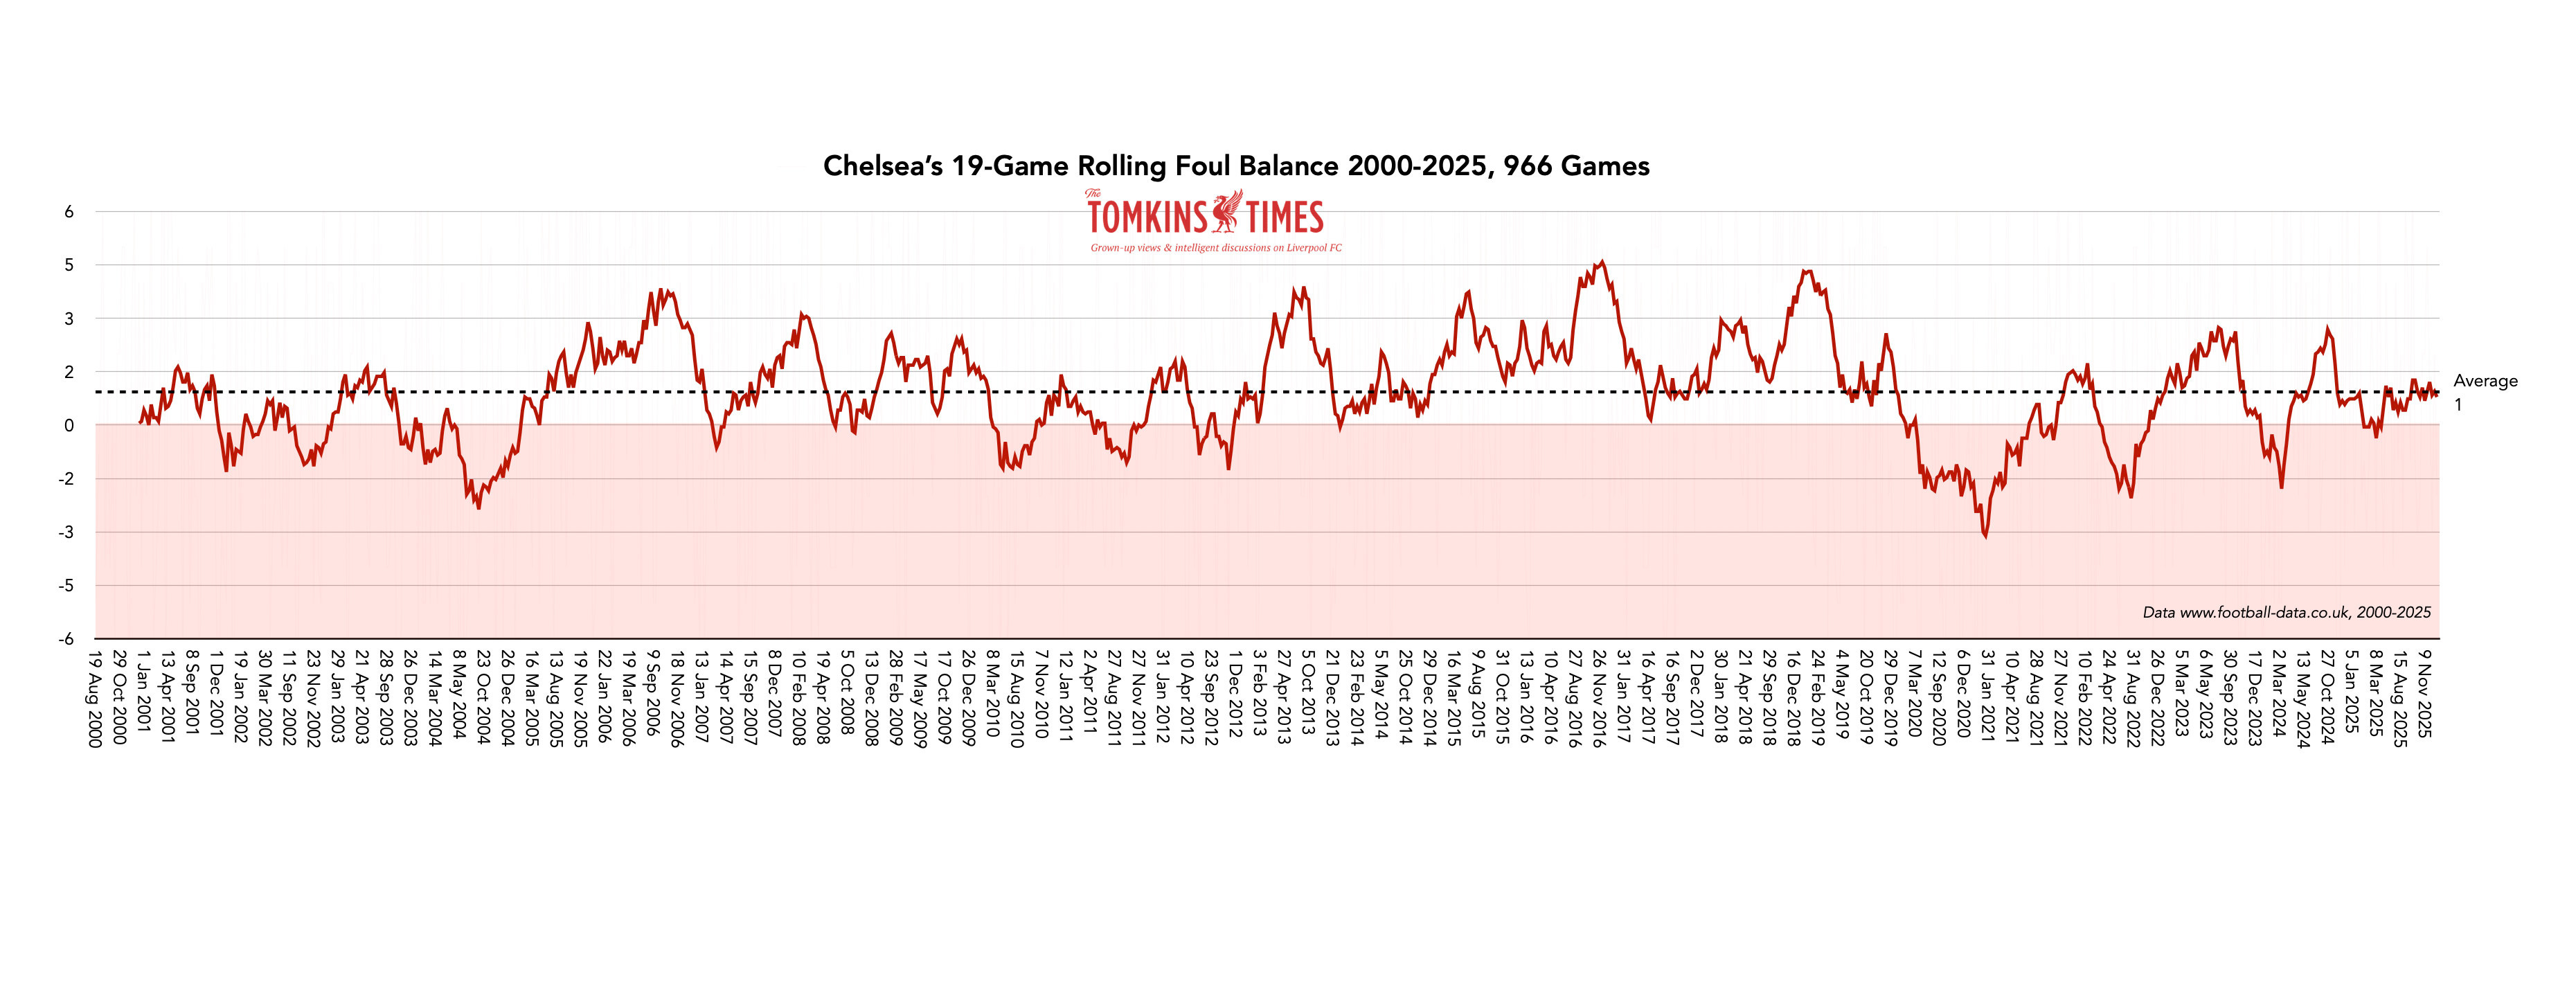
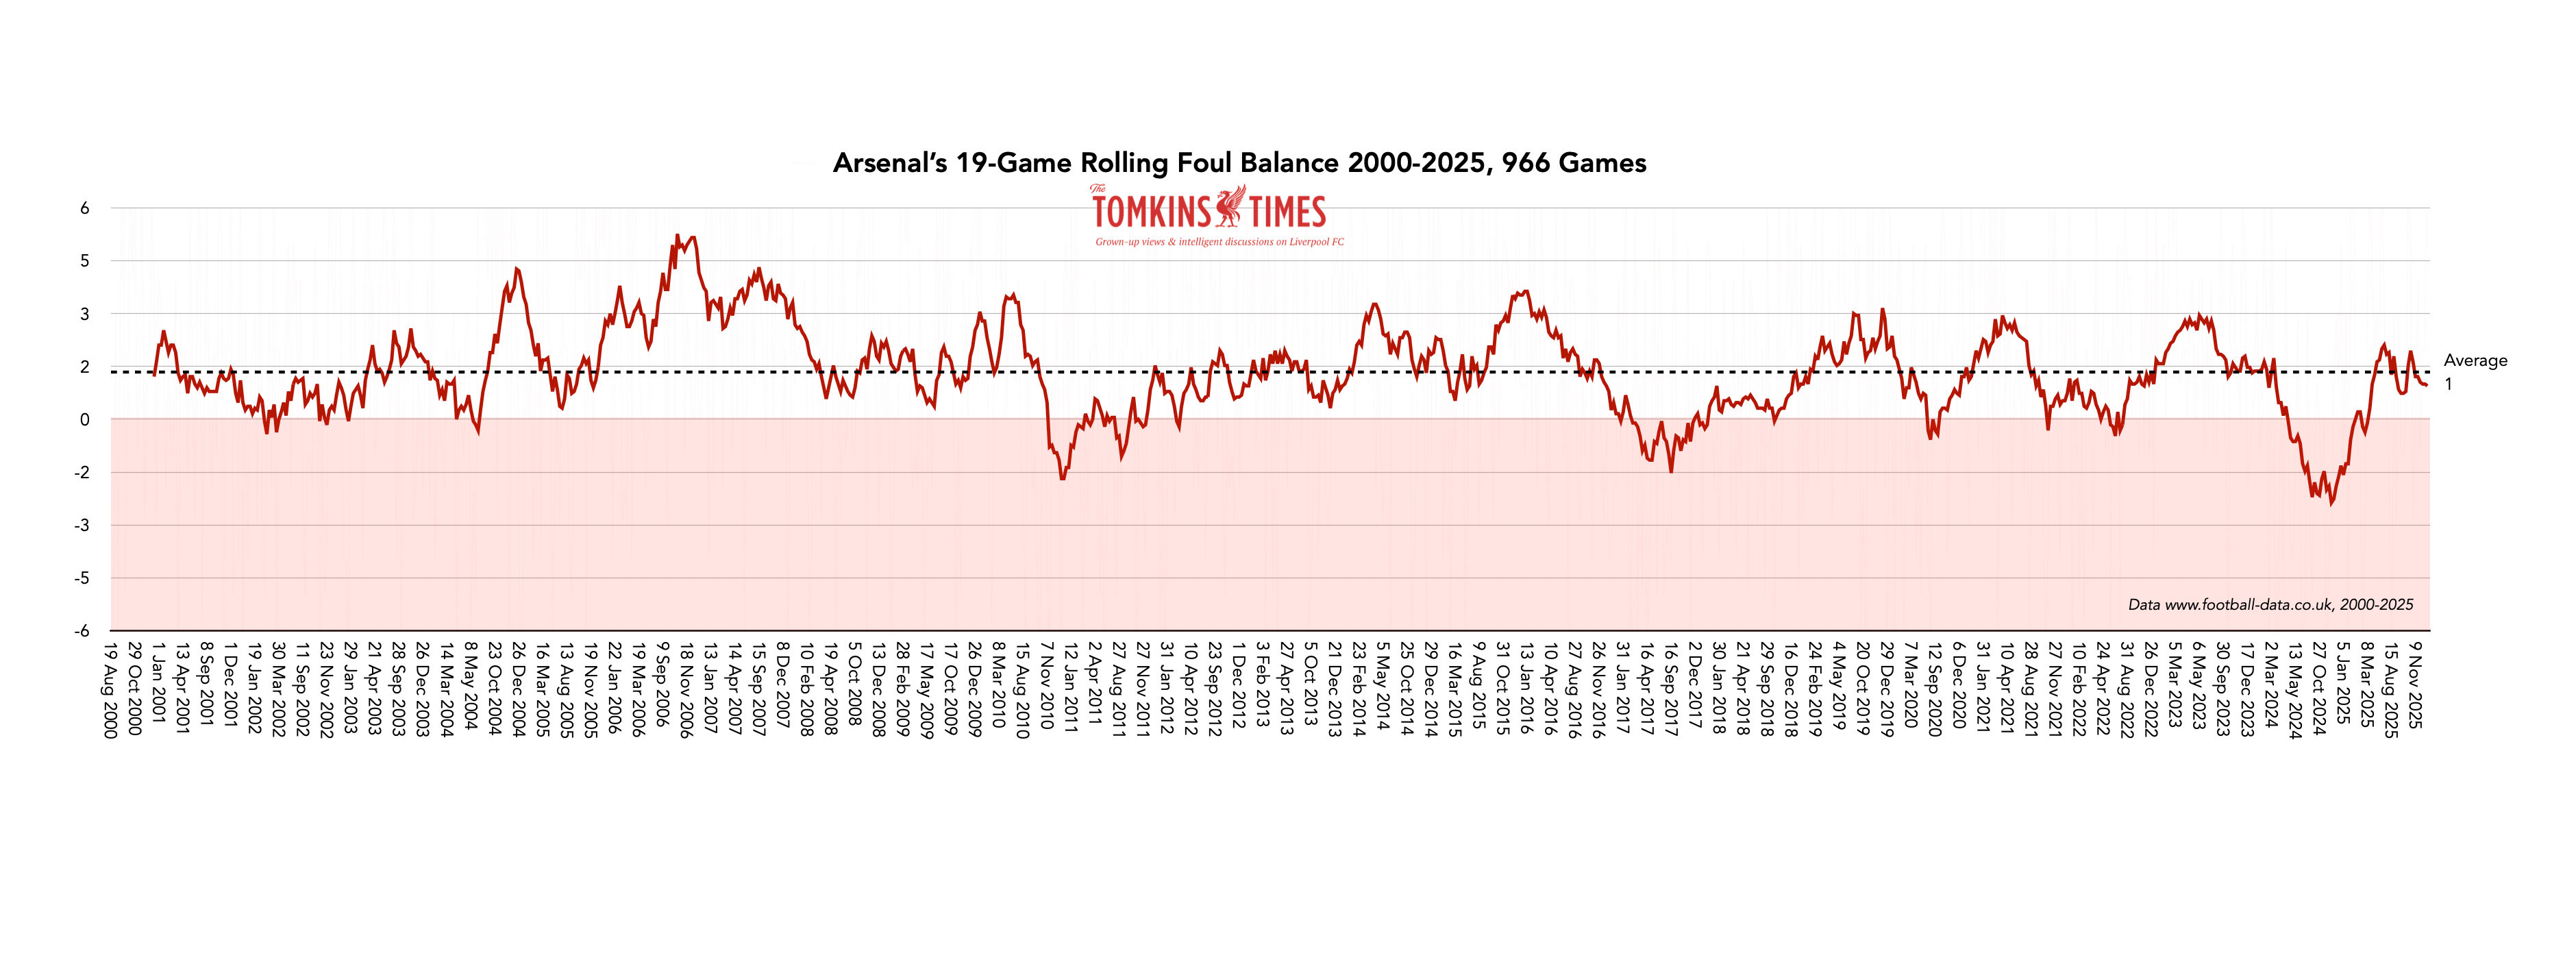
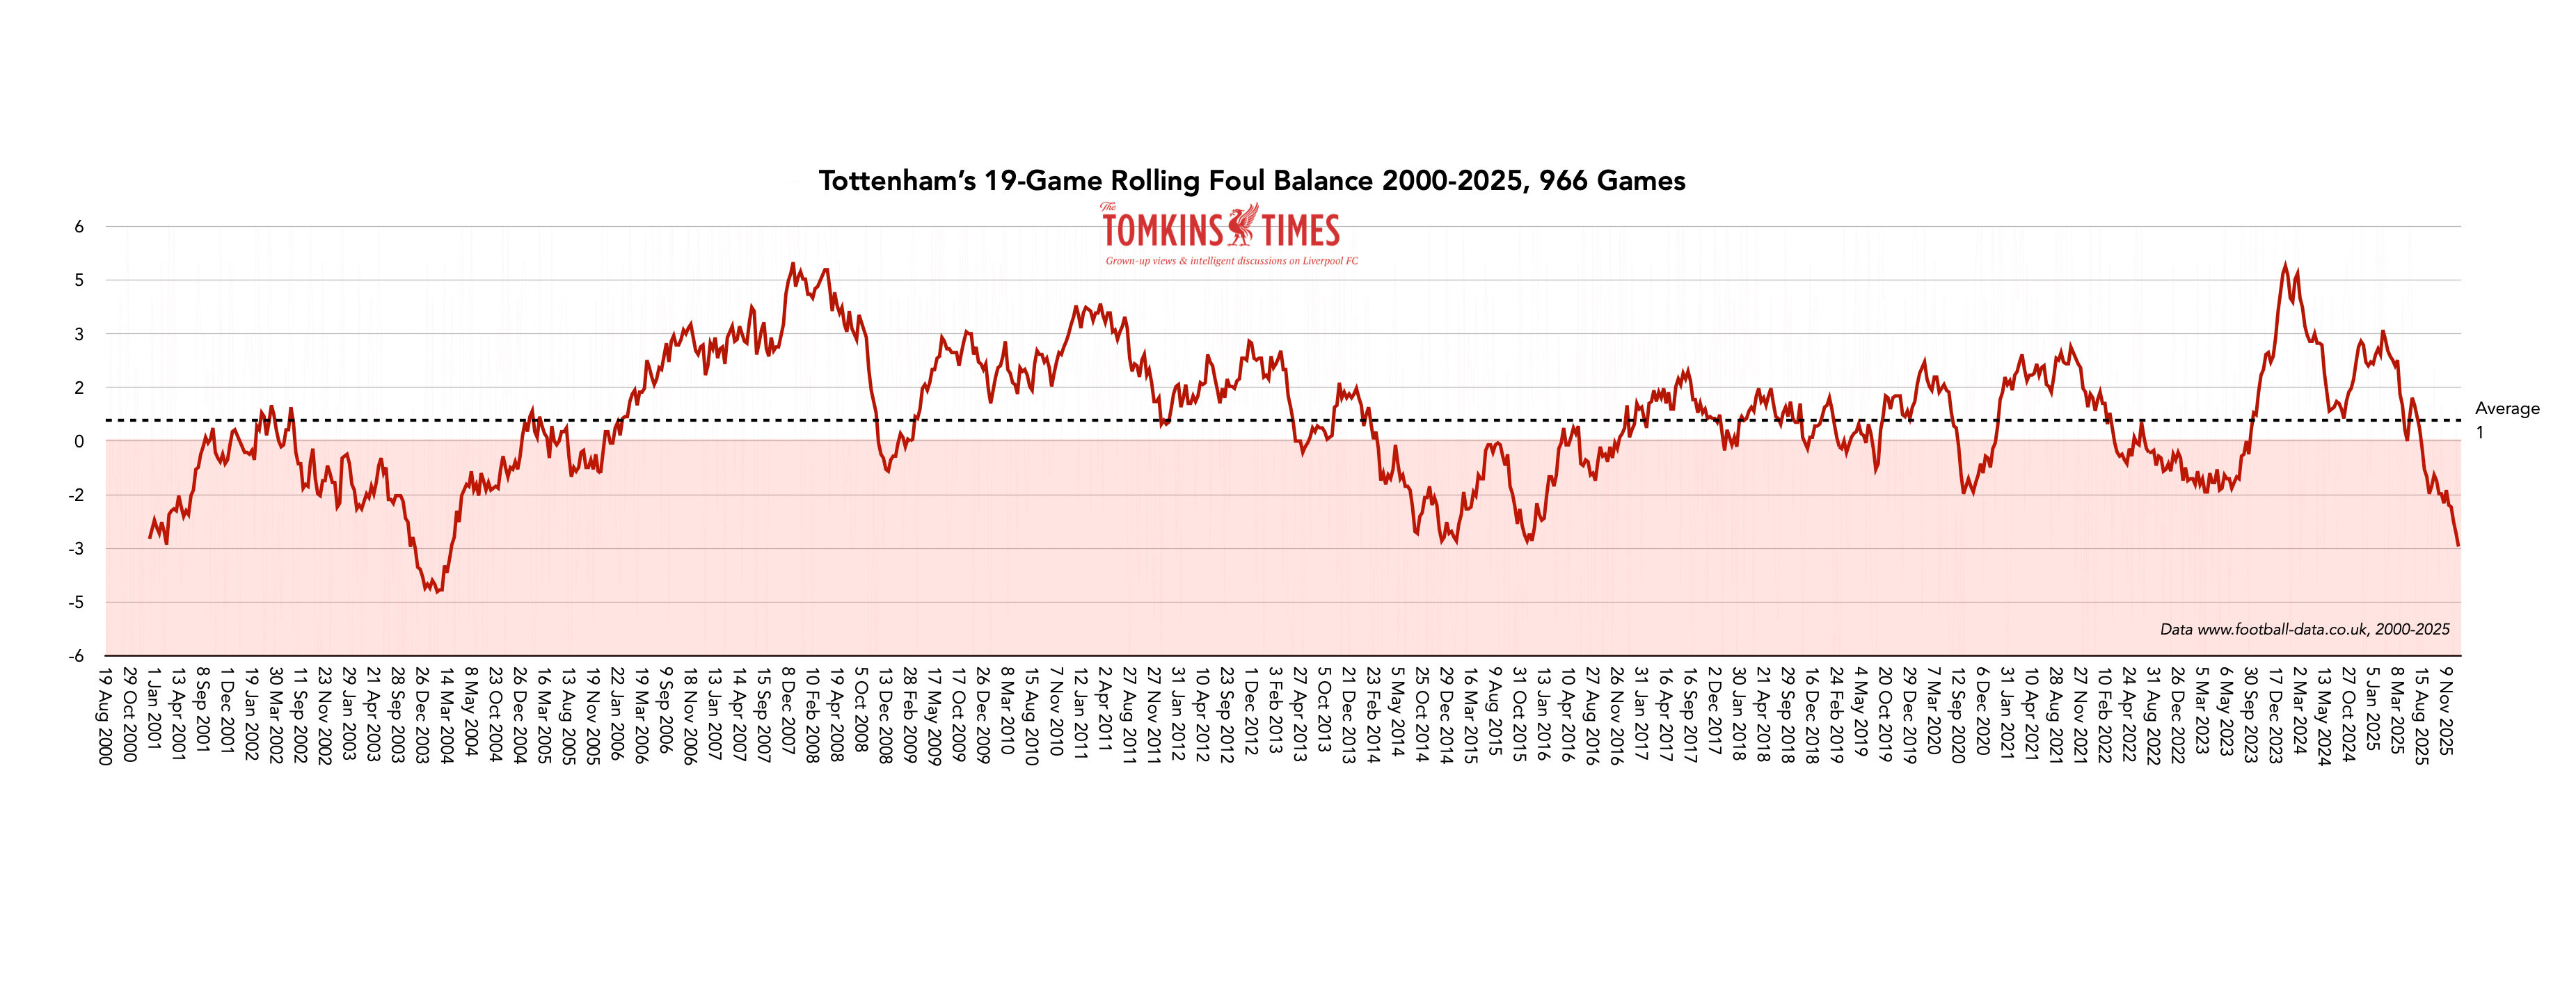
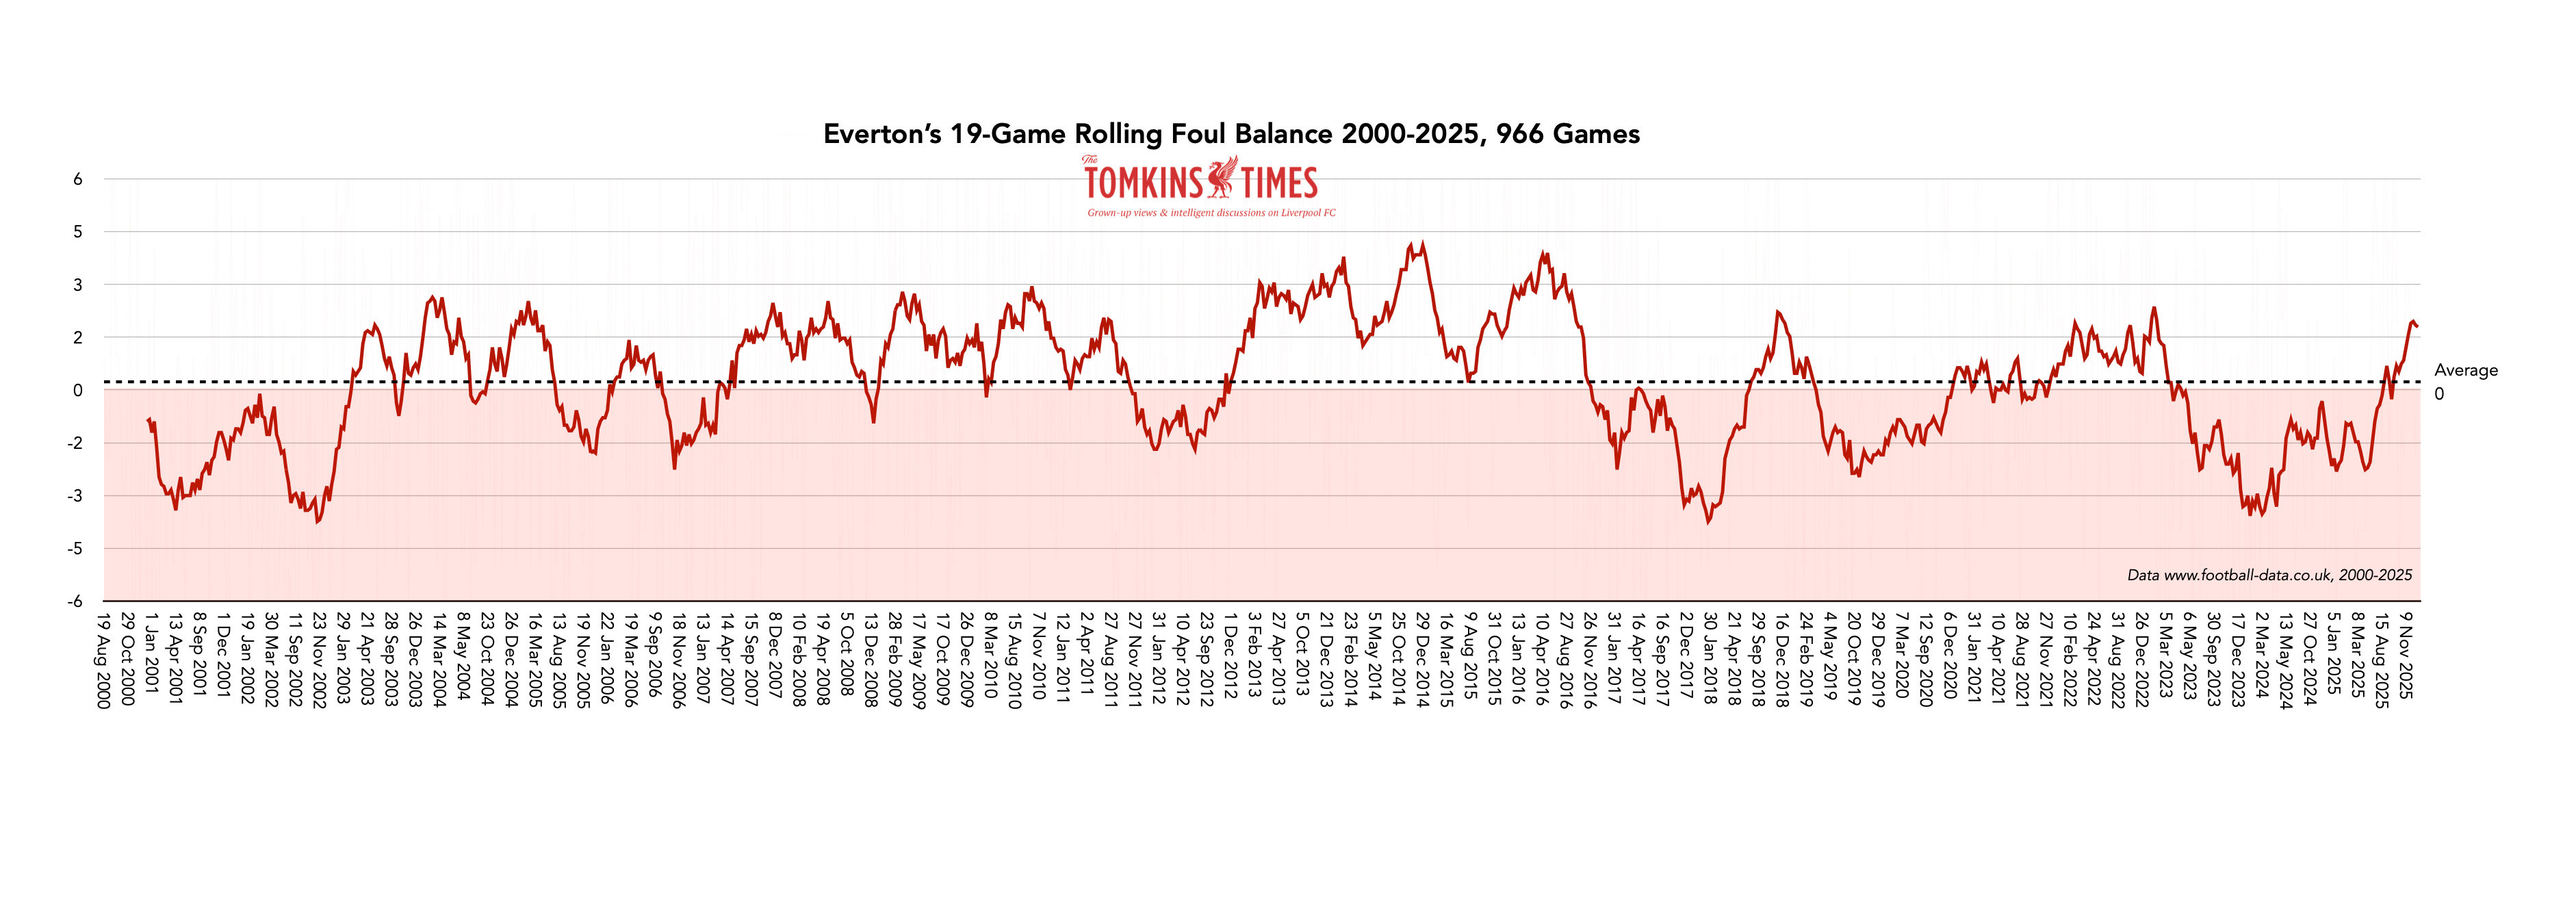
Rivals’ Foul Balances Since 2000
Coote and Co.
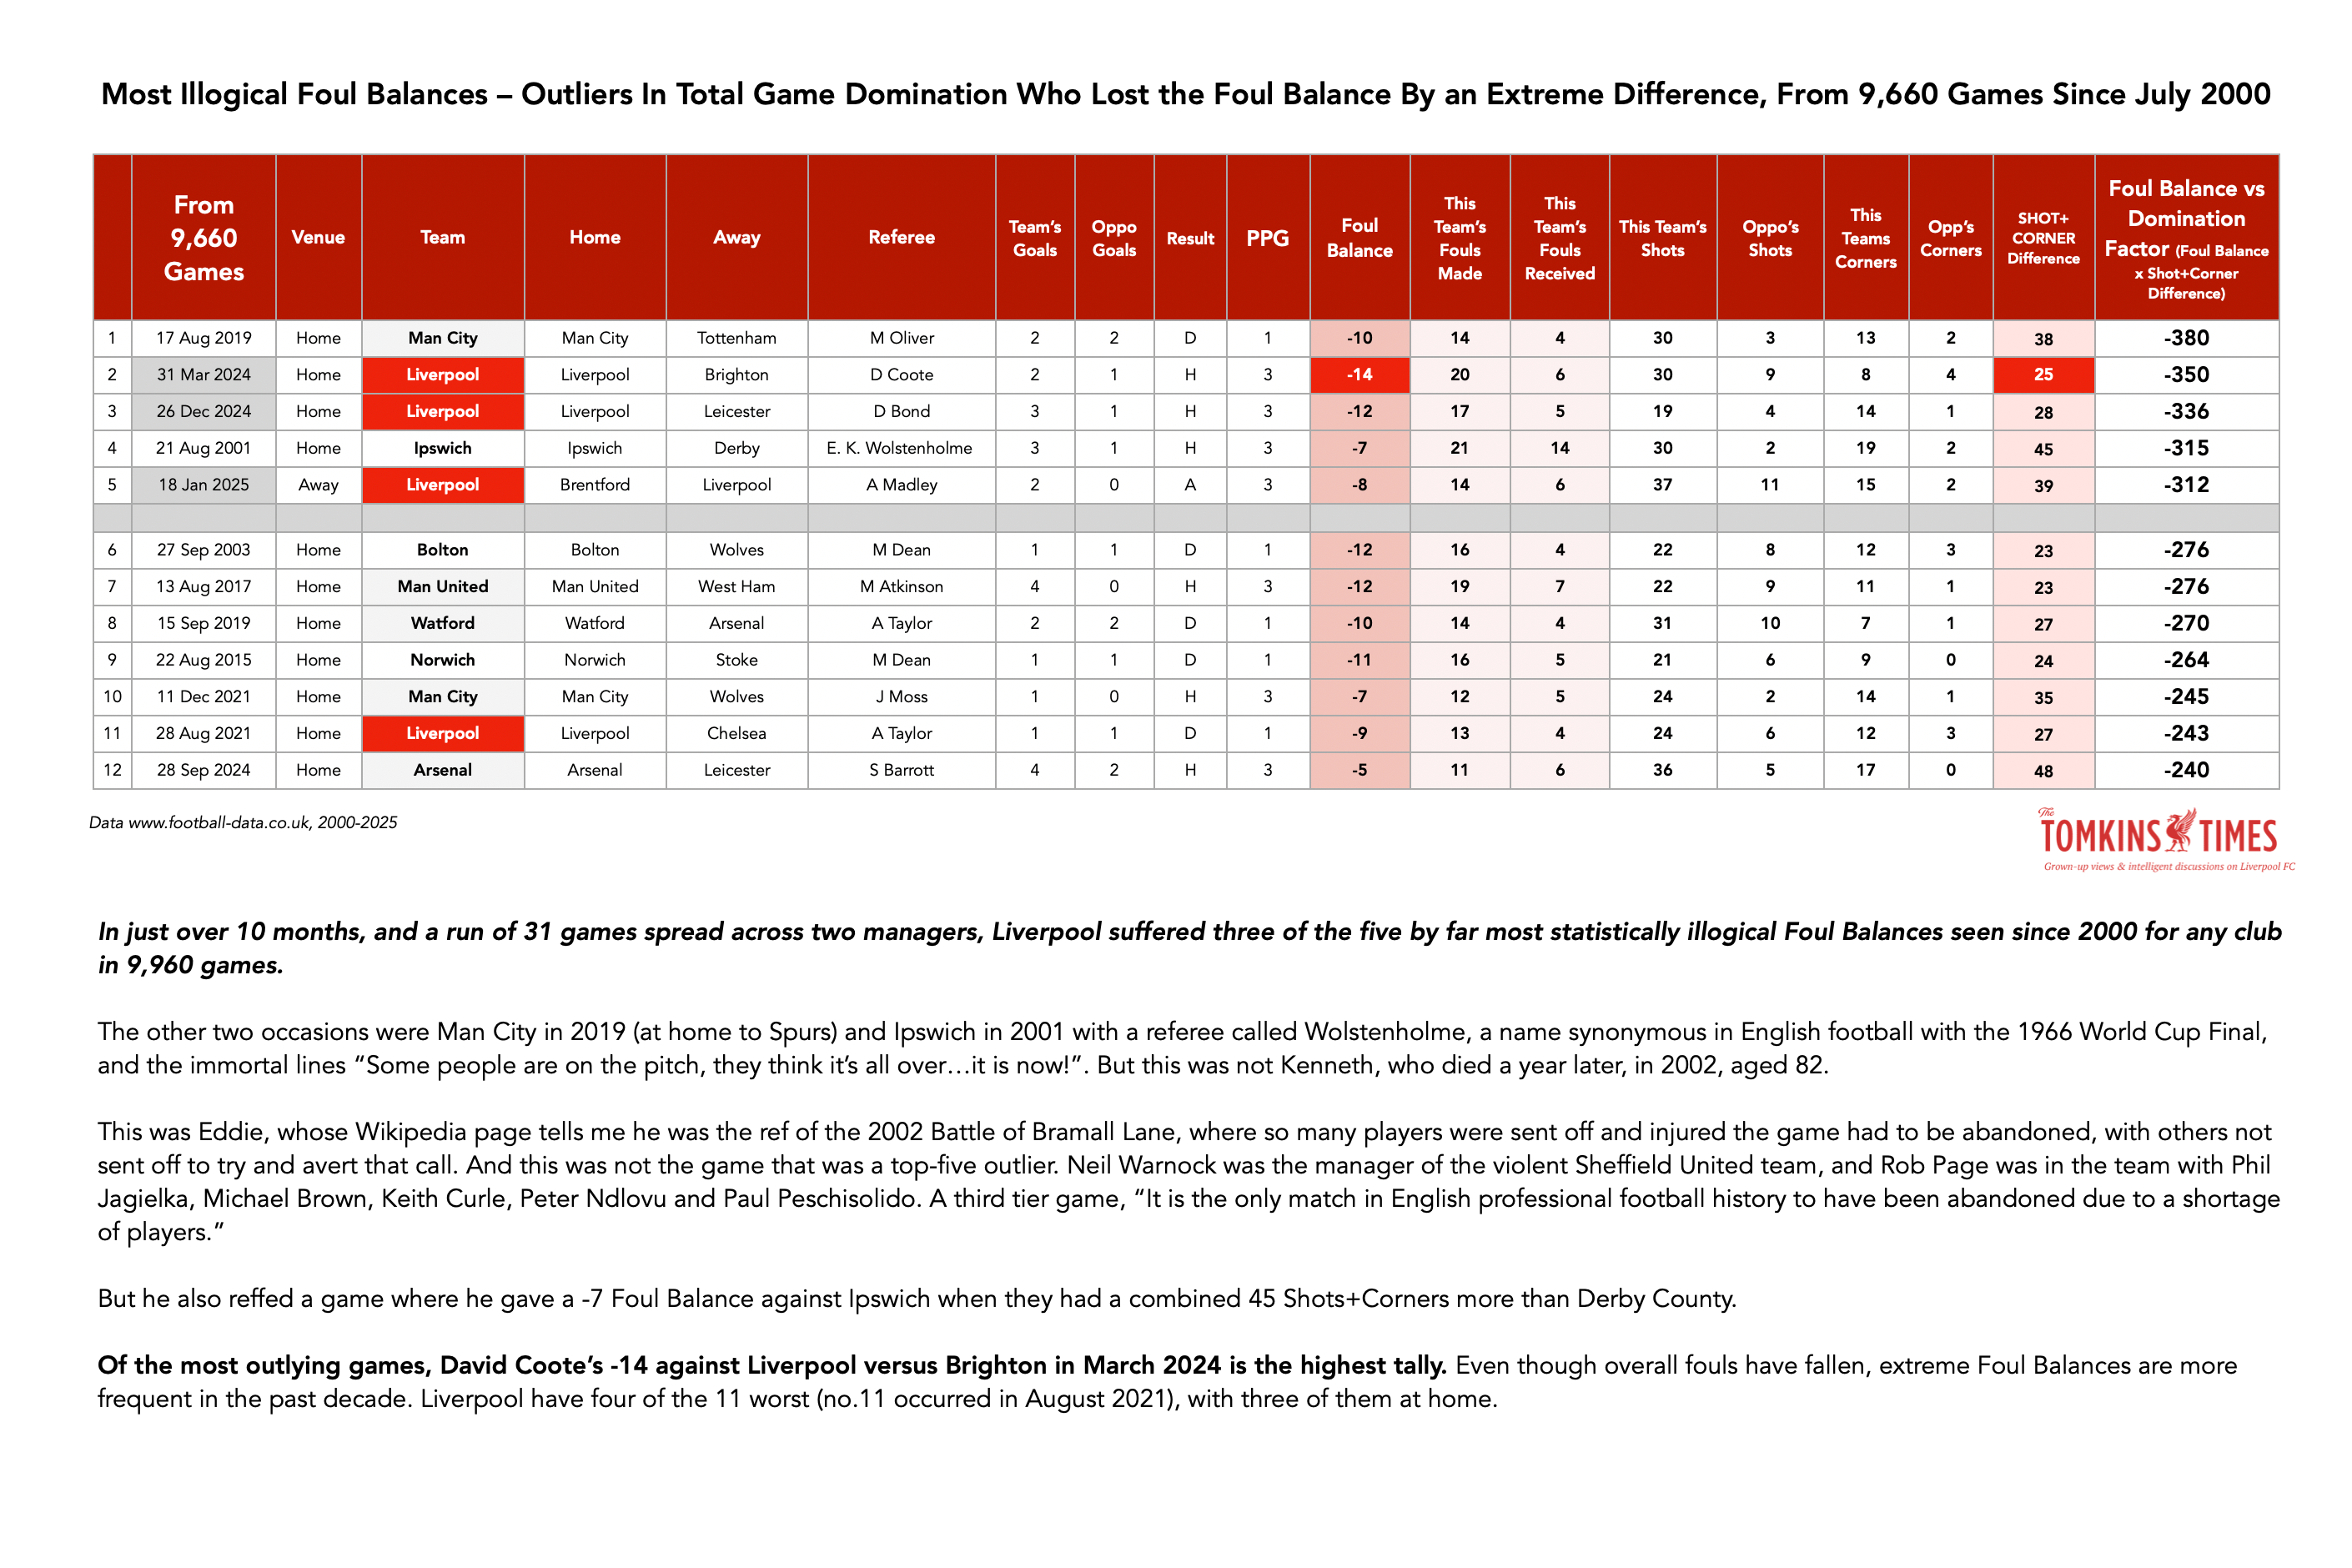
Liverpool have three of the five most illogical Foul Balances, and four of the 12 worst. All since 2021. And the Coote game against Brighton is the worst Foul Balance in this list.
Coote’s own data gets weirder and weirder. These are -12 Foul Balances or worse by referee, where 187 instances were whittled down to just 35 since December 2019.
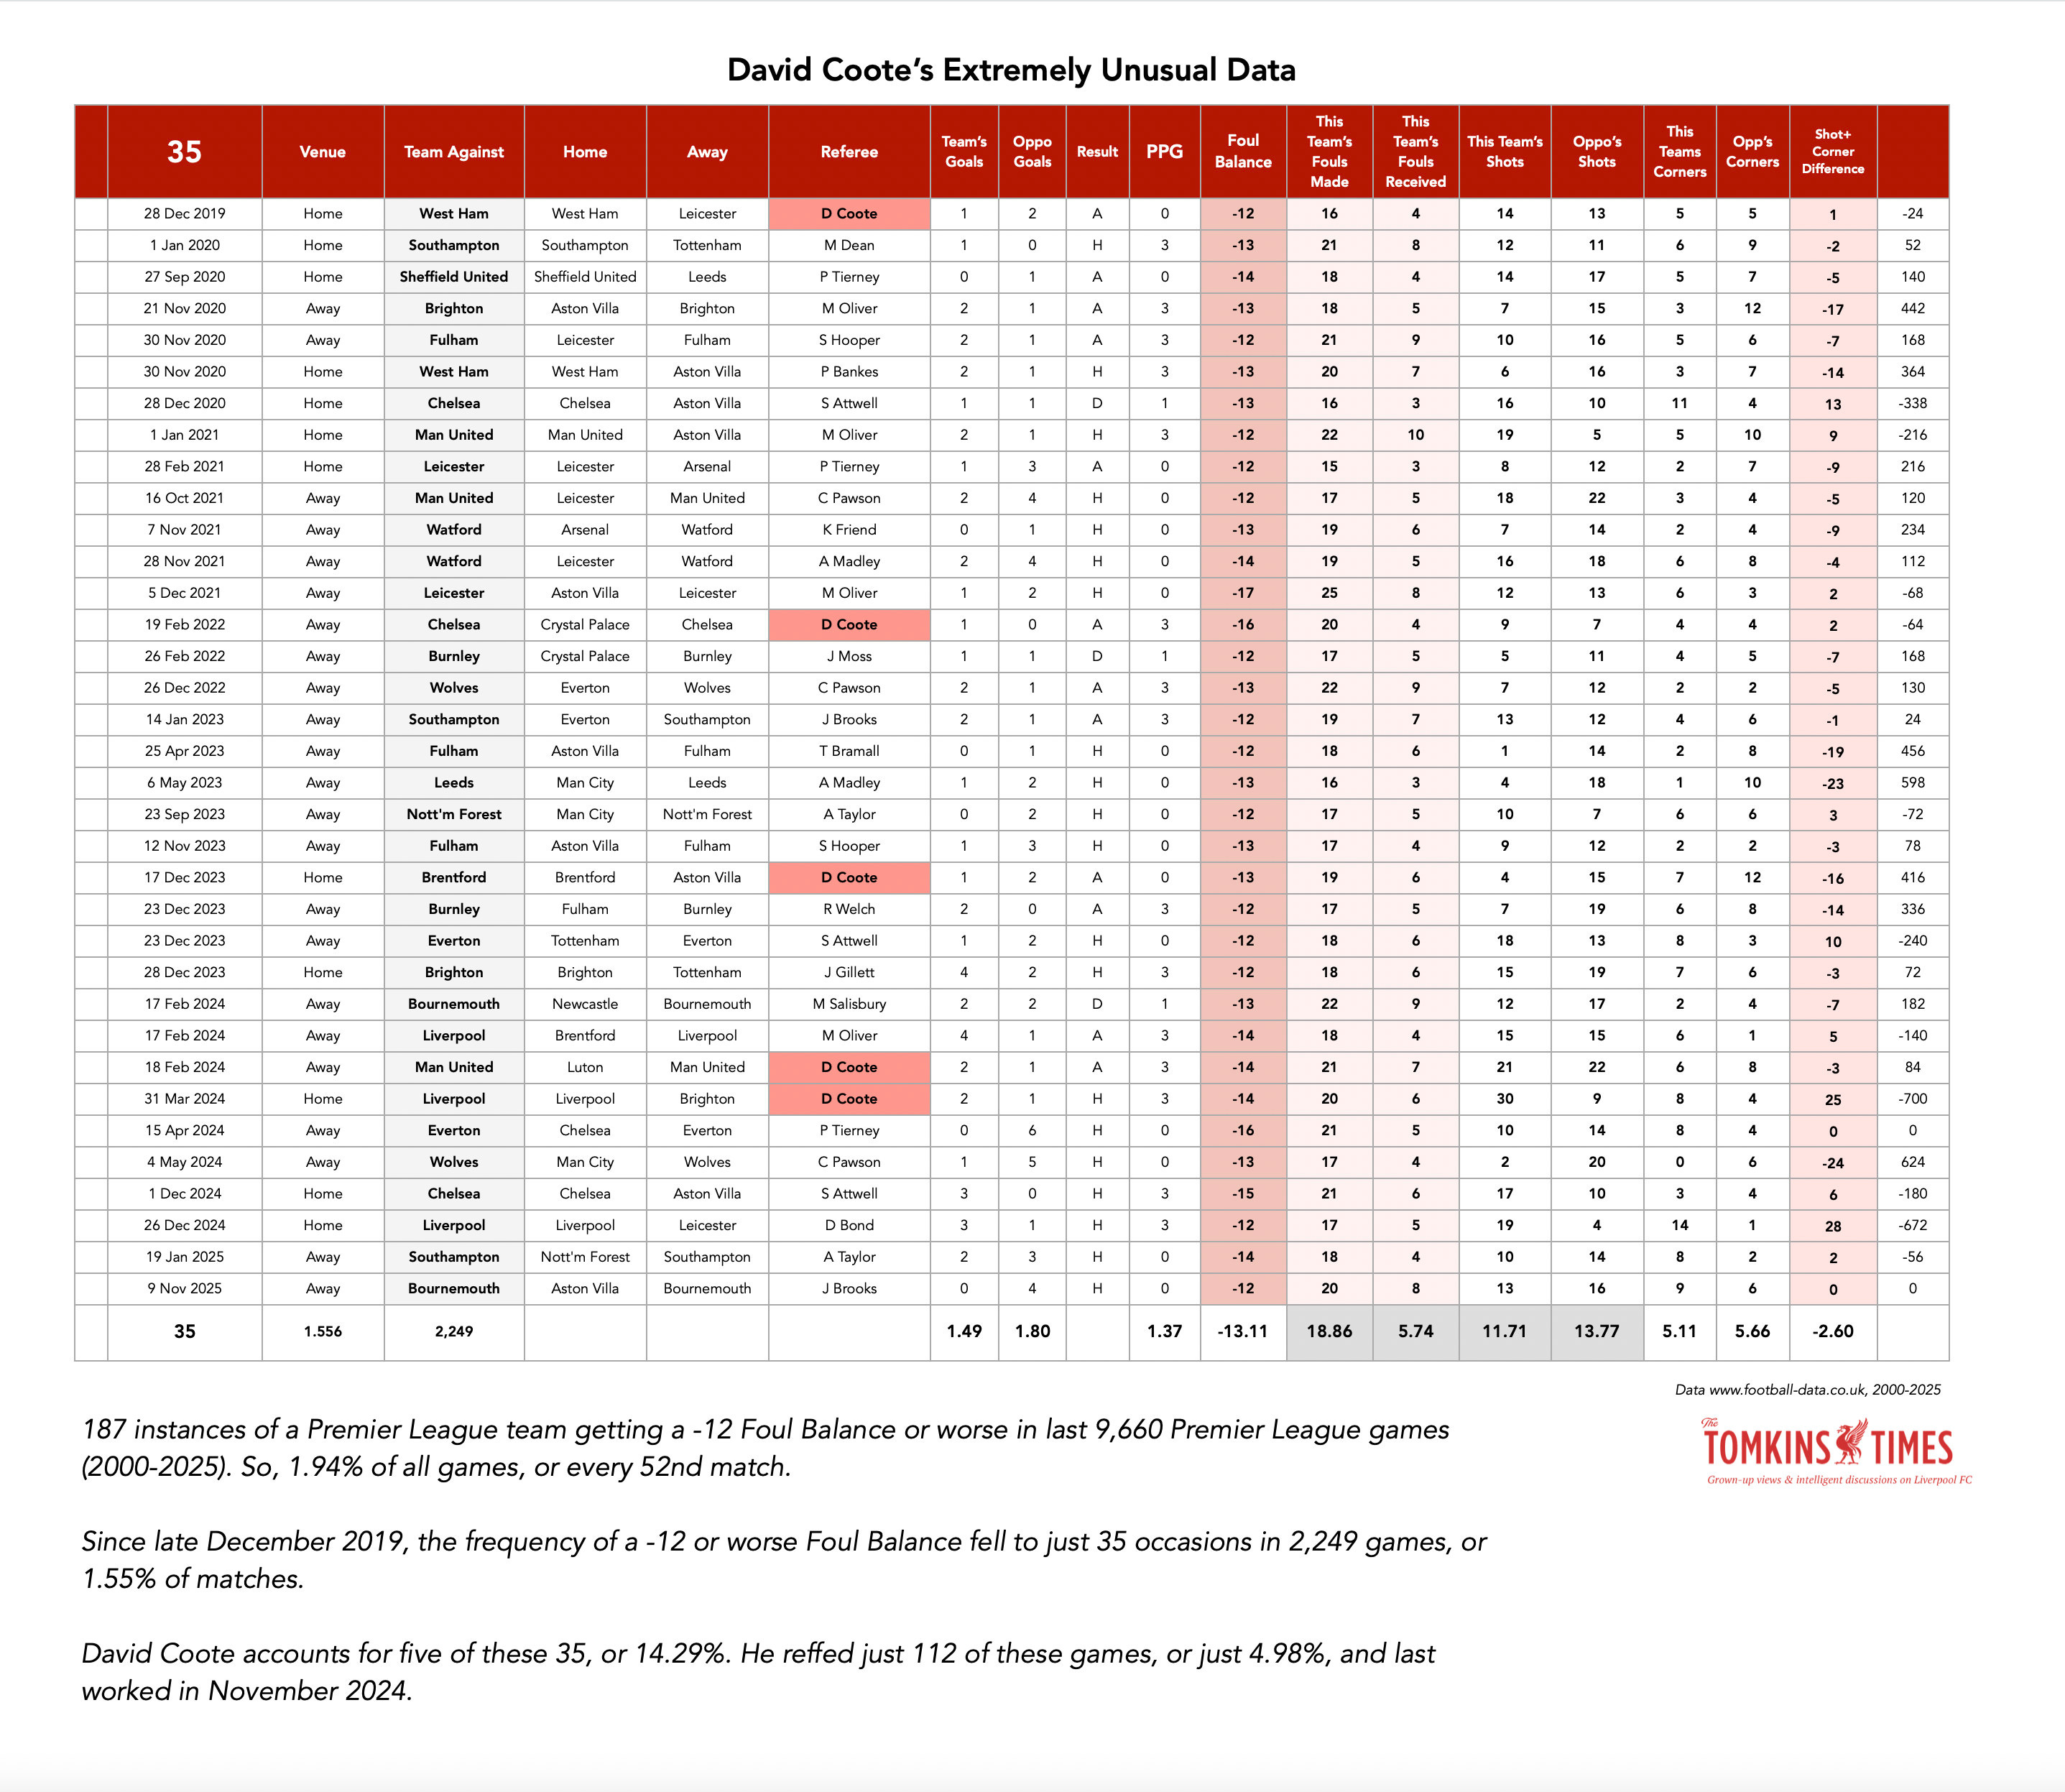
How can one man give so many unusual Foul Balances? And where they don’t match the actual game balance?
Now if we go to the ultra-rare -13 and worse:
Now onto some VAR stuff.

And Finally…
#LiVARpool
And that, as they say, is that. I’m off to deep-fry my brain.
Keep reading with a 7-day free trial
Subscribe to The Tomkins Times - Main Hub to keep reading this post and get 7 days of free access to the full post archives.