


The Warped, Unfair Foul Balances Liverpool Suffer Is PROVABLE, and Slot Surely Knows It
Using possession/foul data to show why Slot is right to be driven crazy

***No wonder Arne Slot is losing his cool. As a hard and fast, provable rule, more possession = winning more fouls in the league on average, except for Liverpool and Man United, albeit is much worse for Slot’s men***
In the Premier League, a higher possession percentage massively correlates with a more positive (beneficial) Foul Balance.
Except ... for Man United (to a small degree), and Liverpool, to an astonishing, mind-boggling, inexplicable degree.
Note: please share this post or any of its details/graphs if you feel it’s important.
I’ll explain more as the piece unfolds (it’s not one of my longer officiating pieces), but I’ll start with a few standout facts.
This is looking at the best part of 1,000 Premier League games since 2022.
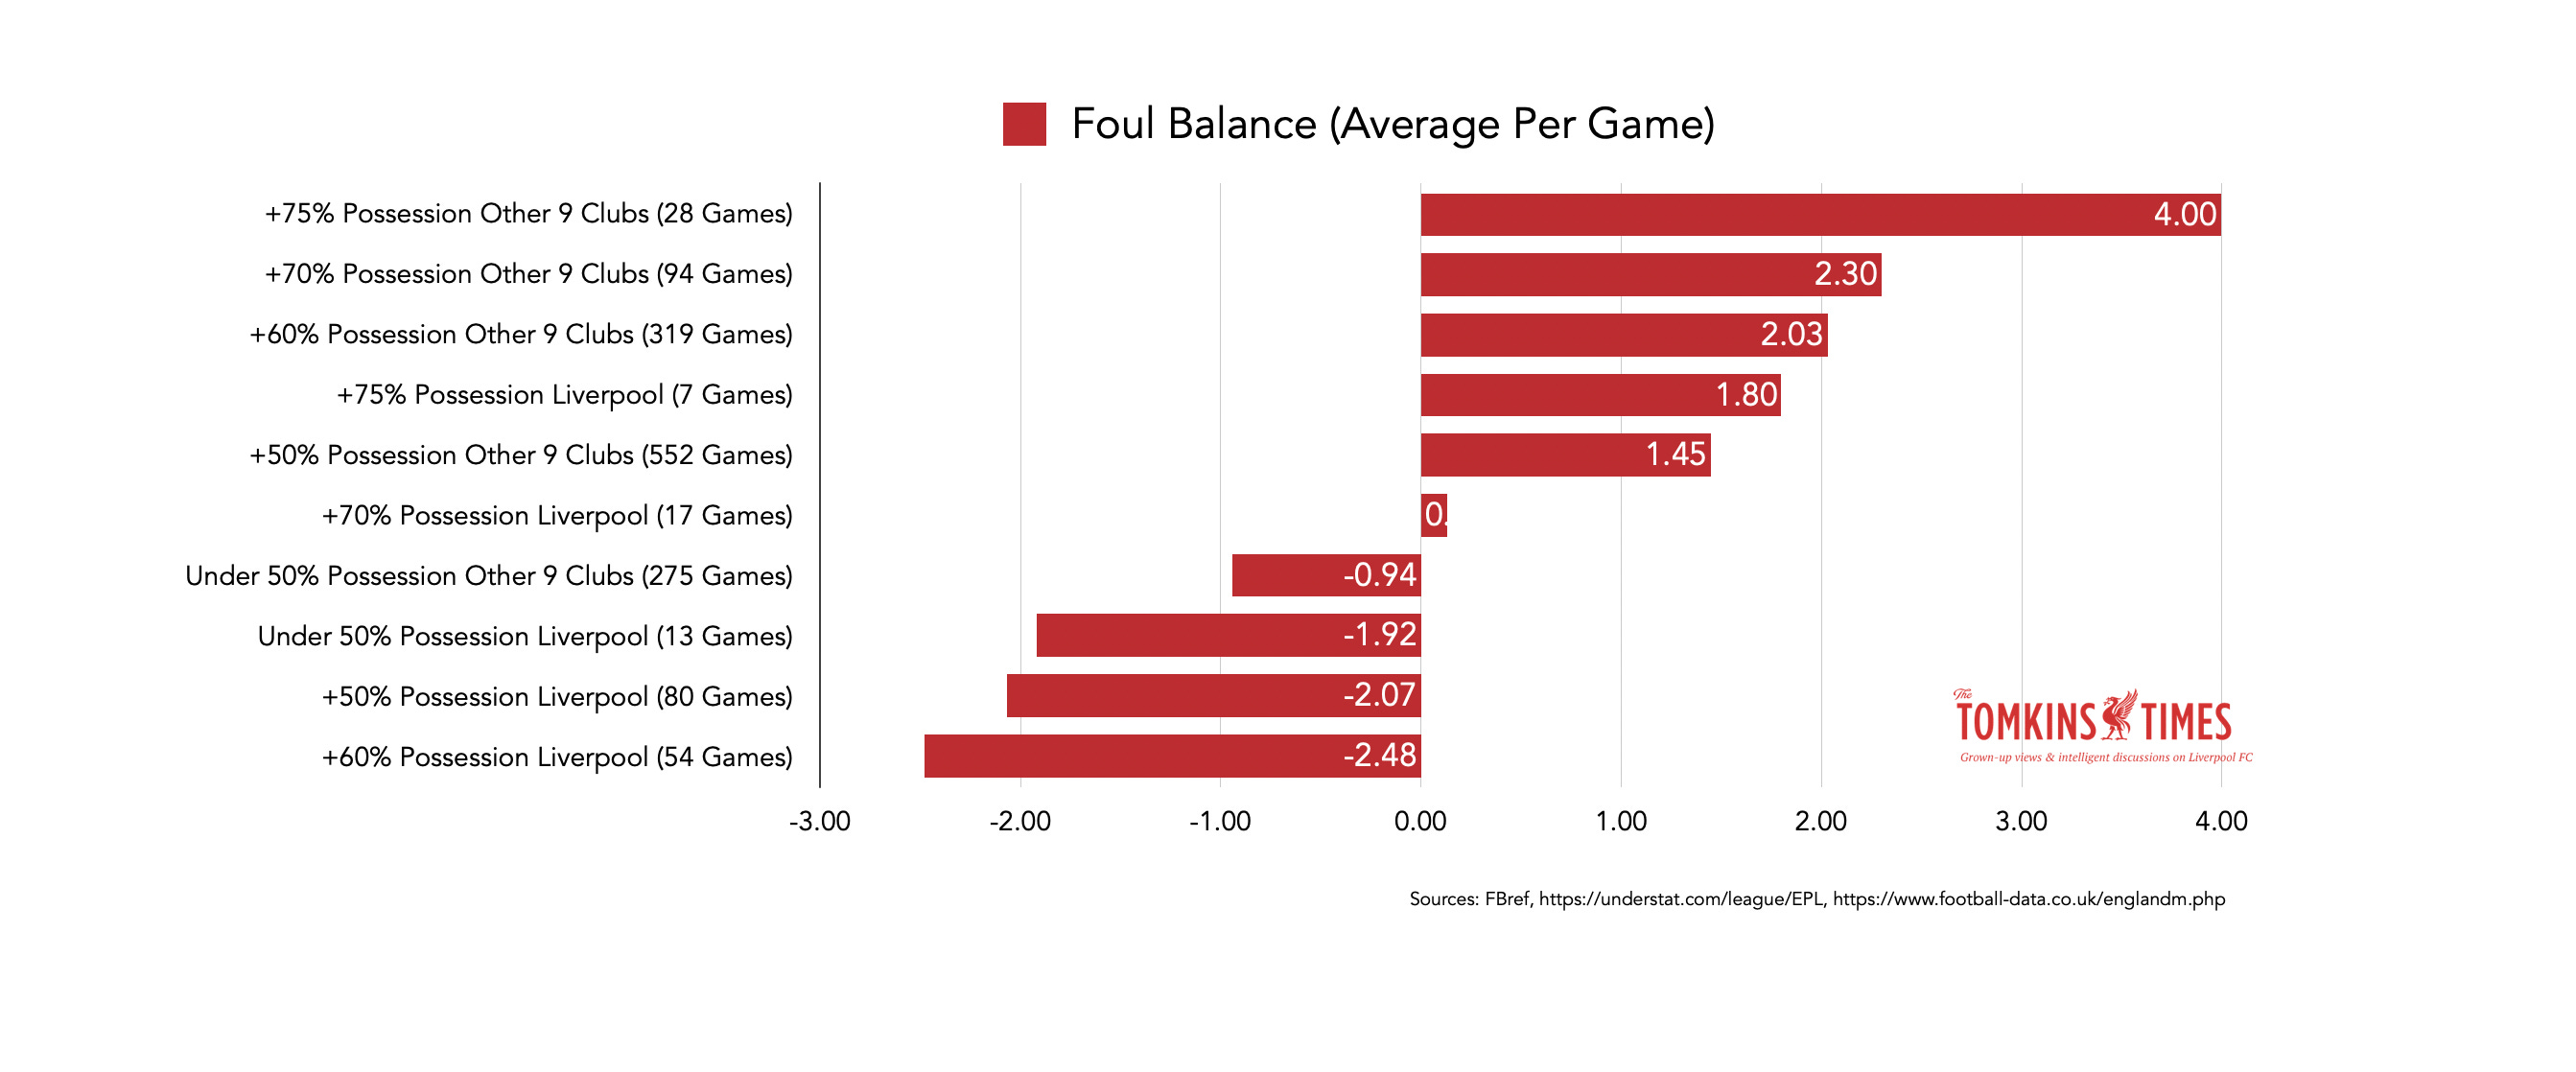
On average, to ‘win’ the Foul Balance, a team just needs +50% possession, as would seem entirely logical.
On average, for Liverpool to win the Foul Balance, the Reds need to average +70% possession.
Mathematicians amongst you will notice that this is fucking crazy.
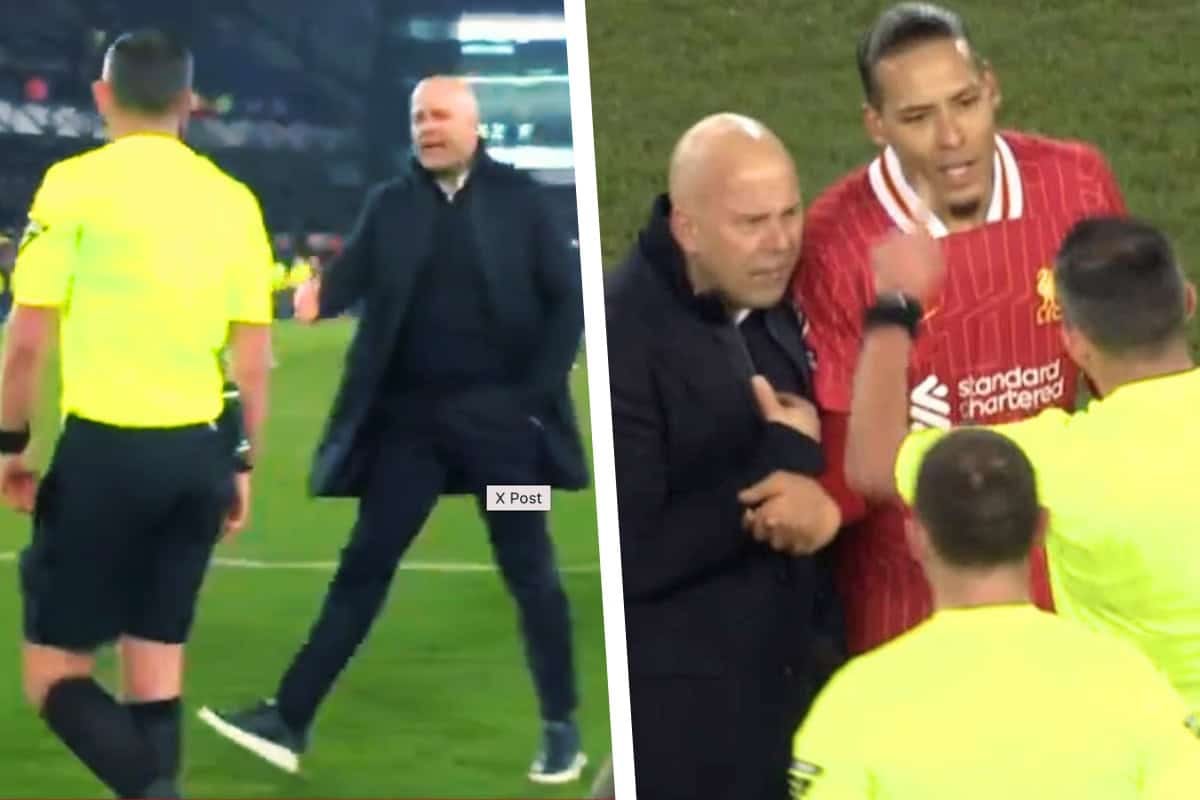
The Goodison derby was so badly officiated that I had to unarchive the old spreadsheets and get this out ASAP. I’m sick to death of doing this, but as no one else seems prepared to, I guess it’s down to me.
The game was there to be won when Mo Salah was taken out with a yellow-card (at least) foul as he neared the opposition box, and potential DOGSO, but Michael Oliver, as he did when Jeremy Doku karate-kicked Alexis Mac Allister, ran away; except this time he had a good view, and was close to play. Just as David Coote had when Salah was grabbed, pulled and tripped against Aston Villa.
I appreciate that refereeing is increasingly difficult, but I also want and expect fairness, and professional standards.
(With Michael Oliver having just received death threats from some unhinged Arsenal fans – all clubs have them – then immediately appointing him for the derby that equally affects Arsenal seems utterly insane. And yet normal.)
Salah being absolutely taken out a minute or two before the (initially due) end of added time was just one of many fouls not given to Liverpool, in a game that ended with a -11 Foul Balance; which, even when not adjusted for possession share, is 99th percentile for unlikeliness since 2019 (see previous articles for data going back to 2019), and over 2,000 games.
Adjusted for possession and it’s bonkers.
But also, provably par for the course with Liverpool being treated to all other teams, including those who press even harder (so it’s not the pressing).
While I expected to find a strong correlation between possession and Foul Balance, this is perhaps the strongest finding I’ve ever had when parsing football data: the correlation between possession and Foul Balance reaches r1, or 100%, in various categories, and overall, has a 94% correlation in the five possession-bands I chose to look into.
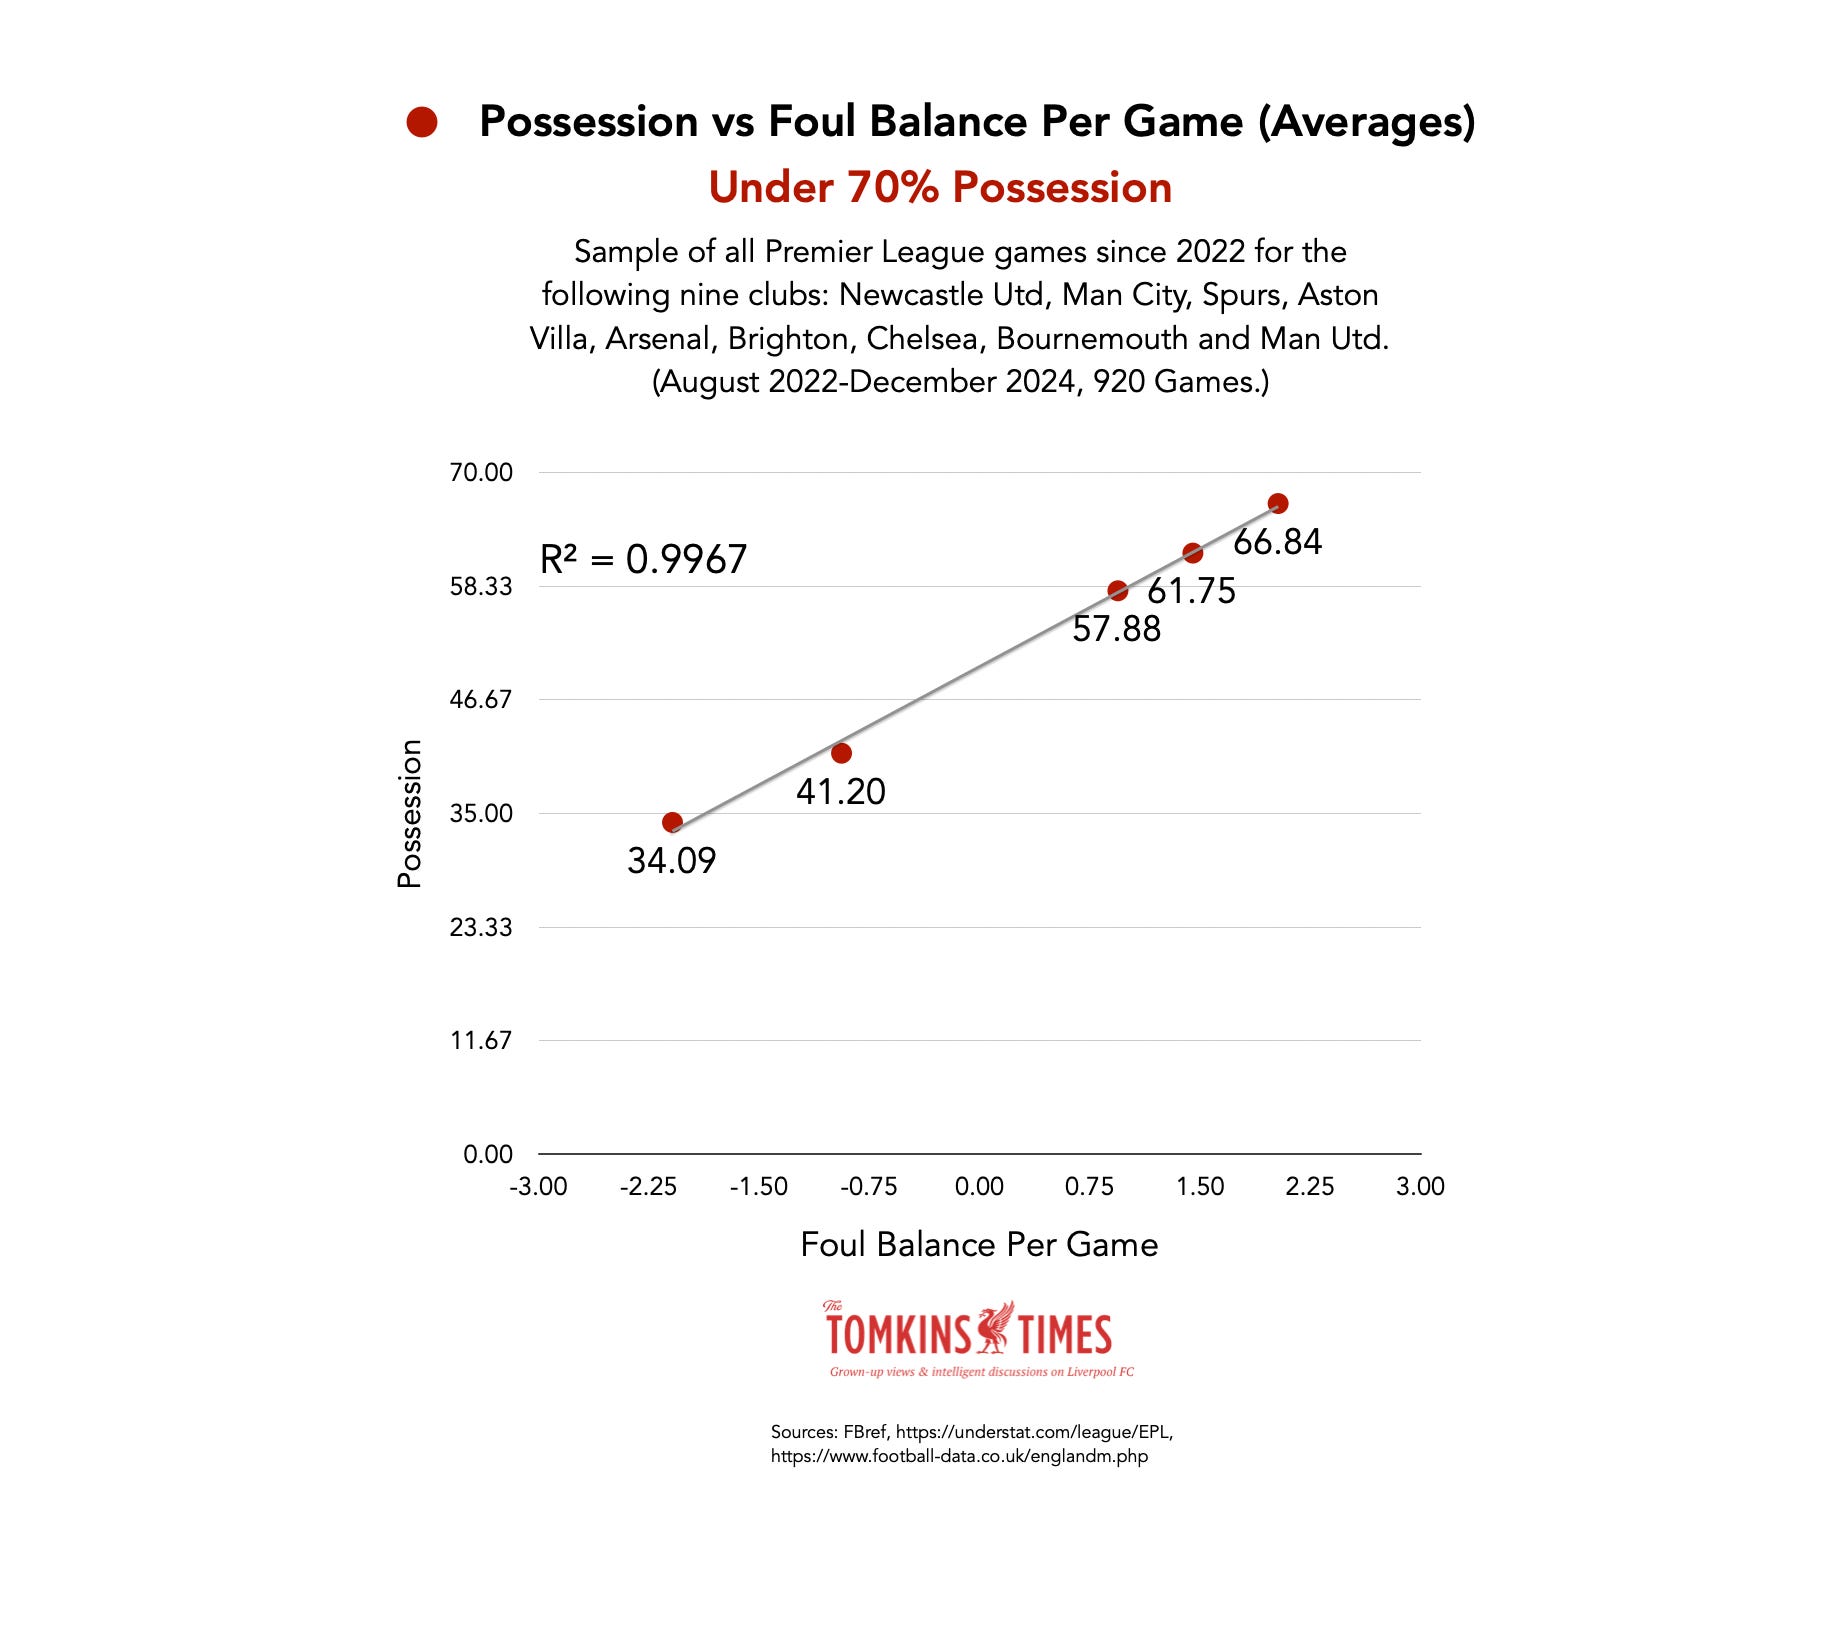
I’ll explain the charts below later, but briefly, the relationship between possession and Foul Balance, and then, the games where a team has had 60% possession or more since 2022. (Update: see further down for more data to prove this trend.)
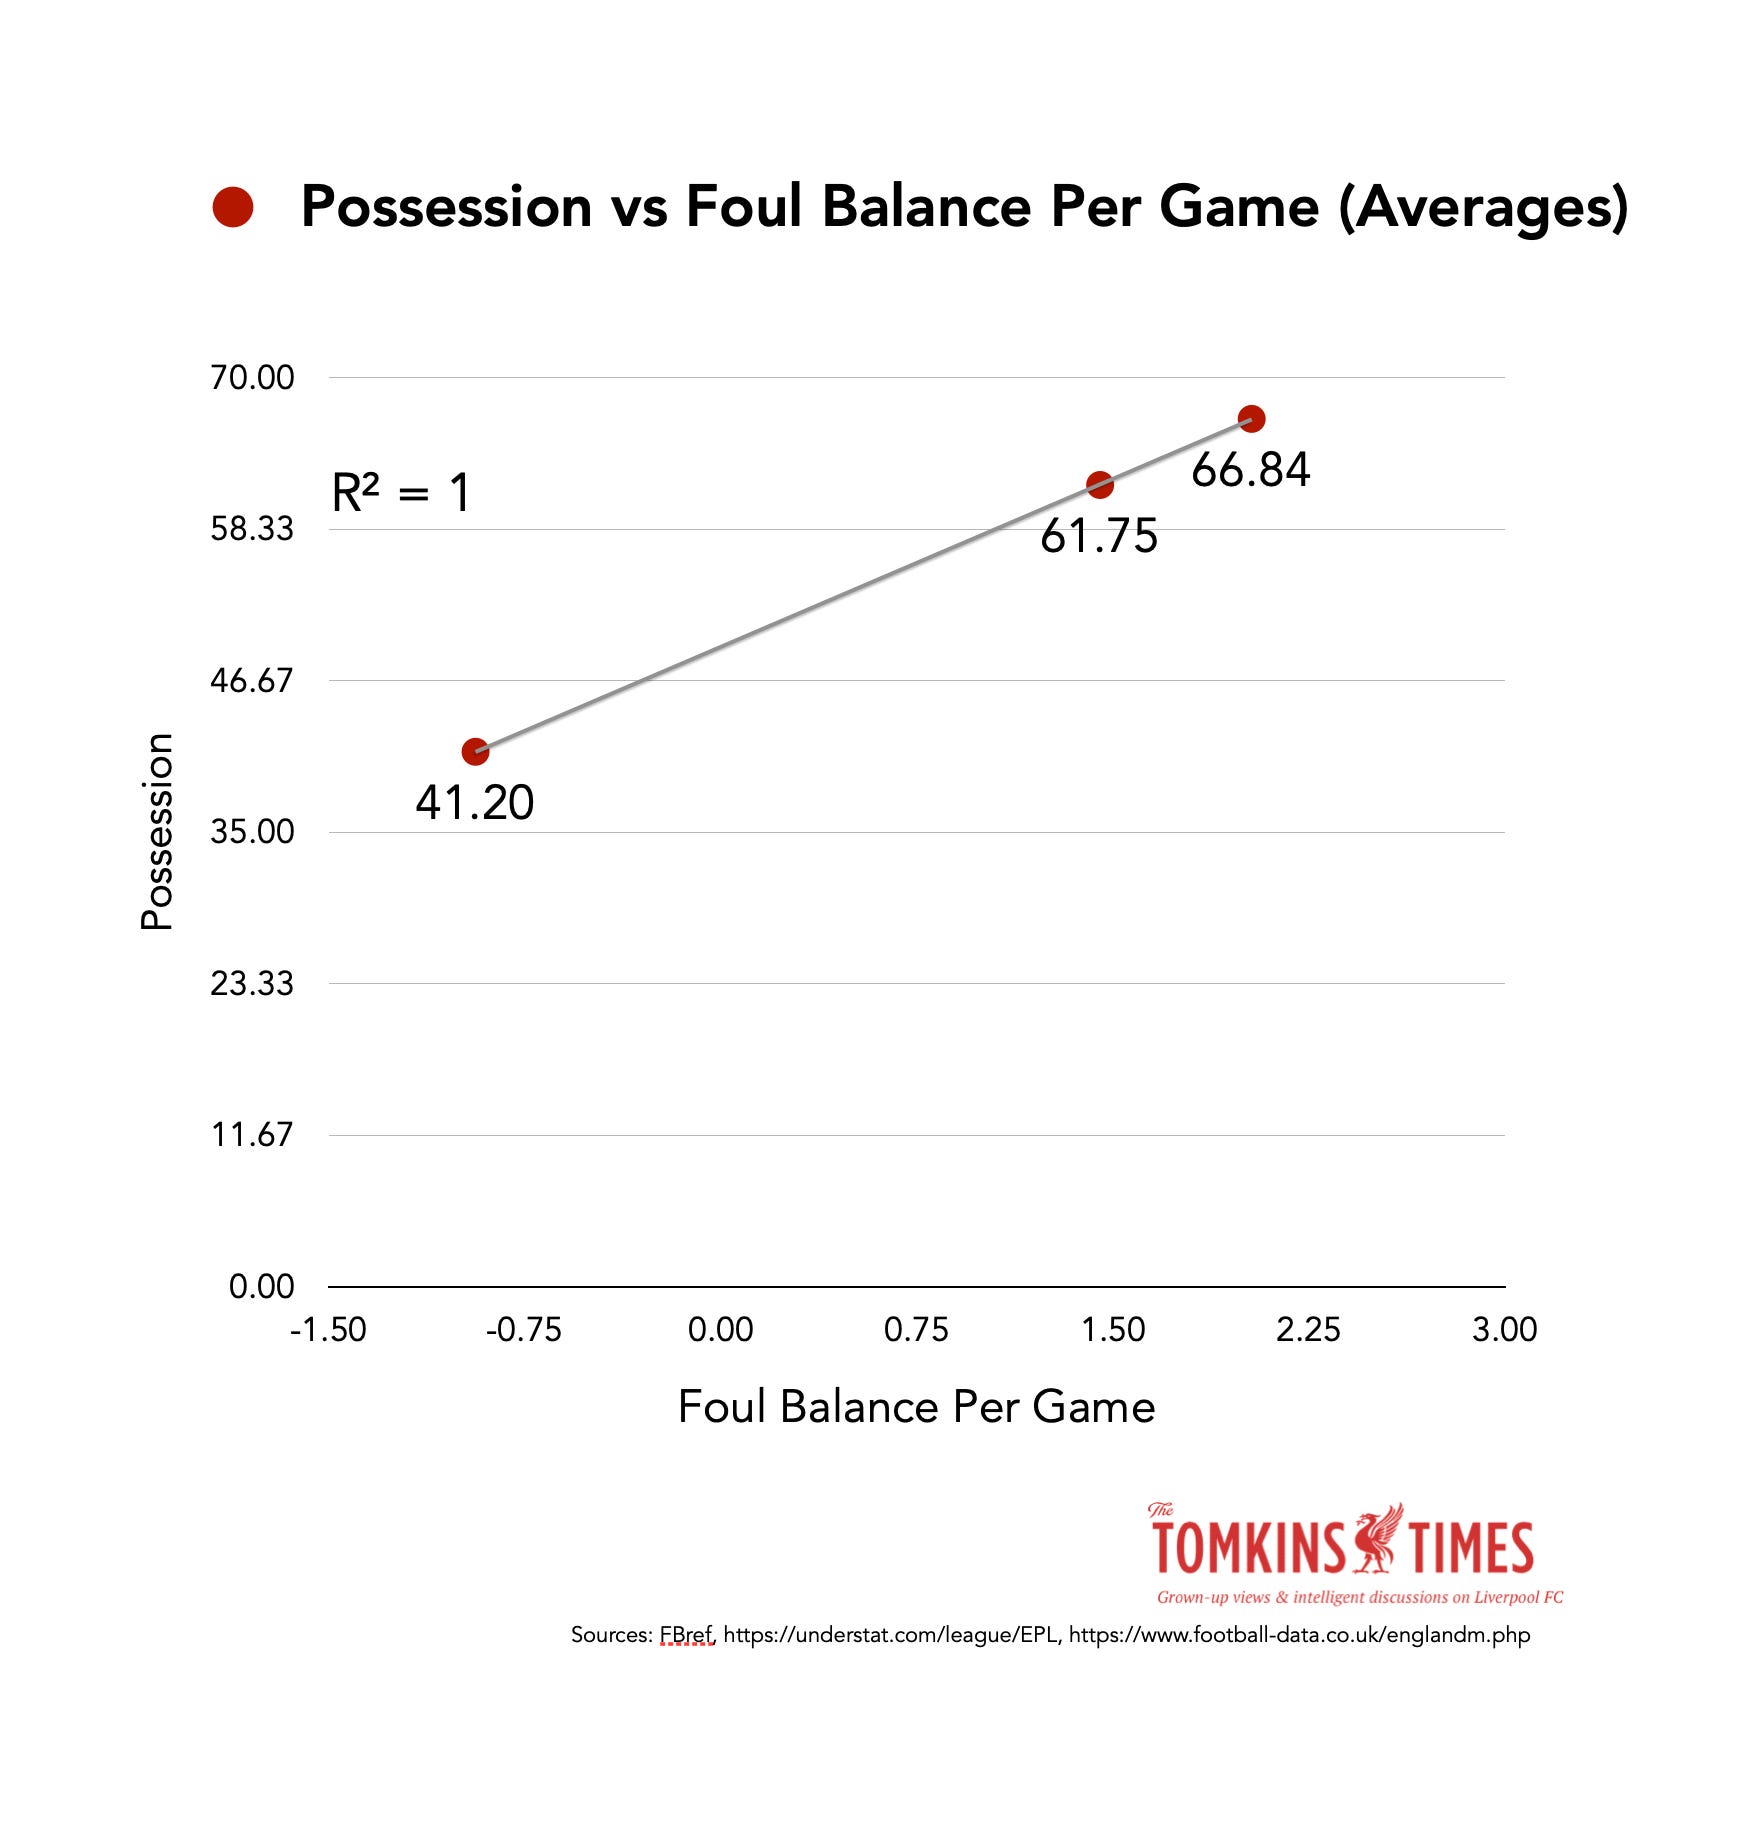
Such is the “rational” increase in Foul Balance in relation to possession that it comes out at r=1, or 100% correlation. Now, correlation doesn’t equal causation, but …
Next, all games where the teams I covered had +60% possession, when adding Liverpool’s most recent matches, and doing the same for Spurs with a separate Ange Postecoglou entry.

(As an aside, Arsenal have just won at Leicester as I get ready to publish this, but Liverpool, it should be noted, have just had a load of away games, and are about to have a load more away games. Then, in the run-in, a ton of home games. And bar the Everton game, ruined by the ref, the underlying numbers remain by far the best in the Premier League. But I digress…)
There are lots more ways to slice and divide the data, but I wanted to get something published before the Wolves game, given how serious this is; plus, it takes days of work, and you can always turn that into weeks of work. Plus, this is all built on the foundation of years of work.
Finally, this article is around 3,000 words, and that seems manageable to both write and expect people to read. I hope I’ve explained everything clearly, but apologies if I haven’t. The data is correct as far as I know, and taken directly from public football data sources (thank you to Andrew Beasley for showing me where to access the fouls data).
I don’t wish to say that other clubs don’t deserve whatever decisions they get; I just want Liverpool to be treated the same. Indubitably, they are not.
Methodology
Previously, I had possession (and xG) data and other details in one database, and Foul Balances in another.
Foul Balance is what I call a team’s tally when fouls conceded is subtracted from fouls won. Winning more fouls than conceding equals winning the Foul Balance.
The normal assumption would be that the more you have the ball, the fewer fouls you make, and the more the opposition has to make.
This is indeed true.
Just not for Liverpool, and to a far lesser extent, Manchester United (who achieve high possession less frequently, and have a lower possession average even at the different higher levels).
It takes time to combine two disparately formatted databases, but after the weirdness at Goodison (which Arne Slot had foreseen when watching last season’s game, ahead of the postponed match this winter), I’ve now done so for all Premier League games 10 ‘major’ clubs since 2022.
These are: the Big Six; and the new pretenders (Newcastle, Aston Villa as recent Champions League participants); and the ‘modern playing style’ teams of Bournemouth and Brighton. Of all of these, only Bournemouth are ‘newly good’.
This is not to say other teams would not make it interesting, but bar one, these are all higher-than-average possession teams, albeit Man United are fairly low possession for a Big Six team.
Arsenal
Aston Villa
Bournemouth
Brighton
Chelsea
Liverpool
Man City
Man Utd
Newcastle Utd
Spurs
They should all make for good comparisons with Liverpool, as many have aggressive pressing styles, and some are very physical teams.
It makes sense to compare only fairly recent Premier League data, and I went back to 2022 as it gave a big enough sample, without going too far back in time, where patterns may be different.
In the 920 games listed in the dataset, these teams average 55.5% possession.
Nine of the teams average over 50%; apart from Bournemouth, 42.81%. Liverpool average a shade over 60%, and Man City 65%.
Man United, Newcastle and Aston Villa all average in the very low 50s for possession percentage since 2022.
The gamut of per-game possession runs down from the high of 82% (Liverpool vs Sheffield Utd, 4th April 2024, and the last game of Jürgen Klopp’s tenure that I attended), down to 21%, for Bournemouth at Arsenal (4th March 2023).
Of the 920 games, there is some double-counting; the above example ranks as the lowest, as stated, for Bournemouth (920th), who are included, and Arsenal’s possession that day ranks 7th overall, at 79%. But to get averages, we need to have a team as the subject and also, at times, the opponent.
Sheffield Utd comprise four of the seven worst possession figures, but only appear as an opposition team, as they are not part of the 10 clubs covered.
Arsenal also have the 2nd-worst possession figure, at 23%, from this season’s 10-man rearguard action at Man City.
I combined the averages of all the 10 clubs, but then combined the averages of The Other Nine Clubs, removing Liverpool, to compare Liverpool against them.
Also, I look at pressing later in the piece (PPDA is a good proxy for pressing), to see if that plays a part. (It doesn’t.)
All data is Premier League only, and sourced via a combination of FBref, Understat, and football-data.co.uk.
Results
Two possession sets that perfectly correlate with an increase in Foul Balance (100%! r=1, “r= 1 means there is perfect positive correlation) are the sets that include all games with over 50% possession and all games with over 60% possession.
(However, it remains at r=1 with a third data set combined, and as I’ve added via an update, via all data dealing with possession below 70%.)
319 games with +60% possession
552 games with +50% possession
+60% (Average 66.84%) +2.03 Foul Balance
+50% (Average 61.75%) +1.45 Foul Balance
Ergo, in the extra games where the possession is over 60%, the increase in Foul Balance will rise in perfect synch from all possession games at over 50%.
If you take out either of the sets of results at +70% possession (so, +70% and +75%), the model goals from 94% accuracy to 98% accuracy.
Similarly, if you look at all the categories under 70% possession, then the model rises to r2=1, or 100%.
Think of it as every move up the graph, there is an equal move across the graph. That’s what r2 analysis is – matching one axis against the other and seeing if there’s a natural pattern, or correlation. The better the match, the closer to 1, or 100%, it is.
The sample sizes for these are 319, 552 and 275 respectively. So, not small sample sizes.
Over 70%, and there will be fractionally higher Foul Balance than expected, and above 75%, slightly lower. These are obviously rarer games, with smaller sample sizes.
Any random minor tweaks of any of the data throws the model out of whack, so this is fairly mind-blowing.
The data was correct up to December 14th 2024, but in some separate tables, as noted elsewhere, I have added Liverpool’s data since then (up to before the Wolves match), as well as Spurs’ just under Ange Postecoglou’s entire reign, as the hardest-pressing team in English football during his tenure. (His team have also had more than 60% possession 33 times since he arrived in the summer of 2023, albeit interestingly, after Spurs failed to persuade Slot to join them.)
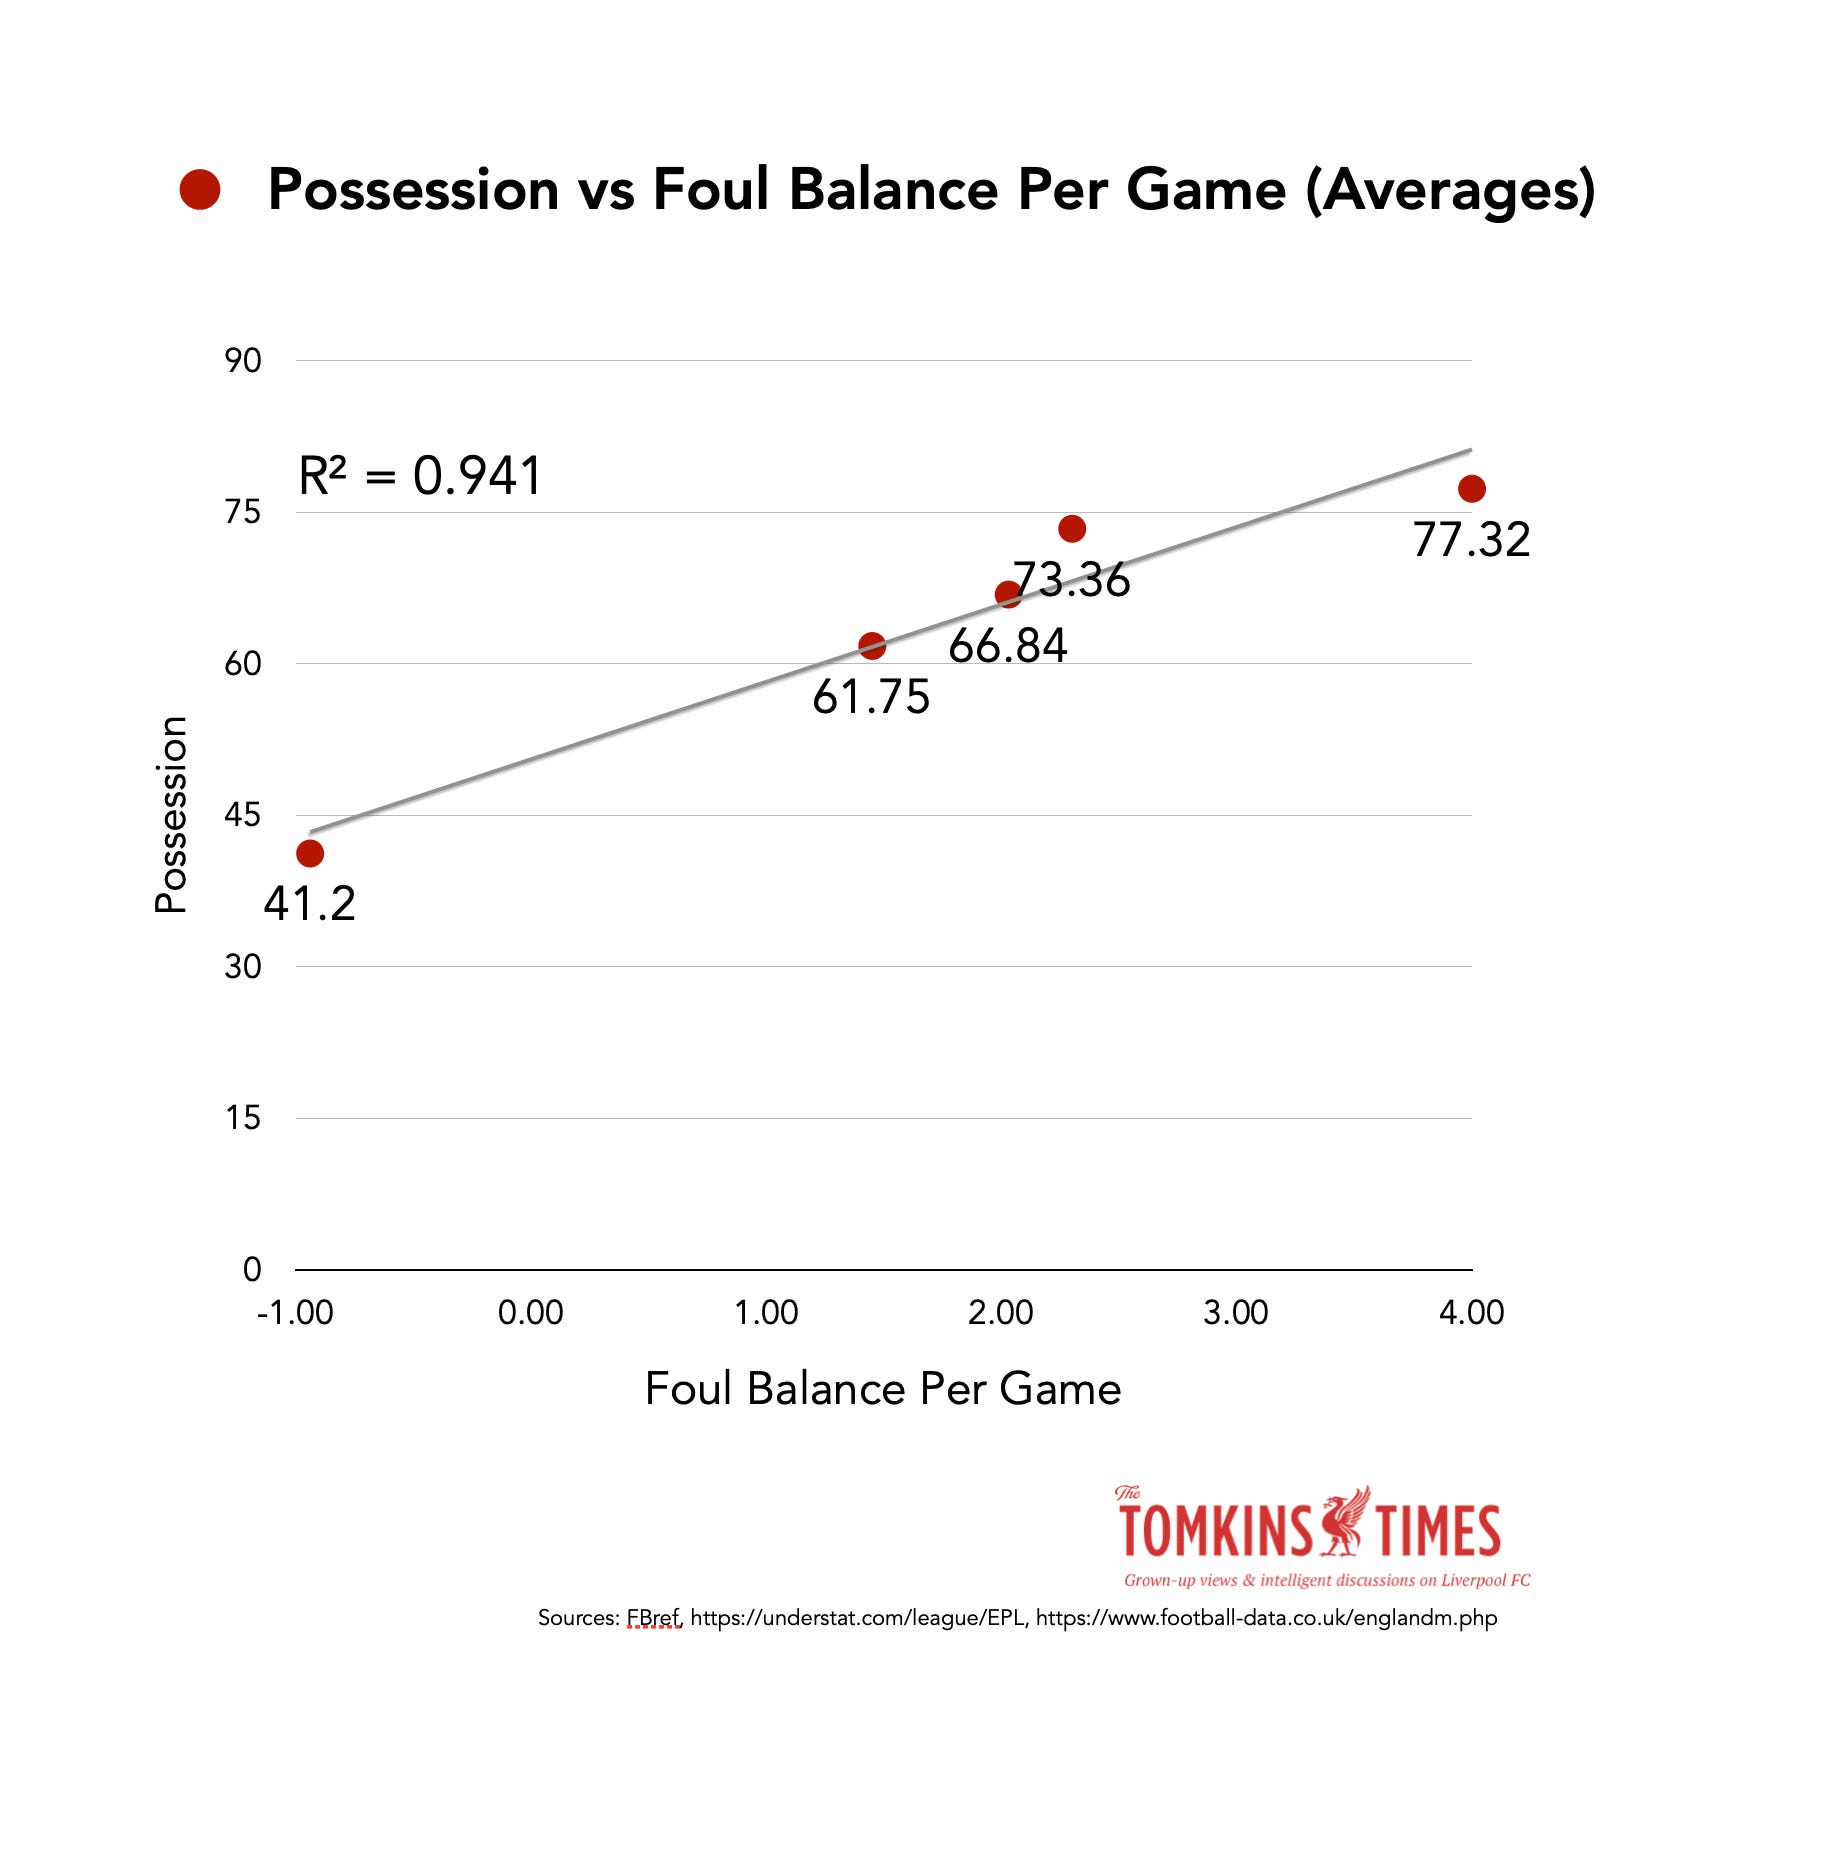
Update interlude: I’ve added some more possession bands, and the pattern remains the same. Indeed, it strengthens the argument for all possession bands, up to 0.97, or 97%. However, the other possession bands keep the correlation with Foul Balance at virtually 100% when possession is below the 70% possession mark (where the sample size is below 100 per band, unlike the other categories, which include hundreds of games; for instance, the nine included clubs had more than 50% possession in 632 games). And…

… Basically, for any possession average under 70%, it’s a 99.9% match between Foul Balance and possession, with Foul Balance improving in line with additional possession up to 70% possession, when it only slightly deviates above or below the trend-line.
Update: And I’ve added the table below, that shows just how different Liverpool’s data is.

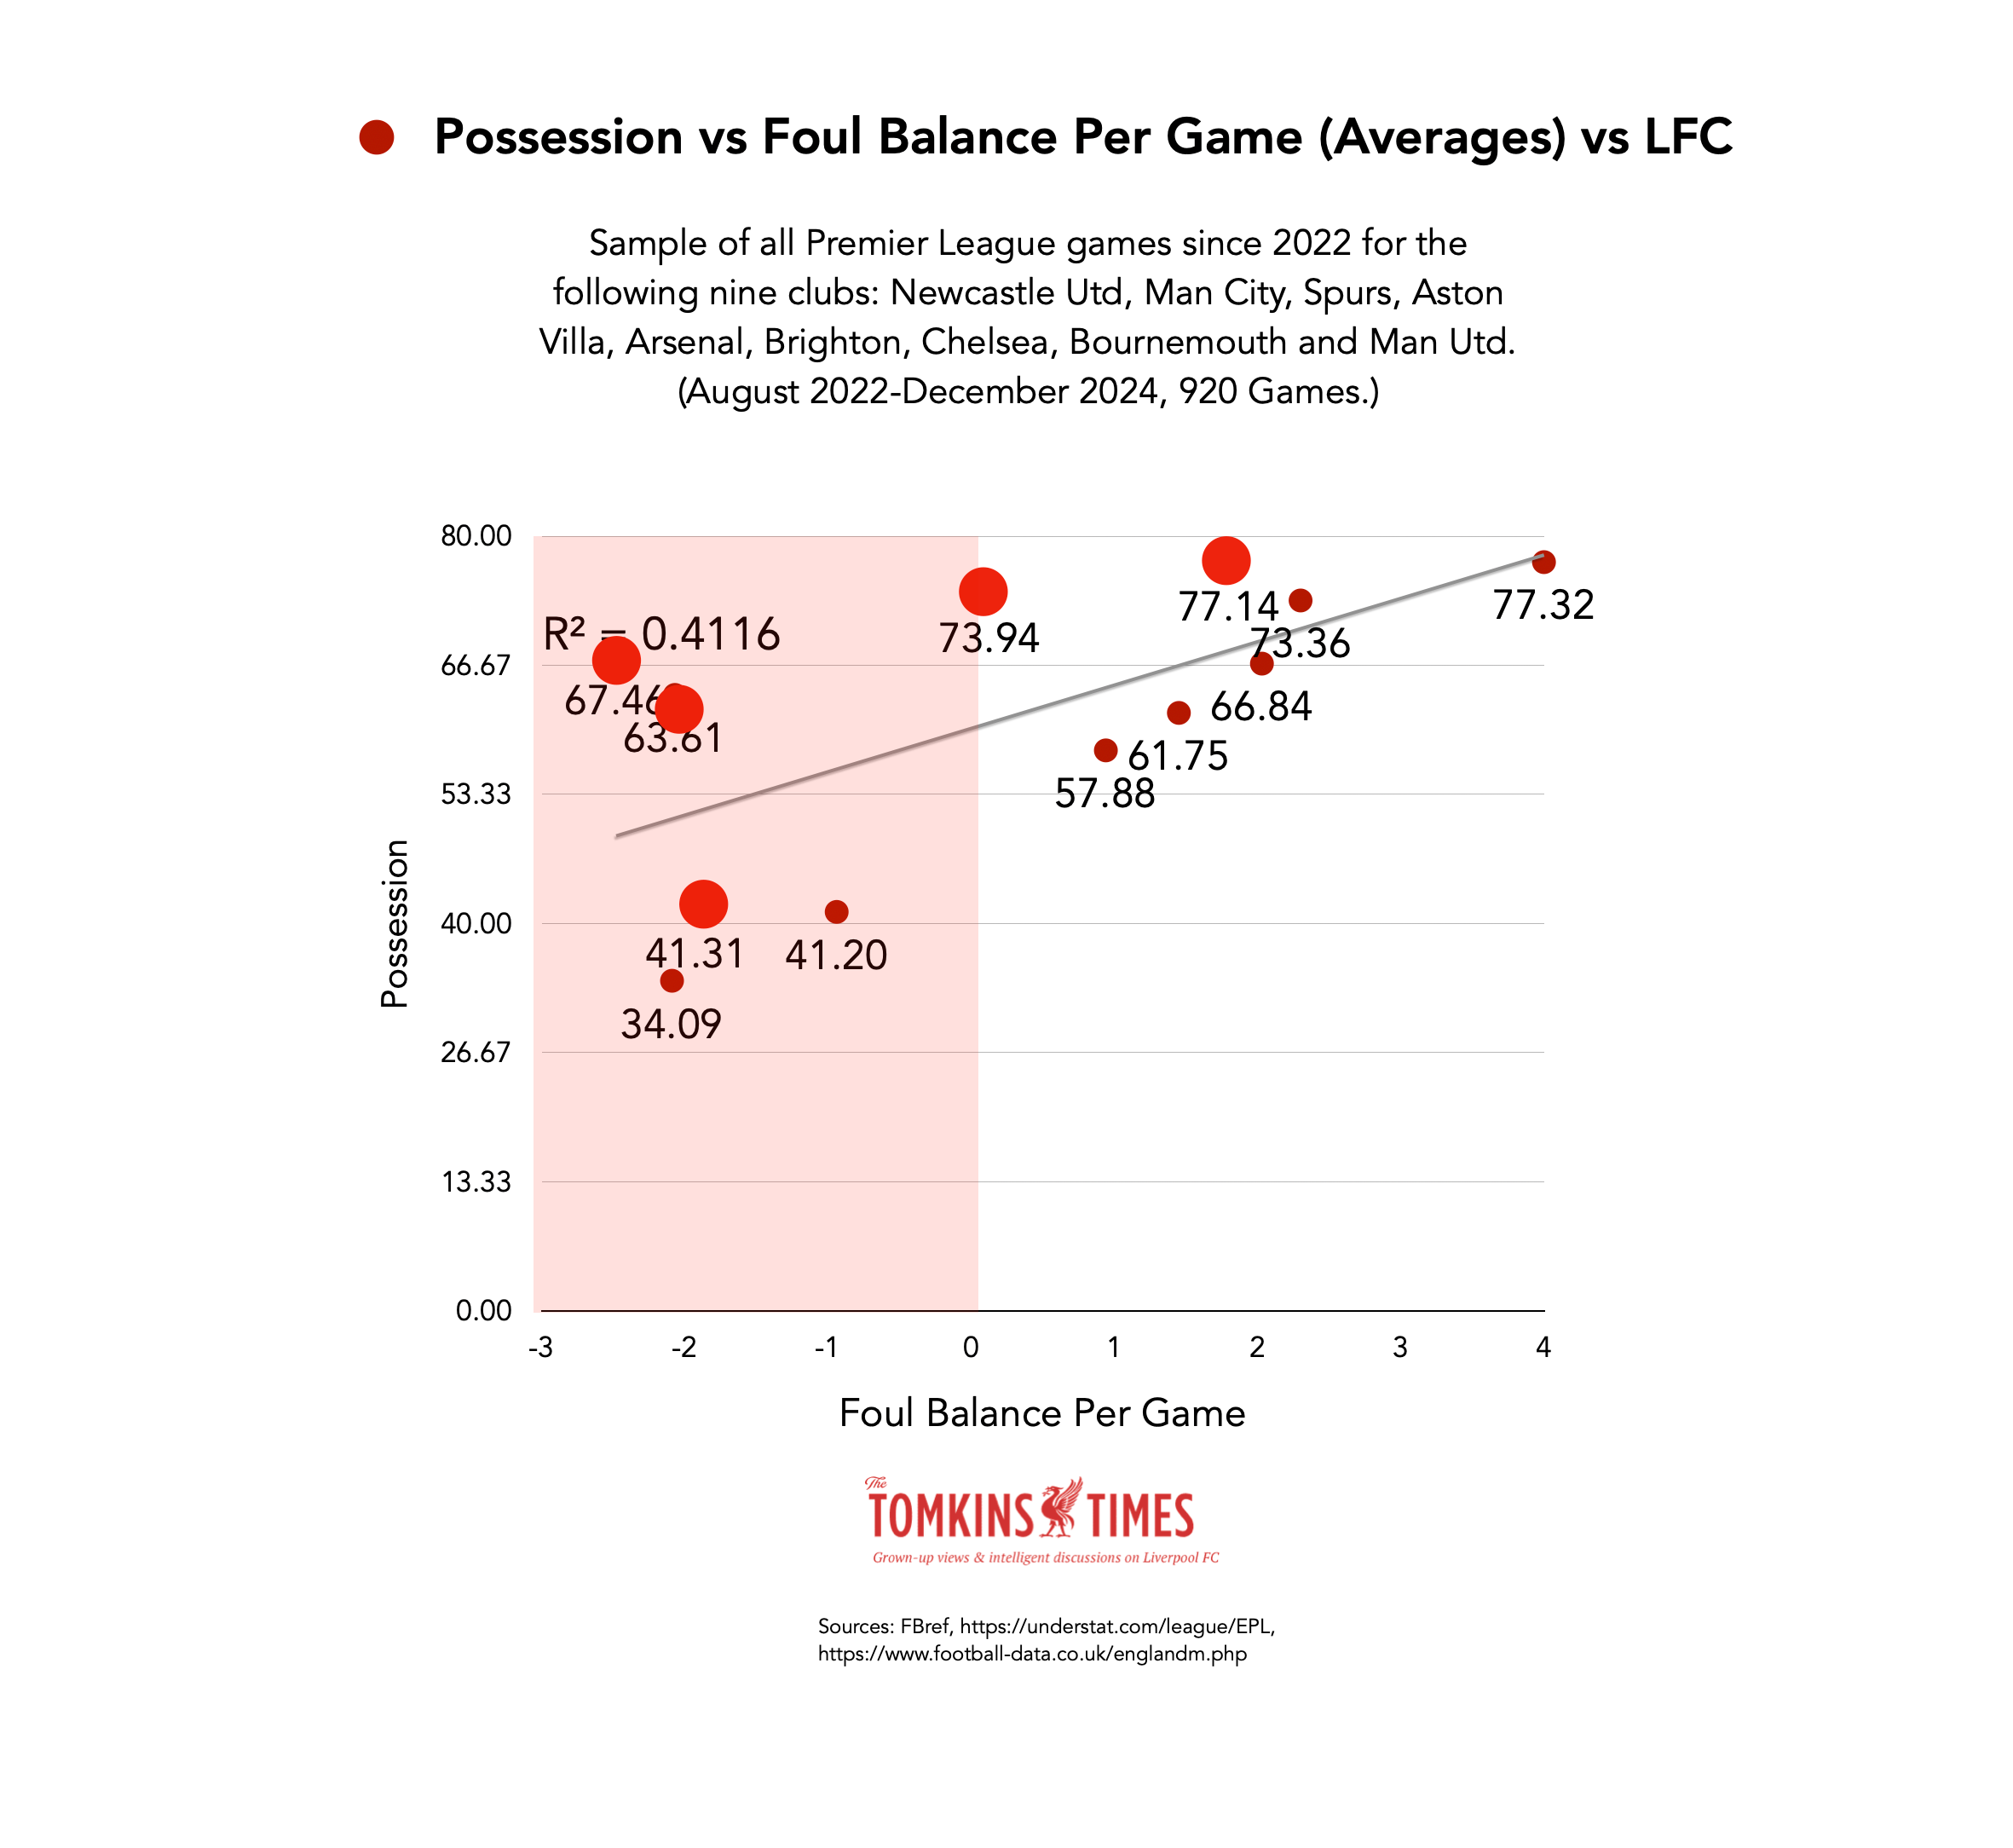
Update: If you also add Liverpool’s data to the model, it goes from a 97% correlation to 0.4116, or 41%.
The larger bright red circles, if the officiating was fair, would not be in the negative zone on the left, with only when the Reds averaged 74% possession and 77% possession did they make it to the positive side of the chart (and even then, one is virtually neutral.) A perfect model is torn apart because the large red circles do not appear where expected, which is on previous trendline on which the dark red dots fell (the trendline now shifts upwards, as it has to balance out the outlying bright red dots of Liverpool).
As Liverpool have over 50 games in the +60% possession range, the sample is more than large enough to fit the model, if Foul Balance were fair for the Reds.
+60% Possession
I’ve already shown this graph above, but here it is again (sample size of Liverpool’s +60% games is fractionally different, at 57 games, as this data is fully up to date.)
(The very physical but English-managed and majority England-attack driven and defence-led Newcastle do best, as they also do on subjective VAR overturns since 2019, even though they only went into a positive balance in 2021, once the new owners arrived. An improvement was expected given the investment, and overturns can be due to refereeing errors, but also, Liverpool have still only had two foul penalties in nearly six years of VAR, and almost no one gets sent off against Liverpool via the VAR. The Reds do very well indeed regarding offsides from VAR, which is the only vaguely reliable and subjective part of VAR. Even so, it’s a surprise to see Newcastle, given their widely-noted aggressive nature, topping the Foul Balance chart, as well as the VAR subjective overturn chart.)
The last five qualifying +60% possession games for Liverpool – since the original dataset was collated in December – have seen Foul Balances so bad that the previous 52-game average rises from -1.94 per game to -2.35 for 57 games, with the Reds’ last five high-possession games a staggering -6.60, including two outliers when compared via my other datasets going back to 2019.
And here’s the outline data table for the games where each team had 60% possession or more, before, for Liverpool and Spurs, I updated the dataset to include all games up to Feb 15th 2025.
This suggests something is very, very wrong. Liverpool average exceptional underlying numbers, but a horrific Foul Balance.

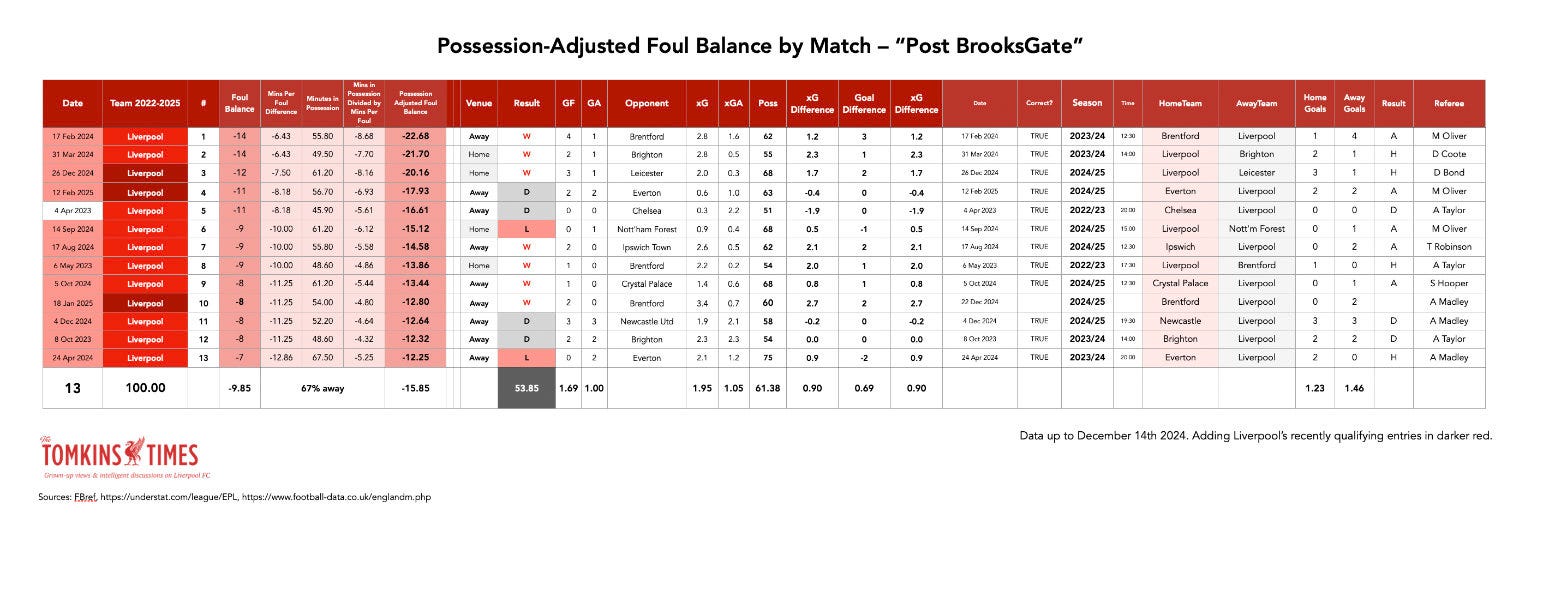
Individual Games – The Worst Foul Balances
Without adjusting for possession, Liverpool have an incredible 26.5% of the ‘worst’ 34 entries. David Coote’s sudden reappearance last year in the run-in to give Liverpool a -14 home Foul Balance vs Brighton was at the time the worst in 2,000 games, until Stuart Attwell was favourable to Aston Villa (a freakishly common trend with him, who is also terrible as a VAR in Liverpool games) at Chelsea.
Man United also appear a lot.
(Clicking on the images should enlarge them.)
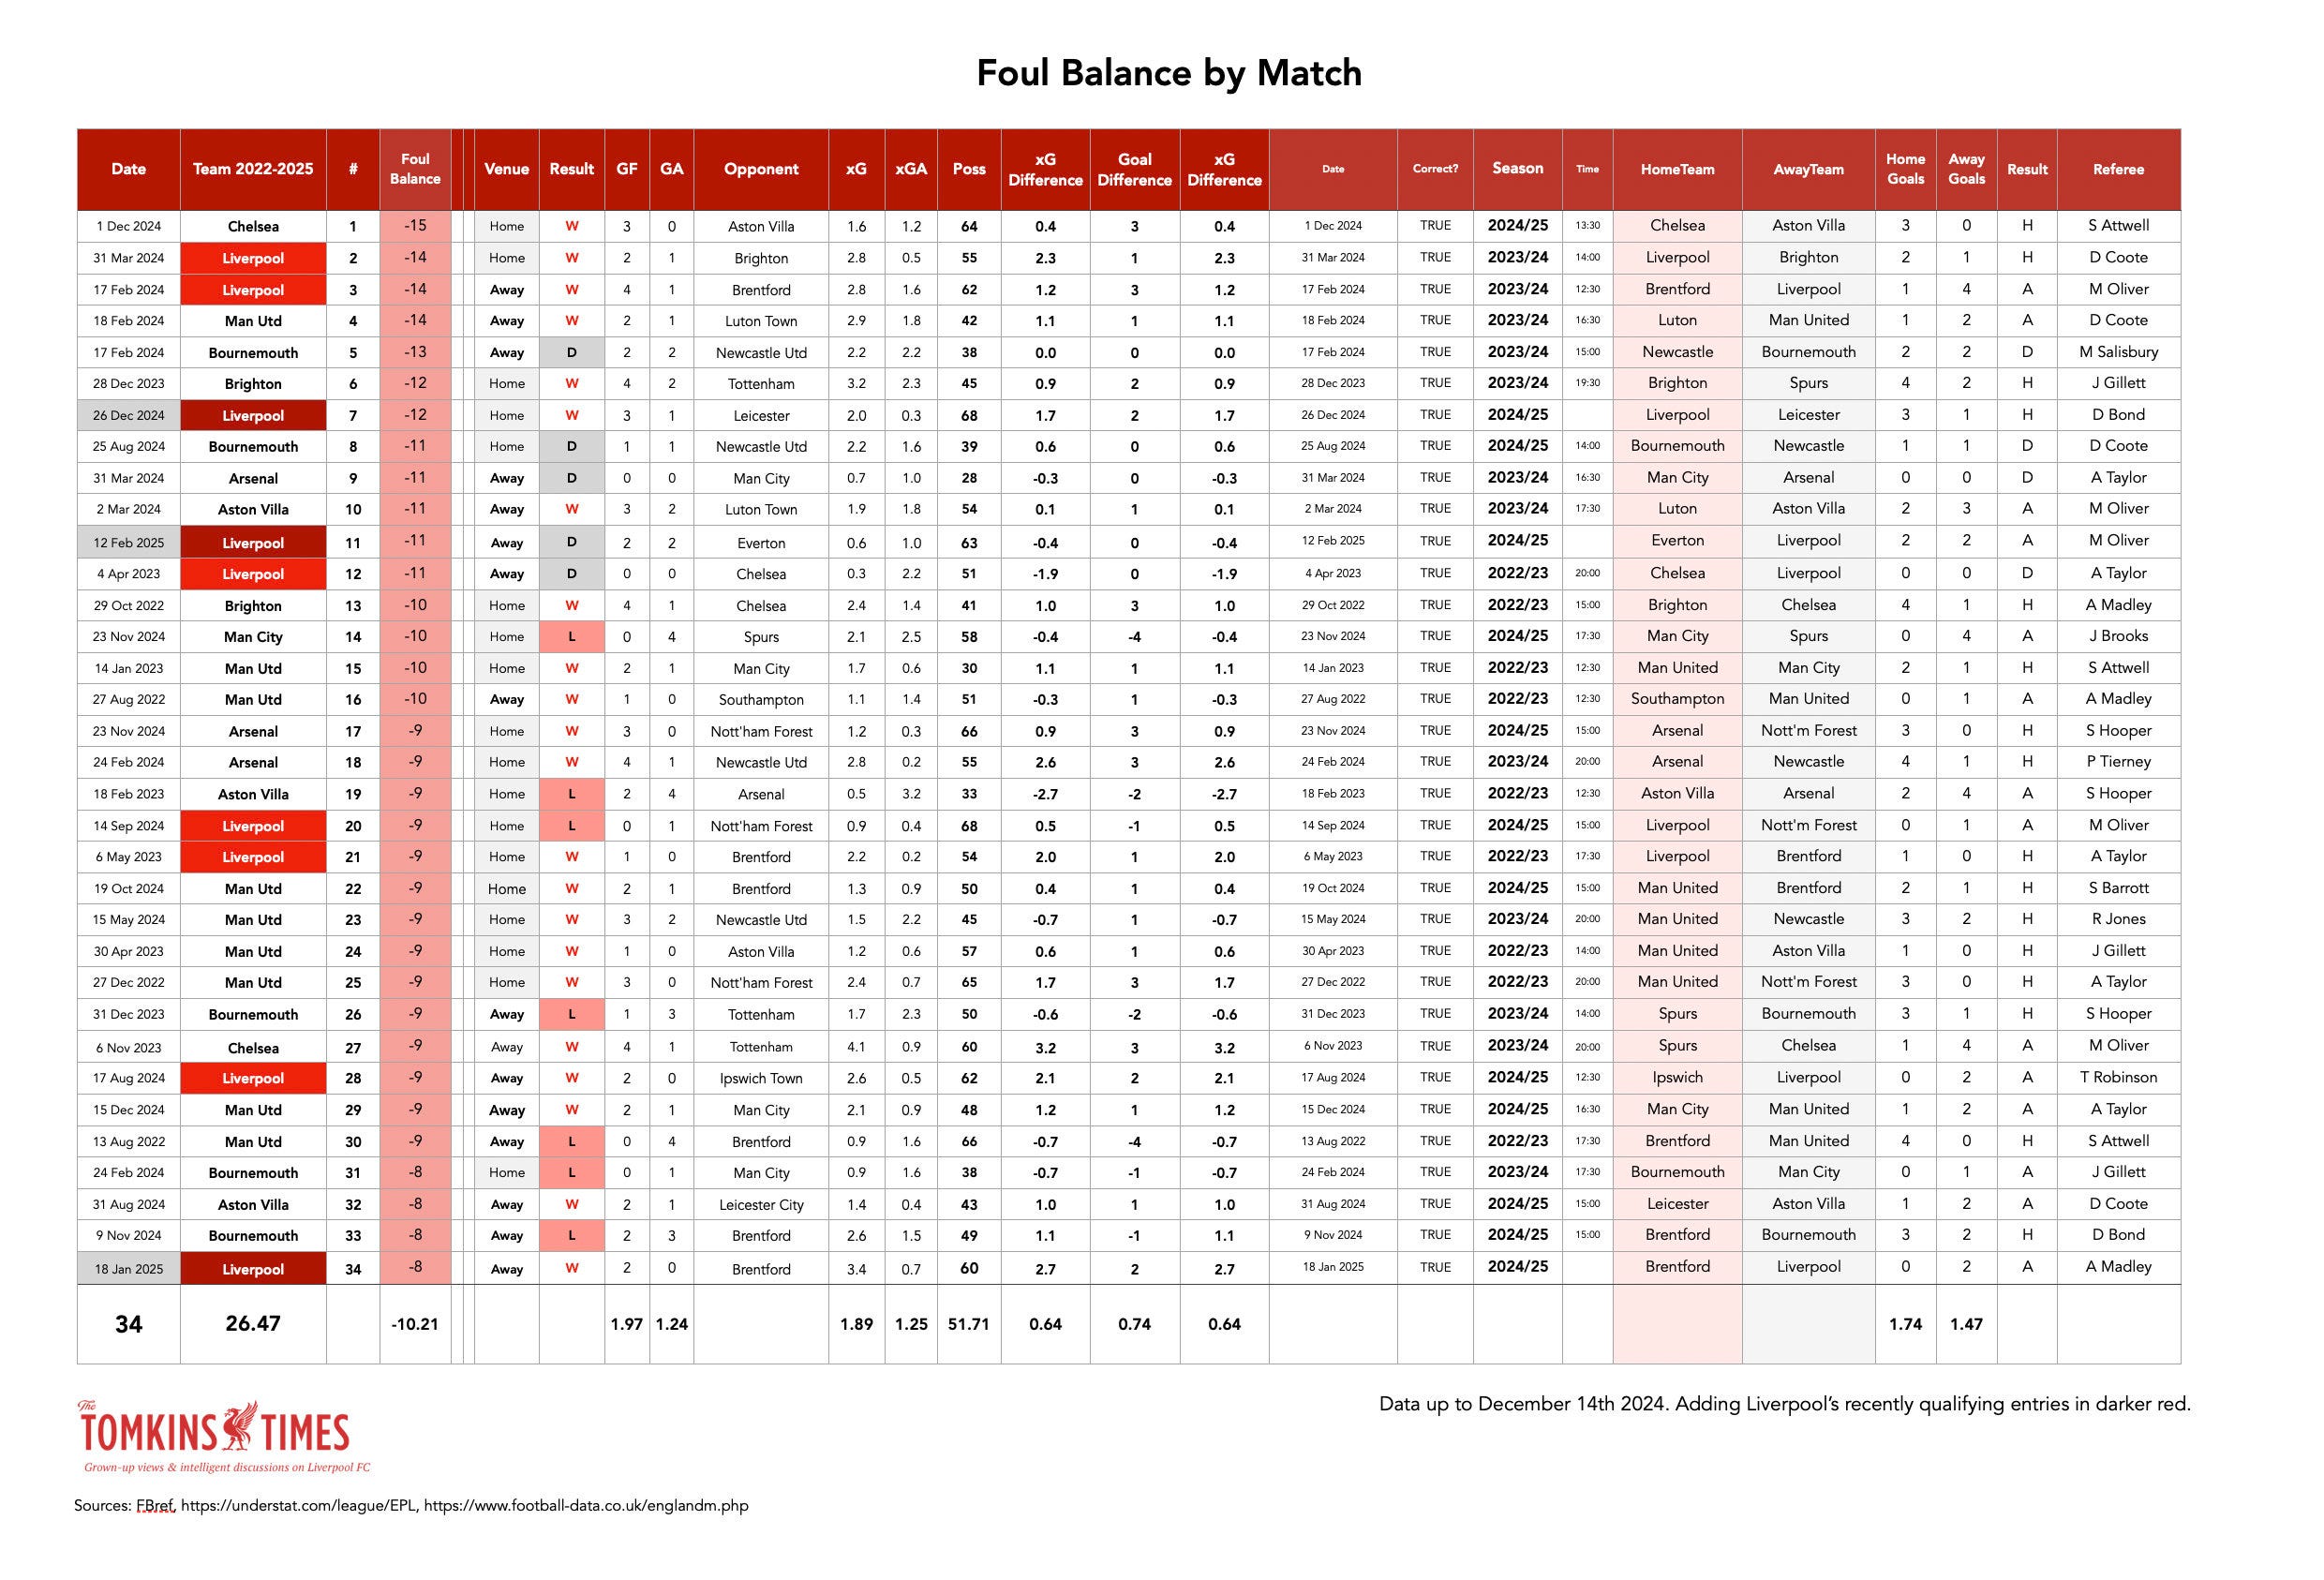
So it’s bad enough for Liverpool.
But when adjusted for possession … wow!
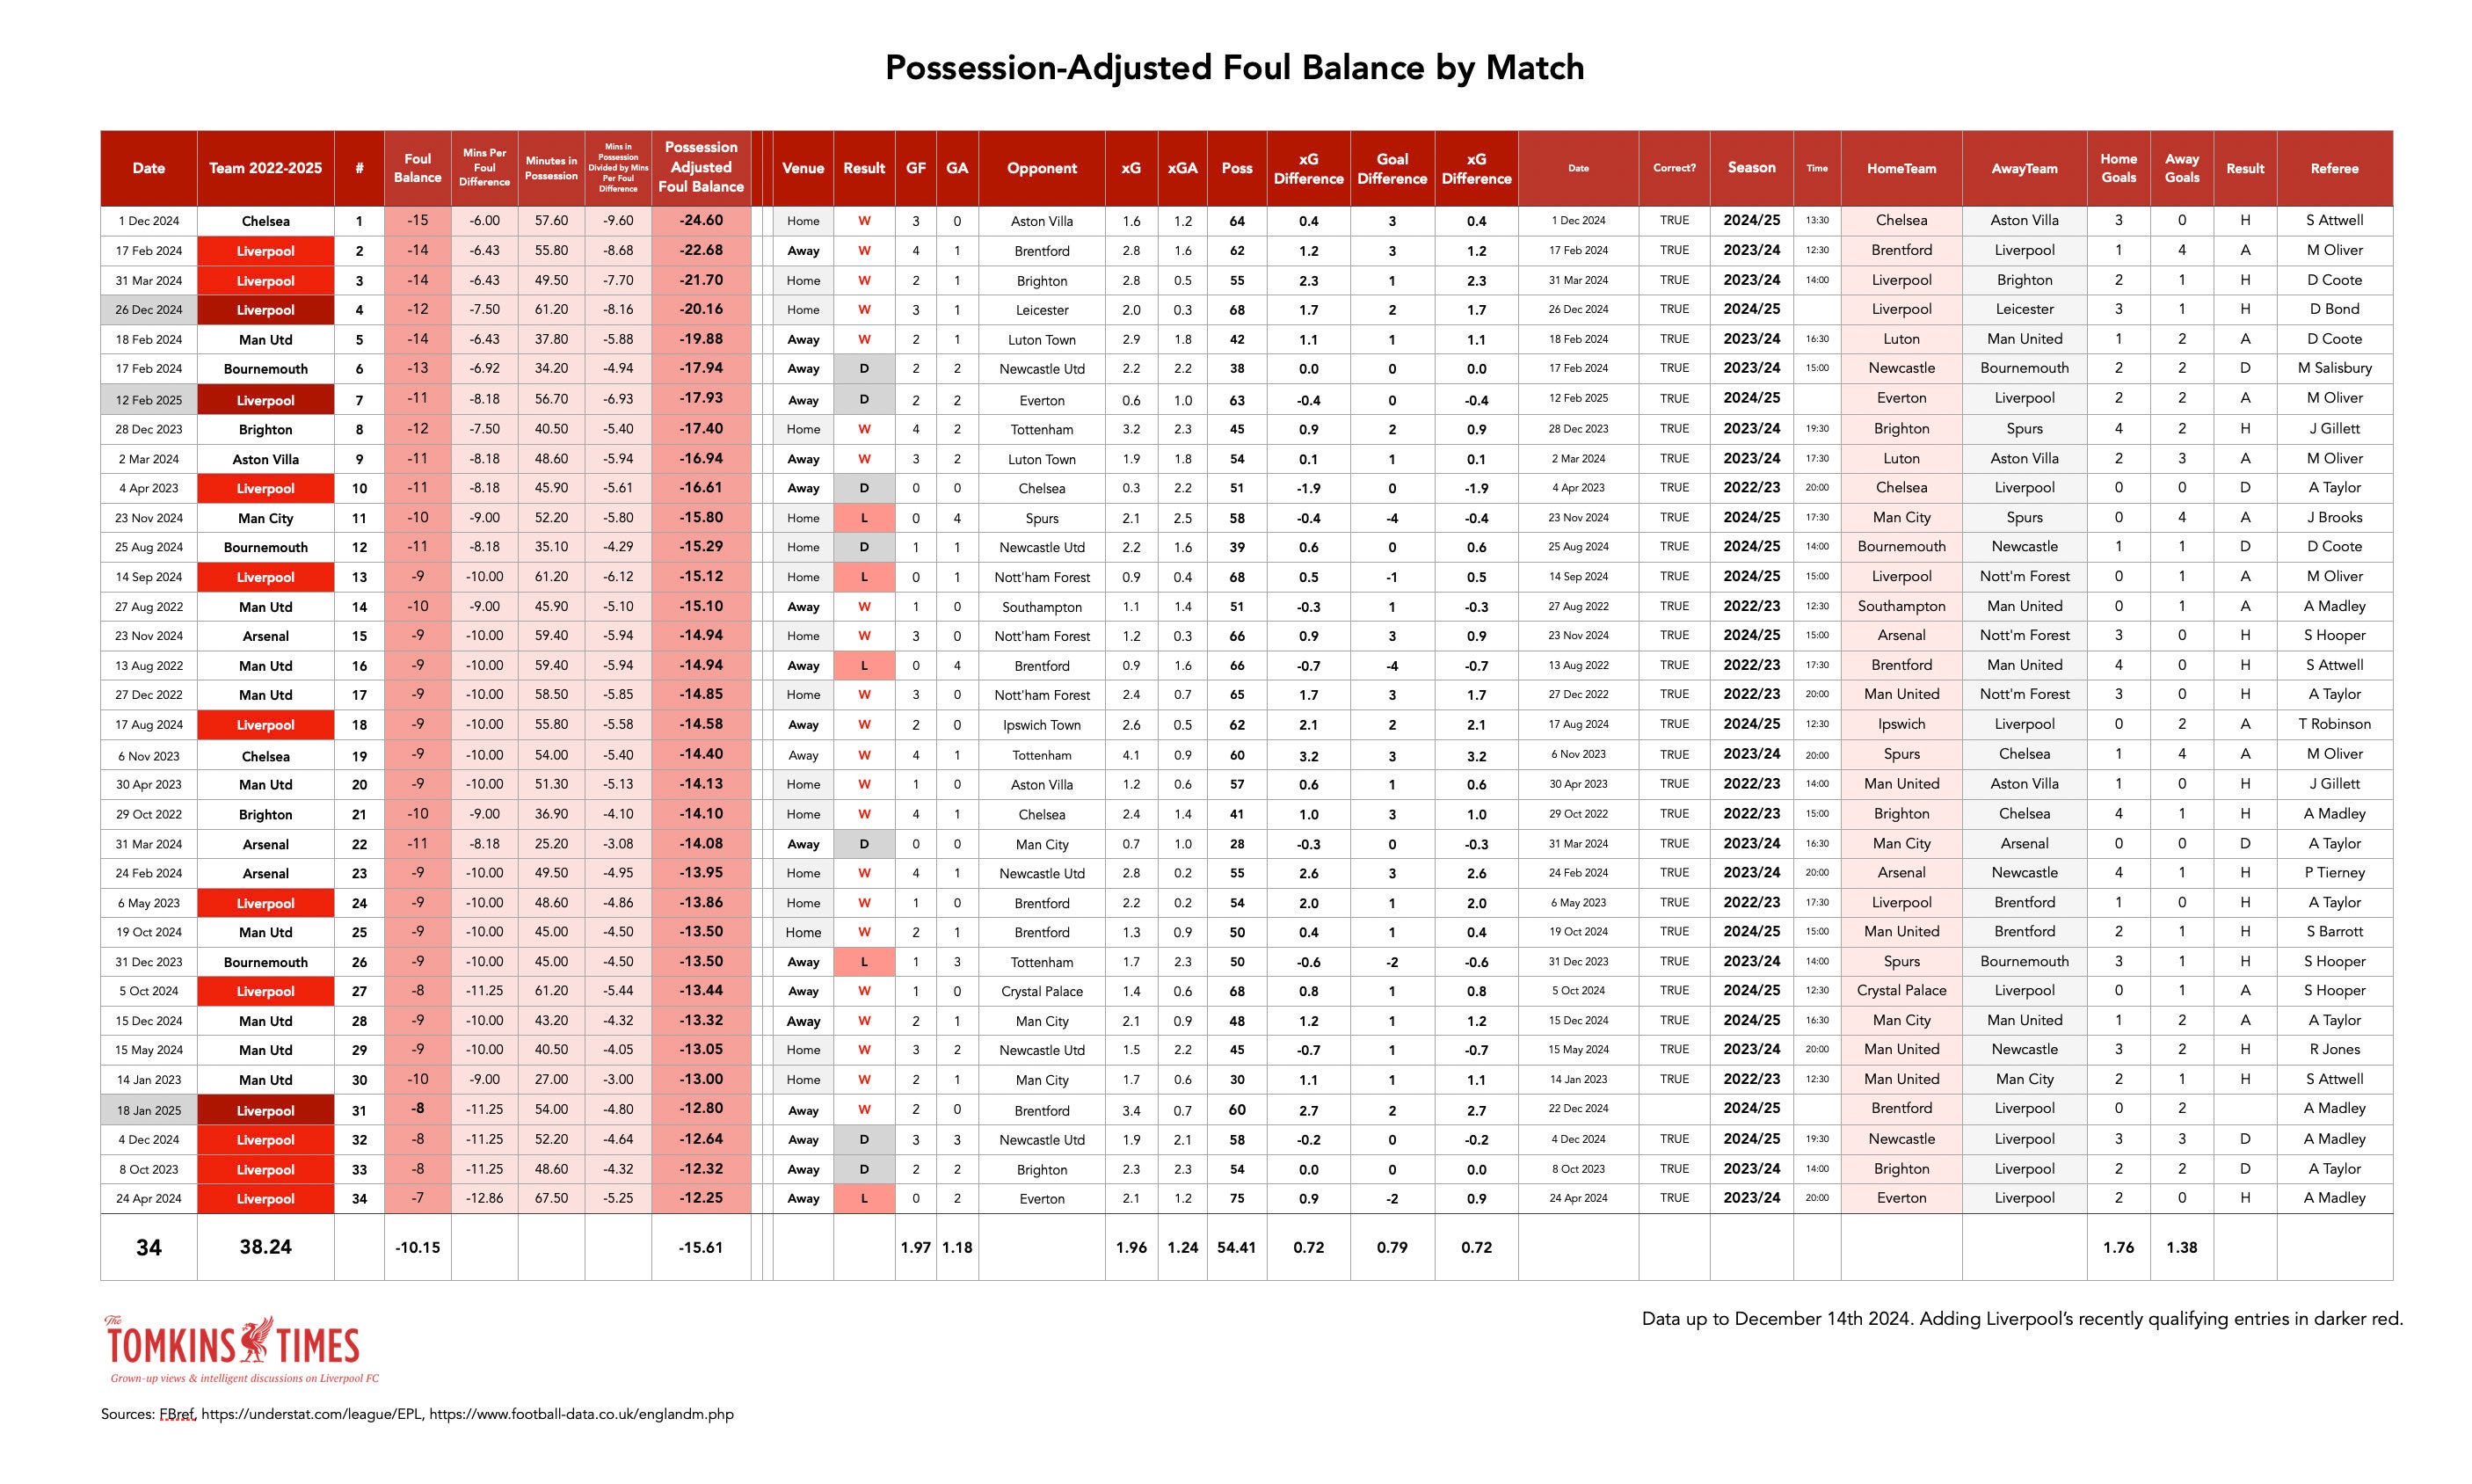
It rises to 38.2% of the worst 34 Foul Balances in the Premier League since 2022 belonging to Liverpool, albeit Liverpool have a slightly extended sample period.
Darren Bond debuted at Anfield in December with a -12 against Liverpool, that would be -20 when adjusted for possession. Also adjusted for possession, the recent Mersey derby was the 7th-worst.
Last season’s Goodison derby was notable for Andy Madley, whom Klopp had politely asked the PGMOL to keep out of his team’s passing lanes after Madley marked Bobby Firmino out of the game at Fulham in 2022, gave nine to Everton and no free-kicks to Liverpool until just before half-time, when Everton took the lead.
This season at Crystal Palace, Simon Hooper – I wonder where he’s reffing this weekend? – gave eleven to Palace and none to Liverpool well into the second half, before, both times, the balance was less extreme by the end.
(Madley’s response to the Klopp edict seems to have been: fuck you.)
To me, albeit I’m obviously biased, this feels like referees halting Liverpool’s rhythm on purpose, and allowing teams who want free-kicks to have them in abundance, and then some more. I felt this way before I looked at the data, which is why I looked at the data.
And the data was much worse than even I expected.
BrooksGate
Since the start of the 2022/23 season there have been exactly 100 games, with nine matches since the original data was parsed in December. “BrooksGate” happened late April 2023, or the 33rd game of the 100-game sample.
BrooksGate was Jürgen Klopp losing the plot when Mo Salah, the most fouled but almost the least free-kick awarded player in the history of the sport (possibly) being fouled not once but twice by Ben Davies, in front of the dugout, and the linesman and referee did nothing. Klopp then got into the face of John Brooks, the 4th official.
Paul Tierney was the ref, whom Klopp had already sparred with, given that Tierney was awful for Liverpool in his first 15 games (and continues to be in nearly 30 games as the VAR, still hasn’t given the Reds a subjective overturn, just ones against.)
Klopp overstepped the mark, but it signalled a ramping up of what I see, via the data, as unfairness. It feels like revenge from the PGMOL, and while I thought it would stop when Klopp left (and it did appear to with Brooks himself), the general trend has continued under Slot.
Slot himself, surely aware of the data based on what he’s said in the past and from watching games from Klopp’s tenure, is feeling gaslit, you can presume, as a mild-mannered Dutchman has lost his cool, and would have lost his hair too, had he not already been so beautifully bald.
And obviously Klopp had upset David Coote in 2020 during the 7-2 to defeat at Villa, days prior to the 2020 Mersey derby for which Coote was the VAR (and didn’t send off Jordan Pickford, and disallowed a last-gasp onside Liverpool winner), but thankfully, we now know that Coote was utterly professional, and didn’t call Klopp a ‘German cunt’ down the pub on the eve of that match, nor say that Liverpool were ‘shit’, and nor has he done anything else, in amongst his litany of terrible decisions when officiating or VARring Liverpool games, to suggest he was anything other than as white and pure as the driven snow*.
*insert your own line
There was obviously no hostility and no xenophobia.
(BTW, when I analysed 600+ penalties from 2011 to 2019, I found no obvious ‘racism’ by the referees, but xenophobia was all over the results. Skin colour didn’t seem to matter for penalties won or conceded, but foreign players were treated far worse in both boxes based on percentages involved in games; while England internationals seem to get preferential treatment. The same applied to Liverpool over a 20-year period, with more decisions in the club’s favour for British players than you’d expect, and the same for the Reds’ British managers.)
A reminder from 2022 that Mo Salah is foreign:

In the 33 games up to and including the Spurs debacle I’ve dubbed BrooksGate, the Reds were running at -1.12 Foul Balance per game.
Pretty bad, pretty grim.
Yet in the 67 games since BrooksGate, it’s virtually doubled, to -2.10 in those 67 games.
And 12 of the 13 worst possession-adjusted Foul Balances have come post-BrooksGate.
So 92.3% of the occurrences are from the most recent 67% of games.
This is without taking possession into account, but the majority of games saw Liverpool have a lot of possession, clearly.
Several of the games where Liverpool dropped points, including at Goodison, can be partly explained by outlying Foul Balances.
As well as the Salah incident at Goodison, Ibou Konaté was pushed for the equaliser; yet the ref didn’t give it, so the VAR wouldn’t overturn the under-scrutiny (and perhaps bullying?) Michael Oliver.
However, when Luis Díaz pushed and fouled the Everton centre-backs in the first half, it was given every time.
(Last season, Everton used the same tactic against Konaté, pushing him before every aerial duel; it doesn’t take much to nudge someone out from under the ball if they are either jumping or poised to jump.)
Liverpool have been a better team since BrooksGate, with a consistent possession share (60%) before and after, but far better xG metrics, and yet have punished more.
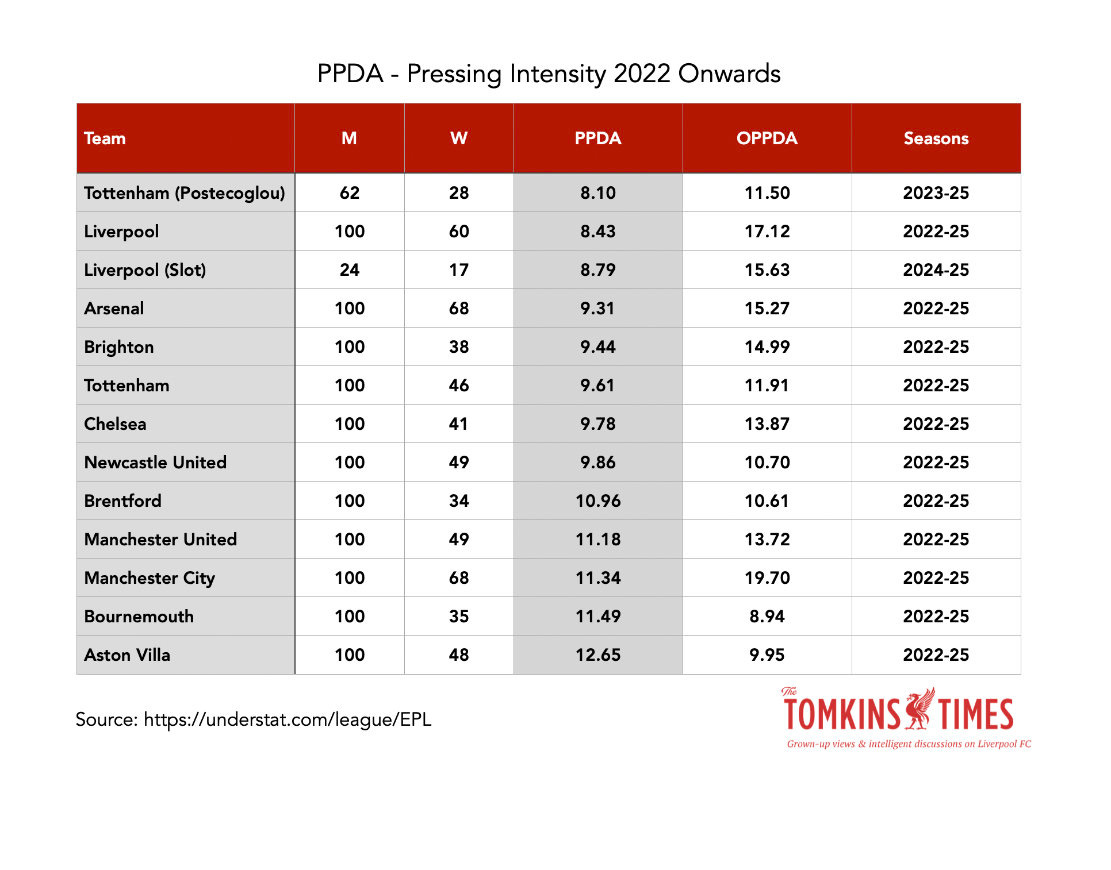
Pressing, and PPDA
Ange Postecoglou’s Spurs press harder than Arne Slot’s Liverpool, based on PPDA.
The lower the PPDA (passes per defensive action), the more a team is said to press. It’s not perfect but seen as the best proxy for pressing intensity.
As such, for Spurs to average a staggering +5 Foul Balance when compared to Liverpool in the +60% possession games, when both clubs want to play good football with possession and pressing, it kills the notion that any difference for Liverpool is about pressing (albeit Liverpool mostly only press from the front with foreign players, which may be part of this).
A difference of five fouls per game is massive. Take five free-kicks away from any team in a game, or give five extra to any opponent, and it would make a huge difference.
I would argue that most of these teams also want the ref to signal ‘play-on’ where possible. When Cody Gakpo continued after being dragged back in the week for what was the most obvious yellow card, the Everton player was not subsequently booked.
Honesty is not rewarded by refs; a fouled player who stays on his feet is usually unduly punished. This is a vital truth in general. A lot of the time, refs are wilfully blind to the dark arts.
(A quick google also gave me: “Mikel Arteta has opened up on trying to get his players to learn the dark arts of football because it is not in Arsenal’'s DNA.”)
Newcastle, whose manager went to Spain to learn from the master of the dark arts, Diego Simeone, also average a PPDA of under 10, which means they press aggressively, as do Brighton, Chelsea and Arsenal.
The difference in PPDA is small enough to rule it out as a course of the insane Foul Balance disparities.
Conclusion
The referees’ completely unfair Foul Balances are getting in the way of Liverpool trying to win the league.
While Arsenal may have some grounds for concern over a couple of red cards, the systematic ‘kneecapping’ of Liverpool via Foul Balance is remarkable, according to the data.
(Edit: also, everyone acknowledges that Michael Oliver refereed the derby differently to how most games would be reffed, yet no one seems to see an issue with this, as if it’s okay for Liverpool to not be given free-kicks to ‘let the game flow’, but Everton can have 20 free-kicks, because…? How can there be consistency when someone is reffing like it’s 1973 for one side and not the other? How can it be fair to handle a game very differently, in order to suit the home team?)
Liverpool are the only team who have more possession and concede far more free-kicks than they receive. No one else is remotely close.
There are lots of other areas where Liverpool are treated worse by refs, but this is happening virtually every game.
Arne Slot, as one of the world’s best football thinkers, who uses data and video to dissect a game in forensic detail, could see this before he even arrived as he watched some of Liverpool’s games from last season; but all it’s ended up doing is driving him mad, in the way that Klopp was driven to distraction, and worn down by the bullshit. If Slot points it out now, he’ll get further punishment. He’s currently in zip-it mode.
I’ve no idea how it can be remedied, beyond a root and branch felling of the PGMOL; or just the word spreading, and people looking into it, and seeing what the data so clearly shows. Maybe the PGMOL themselves don’t know they’re treating Liverpool so differently, but by now, they should.
Liverpool fans are being short-changed by the officials, and the team is being held back.
The sport needs to be fair, or it’s just another sham.
Once more:
On average, to ‘win’ the Foul Balance, a team just needs +50% possession, as would seem entirely logical.
On average, for Liverpool to win the Foul Balance, the Reds need to average +70% possession.
Postscript
Potential reasons why?
(Just my guesses)
So, given that the data is clear and inarguable, what are the causes?
I’ve listed some of what I think could be the potential reasons, and it could be a combination of some of these:
1. Lingering resentments dating back to Klopp. Fallouts with Brooks, Tierney, Coote and others, and the closing of ranks within an organisation not known for its quality.
2. The explicit/implicit desire to give a leg-up to underdogs, as pressurised by the media, who often make it clear who they want to win. (Similarly, at times, to keep a title race open, as it’s better for ‘the brand’, and means retaining an interested audience. The integrity of the broadcasters was shown when they buried the Luis Díaz offside debacle last season, refusing to show a replay.)
3. Perceptions that Liverpool get all the decisions already. The Reds certainly used to get a lot of penalties in the old standing-Kop days; and got 12 under Brendan Rodgers in 2013/14, and seven of the ten that weren’t handballs were won by British players.
4. Perceptions that Liverpool get lots of Anfield and Kop-end penalties, and as a result, the referees are going into games at Anfield feeling like they must prove they are not weak, which means ignoring the reality and ignoring the fouls. Opposition managers and ex-managers, usually British, will say that Liverpool always get decisions due to the Kop. I say this a lot, and every week, some fuckhead does just that. Alan Pardew was a recent one.
5. Foreign players are simply treated worse. Foreign managers, too, at least for Liverpool. A sense of ‘who are they to tell us how to run our game?’ Liverpool’s XI at Goodison was fully non-English. All refs are English, and they do favour English players.
6. The anti-Liverpool mindset from those who see the club as too successful, which may explain why Manchester United are the only other team to suffer a negative Foul Balance when having high possession, albeit their football style is very different in general. And any ‘neutral’ is more likely to hate Liverpool and Man United.
7. The ‘otherness’ of Liverpool the city. Almost as if the city itself is foreign. The booing of the national anthem, etc. Referees seem to be pro-establishment by their very nature.
8. The constant abuse refs must get for being “Liverpool lovers”, and the instant chants of “the referee’s a Scouser” and “who’s the Scouser in the black/blue” at the first Liverpool free-kick, which has happened even after 5-10 have been given against Liverpool before they finally get their first. See Michael Oliver being given death threats and told he is trying to help Liverpool win the league. While I use data to heavily criticise officials, I don’t want them to be threatened; just held accountable.
9. The hyper-reaction to any Big Decision that Liverpool get, which is driven by social media, which in turn drives the discourse. What happens on social media bleeds into the wider world. If you haven’t realised that yet, you’ve been dead for a few years.
10. Any potential blame that Liverpool and Klopp caused Coote to lose his job could now be a new factor, in addition to BrooksGate resentments. Coote seems to be widely backed by his fellow whistle-blowers, albeit none blew the whistle on anything about snorting. The Foul Balance situation has got worse since the Coote stuff blew up.
11. Perception that Mo Salah is a diver, as are other LFC players. As they’re foreign, dammit.
12. Going back to the 1980s, the Heysel disaster getting all other English clubs banned from Europe for five years, which caused a lot of resentment.
13. The nasty idea that Liverpool are ‘always the victims’, and conflating sick myths about Hillsborough. A lot of refs are from South Yorkshire, and some are ex-police. See this policeman, now sacked, and his tragedy chanting, for evidence of what’s out there.
14. My perception is that Liverpool players don’t make a meal of things. The players don't roll around and scream, but tend to want to get on with it. This is the opposite of someone like Luis Suarez when he arrived (and could be embarrassing), which the PGMOL, via Peter Walton’s Times’ column, said that they had to crack down on, along with other foreigners. (As well as saying that refs are trained to ignore 60,000 people.)
15. Beyond the standard tactical fouls that all teams make, Liverpool don’t employ the dark arts, and this is self-defeating when others do.
16. Referees going to places like Saudi Arabia for tons of cash didn’t help; at best, it showed a shocking lack of proving impartiality when those ‘countries’ (or people connected to their governments and royal families) owned big Premier League clubs.
17. Liverpool are just a far dirtier, nastier side than anyone else, albeit I’ve never heard a neutral say this. The Reds’ rank low on the dark arts.
18. Articles like this just make the PGMOL even more determined to screw Liverpool.
19. More to follow, possibly...
Again, this is another free read, that I’d like people to share, but commenting and many other articles are for paying TTT Main Hub subscribers only.
Keep reading with a 7-day free trial
Subscribe to The Tomkins Times - Main Hub to keep reading this post and get 7 days of free access to the full post archives.