Statistics correct at 17th October 2022
The referee’s decision is final. It is sacrosanct. Except that since the summer of 2019, the decision has only been final in the Premier League once it has been reviewed and approved by another official at Stockley Park. You might think it final at first, but the placement of an armpit might change that entirely.
Yes, we’re here to investigate VAR.
We Need To Talk About Kevin (Friend’s perfectly league average rate of 3.2 games per overturn, that sort of thing). The prevailing narrative on social media is that LiVARpool benefit more than most clubs, though this has long been shown to not be the case.
While we will touch on the team figures, and how they break down in different ways, in this study we’ll primarily be taking a closer look at the men who make the decisions, both on the field and in the video review bunker. Is there anything unusual lurking in their figures?
Before we begin properly, the usual terms and conditions notice: we are looking at small sample sizes here, and we only have a record of overturns which occurred (thanks to ESPN). There is no database of situations where the Video Assistant Referee “should” have intervened but did not, and such a list could not possibly be objective in any case. If you’re a conspiracy theorist, this article is not for you. It won’t prove a thing, though that isn’t to say it does not contain some eye-catching numbers.
Right, we just need the all clear from the television company that their commercial break is over, and we can begin.
*Checks earpiece, blows whistle*
Team figures
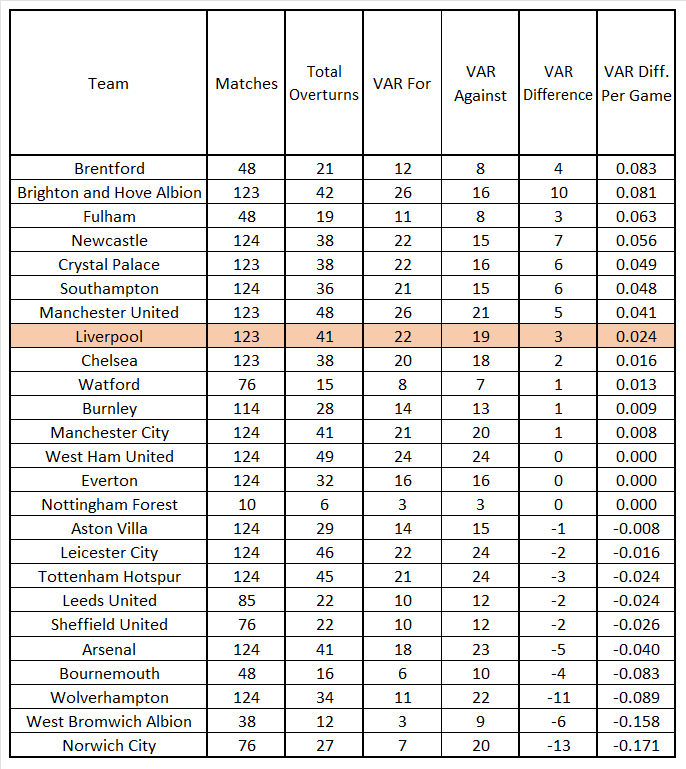
Here is a table of how many overturns each team has had go for and against them in the Premier League. None of the big six clubs are in the top six of this table, and prior to Sunday the league’s three most successful teams in the VAR era – Chelsea, Liverpool and Manchester City – had the same VAR difference with near identical figures at both ends.
However, the thought process which led to the article was based on not all decisions being the same, and not just in respect of whether they are for a goal, a penalty or a red card.
Offsides have to be considered objective, as they are based on lines on a pitch (and although people will grumble about line placement and frame rates on the footage, in principle a player is onside or offside). Encroachment for a penalty falls into the same category; you’re either in the box/off your goal line, or you’re not.
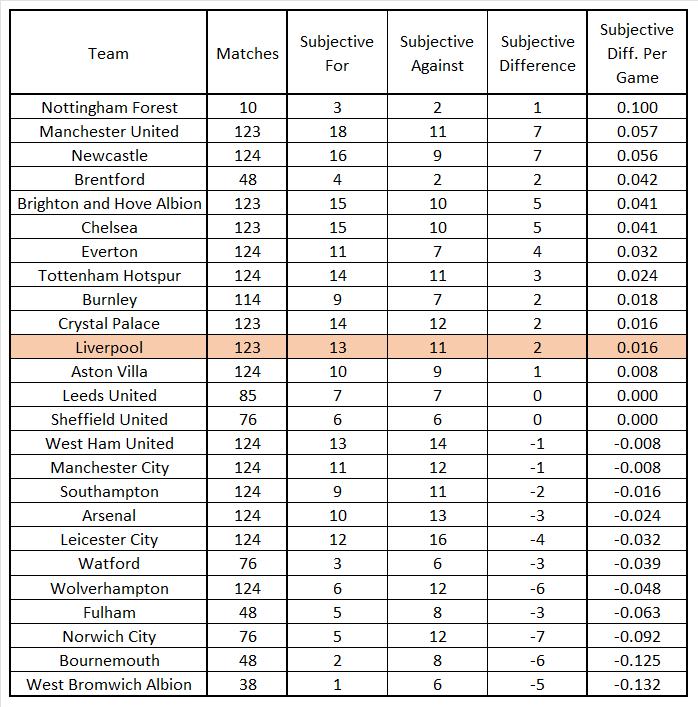
Whether a challenge is a foul or a ball striking a hand is handball lurk in far greyer areas, and as such are subjective decisions. I’ve also included adjudications on whether a foul occurred inside or outside the box here too, as most tussles of this nature start on one side of the white line and conclude on the other. What’s noticeable if we rank the clubs by their difference for subjective decisions per game is that we see Liverpool and Manchester City drop down while the likes of Chelsea, Everton, Manchester United and Tottenham move up the chart.
Six of the ever-present sides have had more subjective decisions go in their favour than Liverpool, with seven having had more go against them. I said earlier we can’t account for decisions not made, and that remains true. What we can do, though, is look at how often a referee or VAR makes an overturn in a Liverpool game compared to their average. That will at least hint at decisions not made.
*blows half-time whistle 5 seconds early*
(The second half of this article is for subscribers only)
Keep reading with a 7-day free trial
Subscribe to The Tomkins Times - Main Hub to keep reading this post and get 7 days of free access to the full post archives.


