[HIGHLIGHTS] Refs, VARs, and Proving Clear and Obvious Biases and Fallibilities TL;DR Version
FREE READ MEGA-STUDY – ABRIDGED/TL;DR VERSION
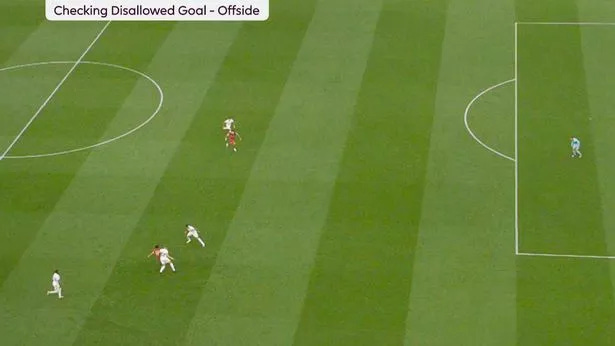
(Apparently the VARs drew the lines on the image above. They must have used invisible ink pixels.)
Abridged!
The trouble with shorter articles with lots of data covering a lot of different aspects of analysis is that you don’t get to discuss the nuances, and you get hammered for not explaining more, or people misunderstand the data or graphs.
The trouble with longer articles that explain the nuances is that people don’t read them.
Anyway, here’s a much shorter version of my final referee and VAR study, but still with a bit of meat on the bones. As ever, it takes a lot of time to whittle something down to a readable length without losing something in the process.
If you want more context, analysis and nuance, read the longer version.
• See full version of the article for the analysis.
This is the highlights package. It doesn’t show the whole game, as it were.
Eight full years of refereeing data, four years of VAR
The four best teams, 1,200 games. The data is in.
It’s never been clearer: referees (and even VARs) often don’t give decisions as to what the correct call should be, but what they feel under pressure for it to be.
But the term sapiens fits: a lot of the time, it’s human error; but also, avoidable human error. But there are Homers, anti-Homers, Avoidants, Crowd-Pleasers, and the just plain weird.
And there’s stuff like yesterday, that was well beyond acceptable human error. And that happens too often.
In truth, I wanted to spend a bit longer honing this, after months of work, but the longer I took in completing it, the more out of date the data would then become, which would then need reworking, and it becomes a never-ending cycle.
(* I want to go out with a bang on this, as the best study I can possibly do, and then leave it all behind. It feels more like doing a PhD in refereeing pressures, biases, shortcomings and crowd pleasing; at the very least I expect to receive an honorary BTEC diploma in woodworking.)
And then the staggering, unprecedented events at Spurs meant it was better to publish and be damned while the iron is hot and before the horse has bolted from Goldilocks’ barn of mixed metaphors.
Key Findings – Summary
Paul Tomkins, 1st October 2023
Study of Officiating of Liverpool, Man United, Man City and Chelsea, 2015-September 2023.
A quick truncated version of the intro, then mostly bullet-points for those who found the original too taxing.
I want to acknowledge, yet again, that refereeing is a tough job, but also a professional role worth up to £200,000 a year, and some refs have taken money to do one-off games elsewhere, too.
(And of course, it turned out that the officials who messed up so badly for Liverpool at Spurs were in the United Arab Emirates, of all places, on Thursday! Don’t they want to look impartial, by heading to the part of the world where the states own rival Premier League clubs; and also, be fit and fresh to do a proper job?! Irrespective of whether or not they have integrity, the idea is to not open themselves up to any compromise.)
Apparently hailing from Yorkshire gets you a job, mind, with the last four heads of refereeing from Yorkshire, and senior training positions giving to Martin Atkinson (from Yorkshire) and Jonathan Moss (lived in Yorkshire for decades), while the ex-player (Wayne Allison) who works with them is from Yorkshire. Darren England, the VAR who was negligent yet again, is like several other officials, from Yorkshire, just like the head of the PGMOL, Howard Webb. I noted all this some time ago.
Otherwise, 13 referees since 2015 have been from the Northwest, and zero Premier League matches have been reffed by someone from London (and just a handful from officials from the East of England). That in itself is extremely odd.
We also saw Mike Dean recently admit he refused to make a decision as a VAR as Anthony Taylor was his mate. He was slammed for saying this, but he spoke a clear truth about conflicts of interest. Again, it shows in the data.
Main Four
For reasons that I will explain in more depth later, I focused on all Premier League matches involving what I call the Main Four (Man City, Liverpool, Man United and Chelsea) since 2015, with the data correct up to the start of September 2023.
These four are the most successful clubs during that period; and thus, the most comparable. (For full explanation of reasons Main Four were chosen, beyond xG, see full version of the article.)
So, 1,200 matches, 638 of which also had VAR. And across those 1,200 games, 88 referee/club combinations.
I’ve also focused on 2015 onwards because that was when Jürgen Klopp took charge of Liverpool, and when Liverpool got better; but their Balance of Big Decisions got worse. It’s far enough back in time to give eight years of data, but not so far back that we’re talking about whether or not Ian Rush was offside.
While I clearly have a Liverpool FC bias and focus, this is all objective data.
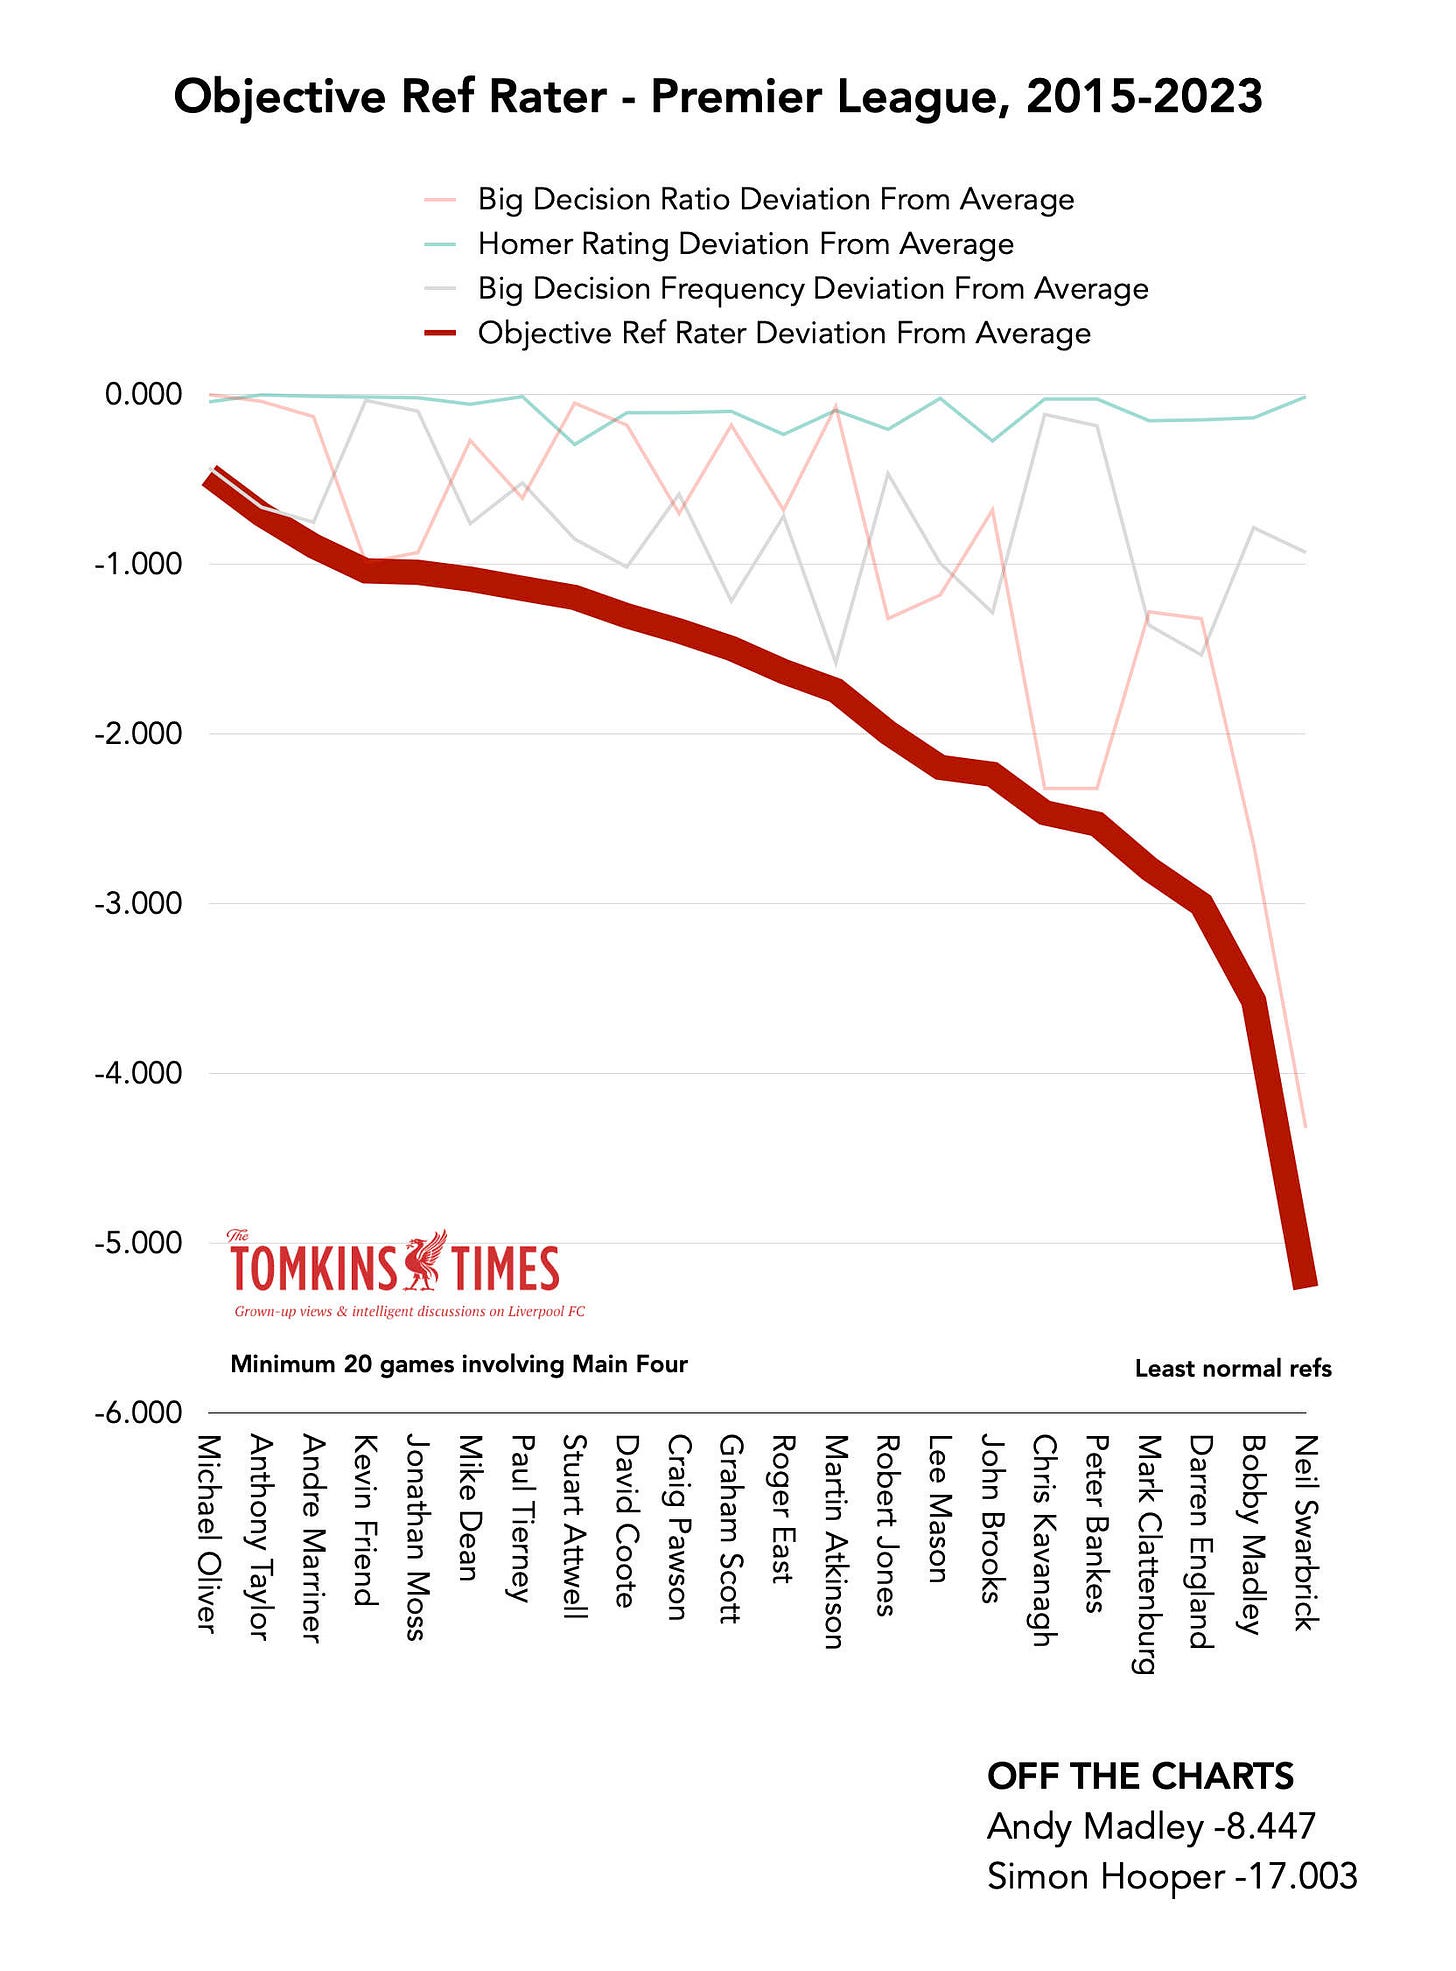
Liverpool obviously suffer more weirdness from officials, as I’ve shown for years, but this is the fairest, most detailed analysis, to look into factors like home vs away, and opposition quality, to create a more accurate Expected Big Decisions model; as well as creating an Objective Ref Rater coefficient, which compares referees to the ‘norm’, and how far they stray from that in three separate metrics that I combine into one overall figure.
I also use only data, and make no subjective calls about what should or should not have been a red card or a penalty, except in a couple of cases where I go into more detail. We can argue all day long about what should or shouldn’t have been, but when there are giant gaps in the data, or massive skews, it tells the story in a way that arguing over one or two decisions does not.
Some of the key findings involve all referees (and VARs) and averages, and others focus on the outliers, whose data seems unusual.
I don’t like to suggest active corruption, but there are some patterns that, as I’ve said before, would be investigated if it involved betting. At the very least there is some serious human failures, beyond the acceptable errors you used to expect.
All refereeing data is via Transfermarkt’s excellent match-by-match rundowns, and VAR data is via Andrew Beasley and ESPN.
On average, a Main Four team gets 1.68 Big Decisions For for every one Big Decision Against, across the 1,200-game sample (with some double-counting for head-to-heads between the Main Four).
1.68:1
Note: I’m capitalising Big Decision to make it clear that it’s a penalty, red card or second yellow, and nothing else. As ever, we can’t count Big Decisions not given, just those that are, unless it’s not given by the ref but then given by the VAR. I’ll also capitalise For and Against. Plus, I’ll also call subjective VAR overturns Big Decisions. And ‘Homer' means what it sounds like, not a reference to The Simpsons. When I say ‘generous’, that’s in comparison using data and not a subjective judgement on any of the decisions.
Also, in this abridged version I’ve added the graphs and charts to the bullet points. Apologies if the ordering is a little erratic, but it was originally designed to be a summary.
Big Decisions (red cards, penalties, second yellows) change games.
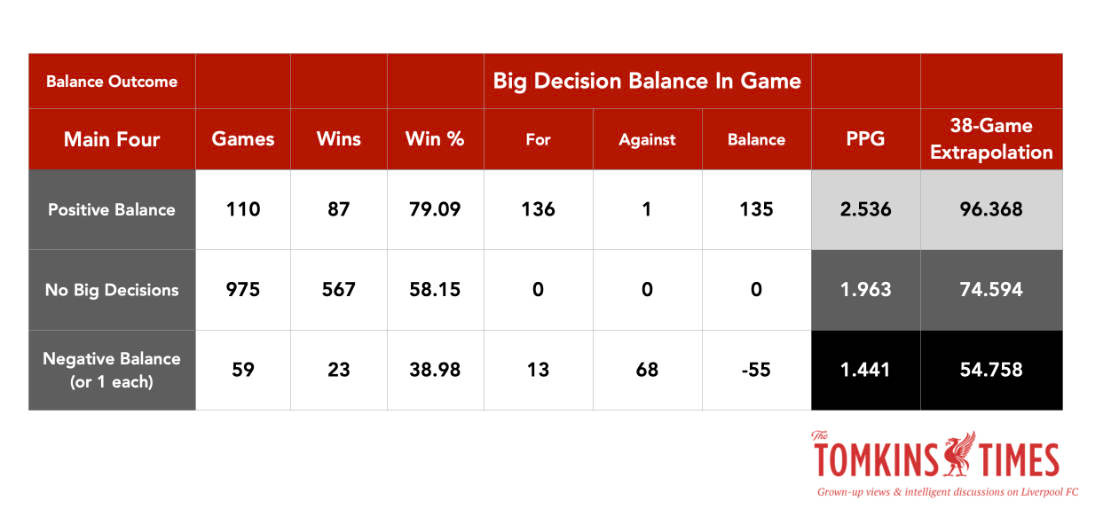
When extrapolated, basically, a Positive Balance of Big Decisions in a match comes out at virtual title-guaranteeing form; no Big Decisions For or Against is likely to see a team finish around 4th; while facing a Negative Balance within games would mean mid-table at best.
1.441 ppg – 54.8 season pro rata 38 games
1.963 ppg – 74.6 season pro rata 38 games
2.536 ppg – 96.4 season pro rata 38 games
So Big Decisions are huge. They are indeed Huge Decisions.
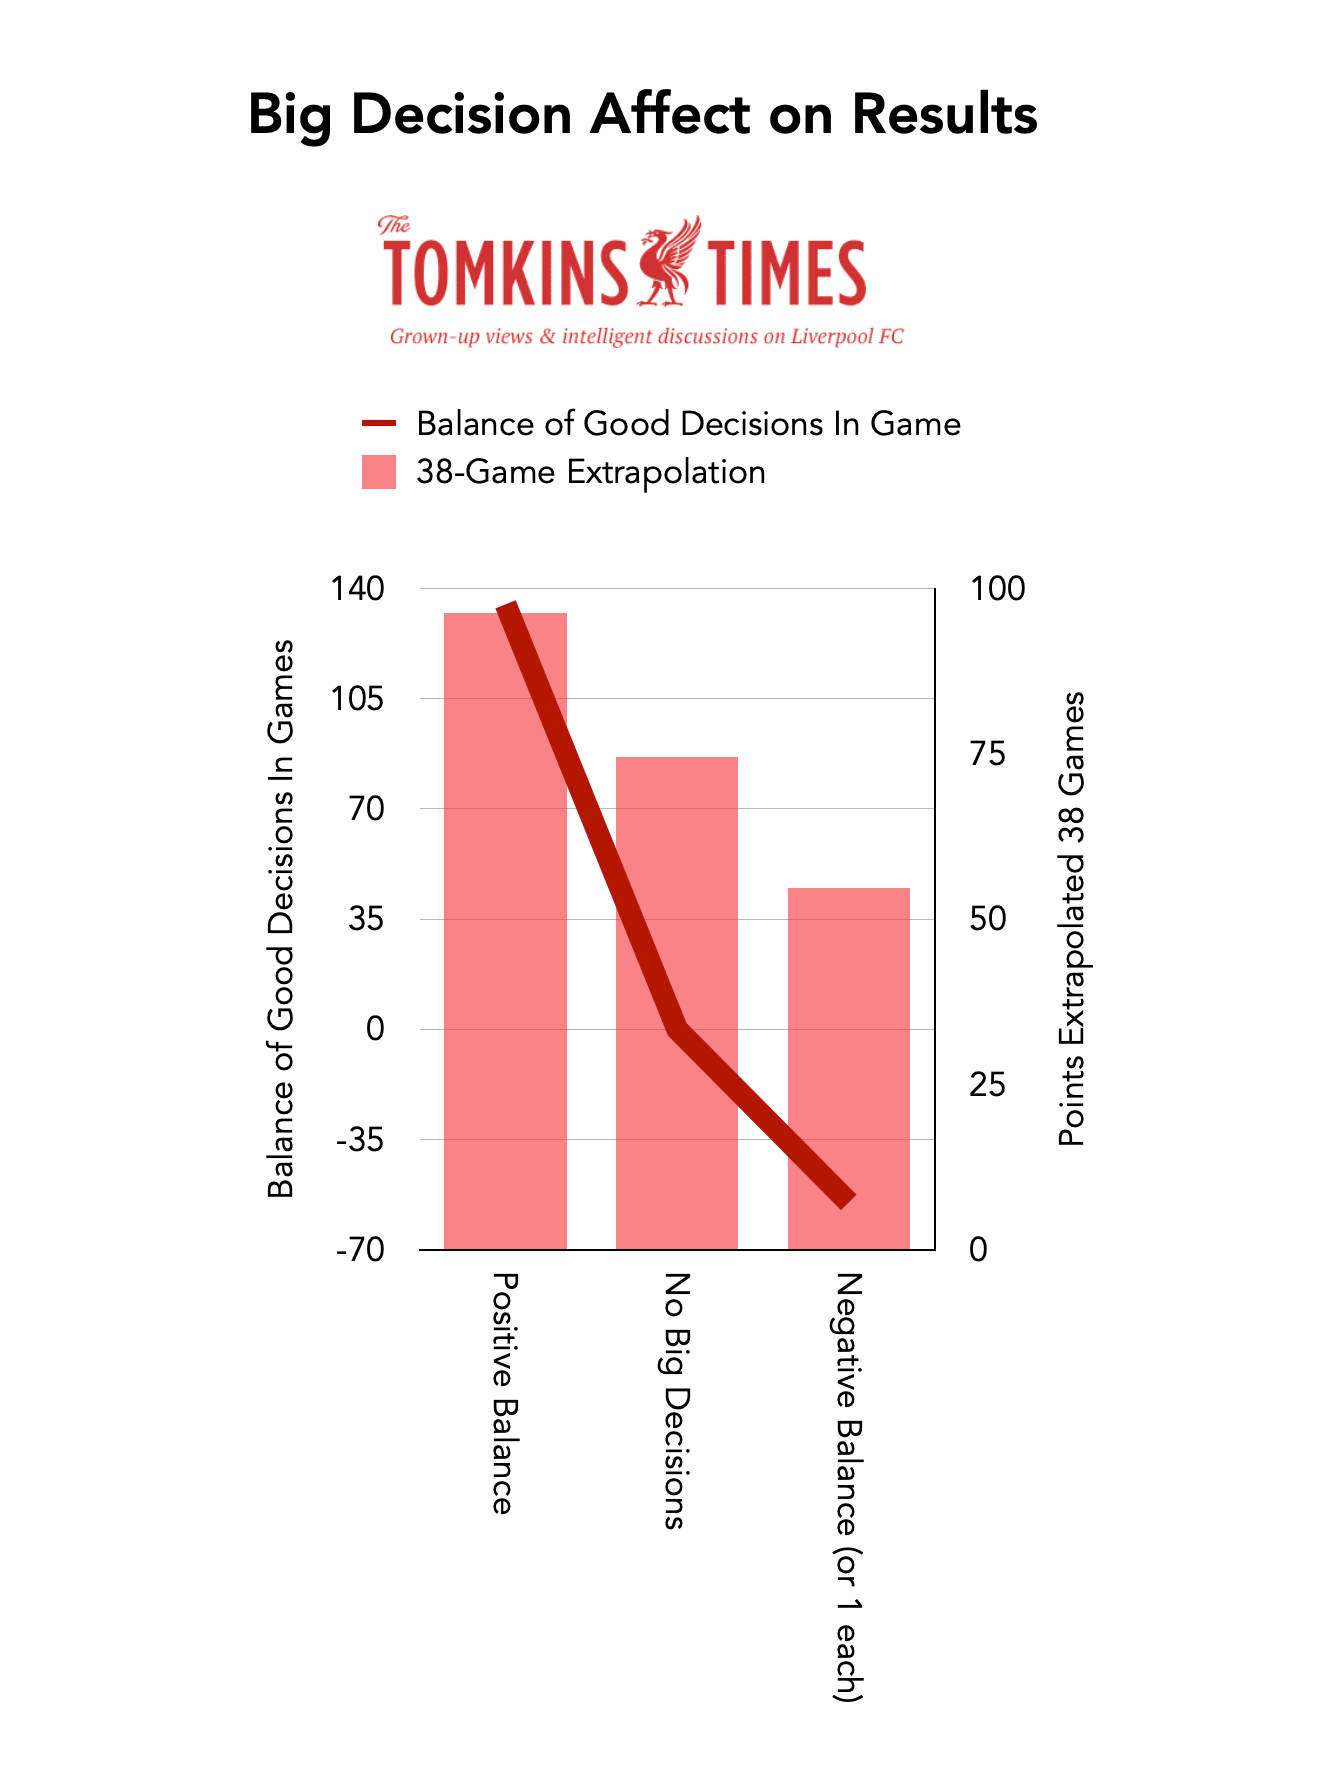
In the 1,200 Main Four matches covered since 2015, the pinkish bars below show the difference between one of those clubs having a positive balance of Big Decisions within a game; no decisions at all; and a negative balance, as 38-game pro rata extrapolations.
The best two referees via my Objective Ref Rater coefficient are Michael Oliver and Anthony Taylor; the two referees generally described, subjectively, as the best. This pair are very close to the expected norm, and I had no idea who would emerge as the top two. So it’s a good sign that the model is on the right tracks, even if no model can capture every aspect.
Taylor has made some terrible decisions in Liverpool games, but it’s fair to point out that this Mancunian treats Liverpool ‘okay’ (albeit mostly at Anfield, in contrast to many referees who seem like they have to prove their manliness by never giving decisions to Liverpool in front of the Kop).
Those ranked 3rd and 4th are Andre Marriner and Kevin Friend respectively. (Both recently retired.)
Several of the worst-ranking refs from the model now work as VARs or for the PGMOL, training the current referees.
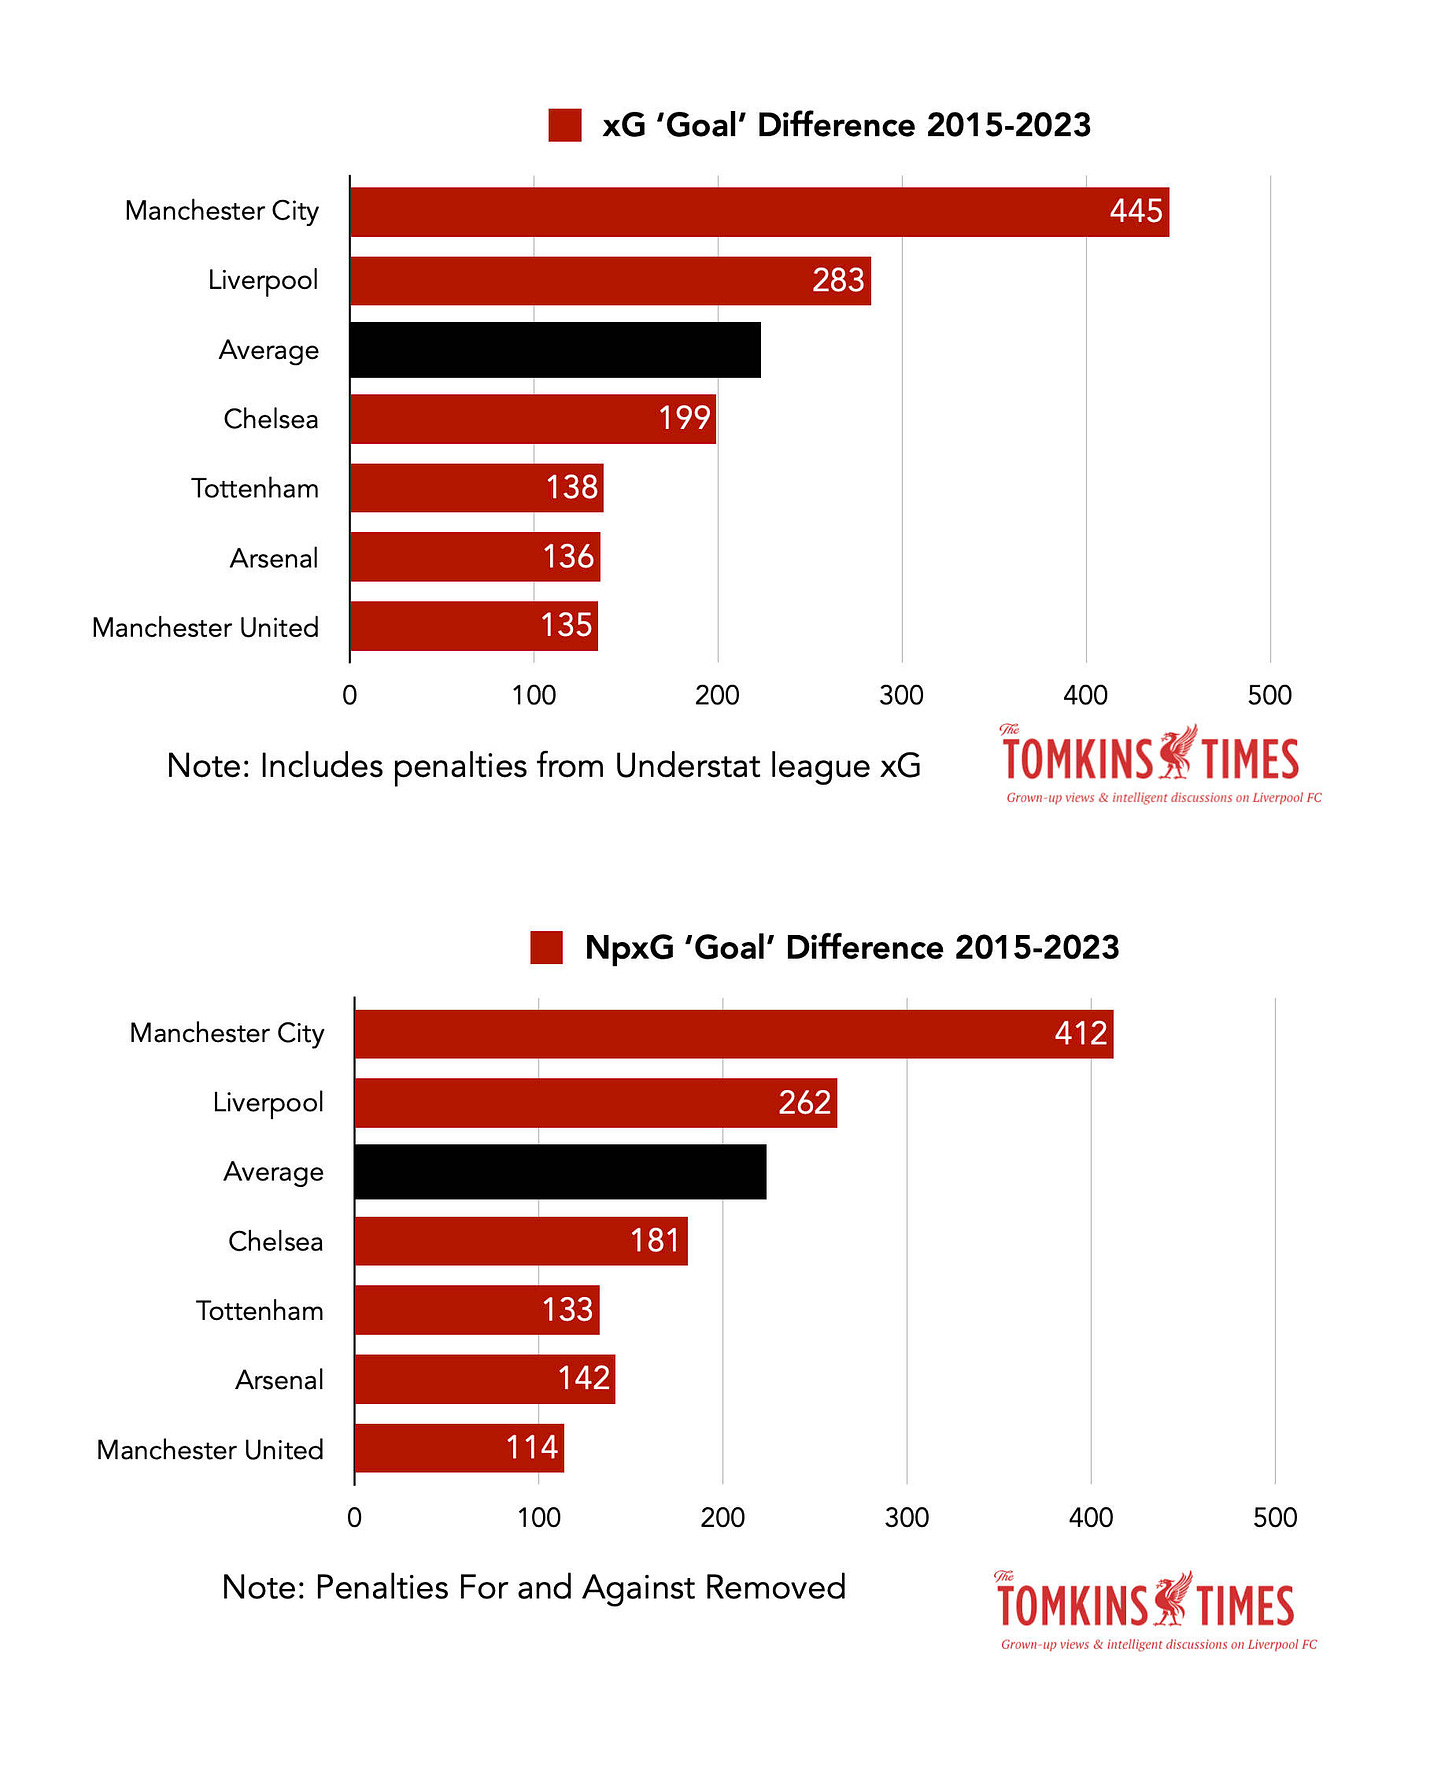
Manchester City, with the best xG ‘GD’ by a reasonable distance, get the best Balance of Big Decisions. This is to be expected. I have no issue with them getting the most penalties and having the best Balance of Big Decisions.
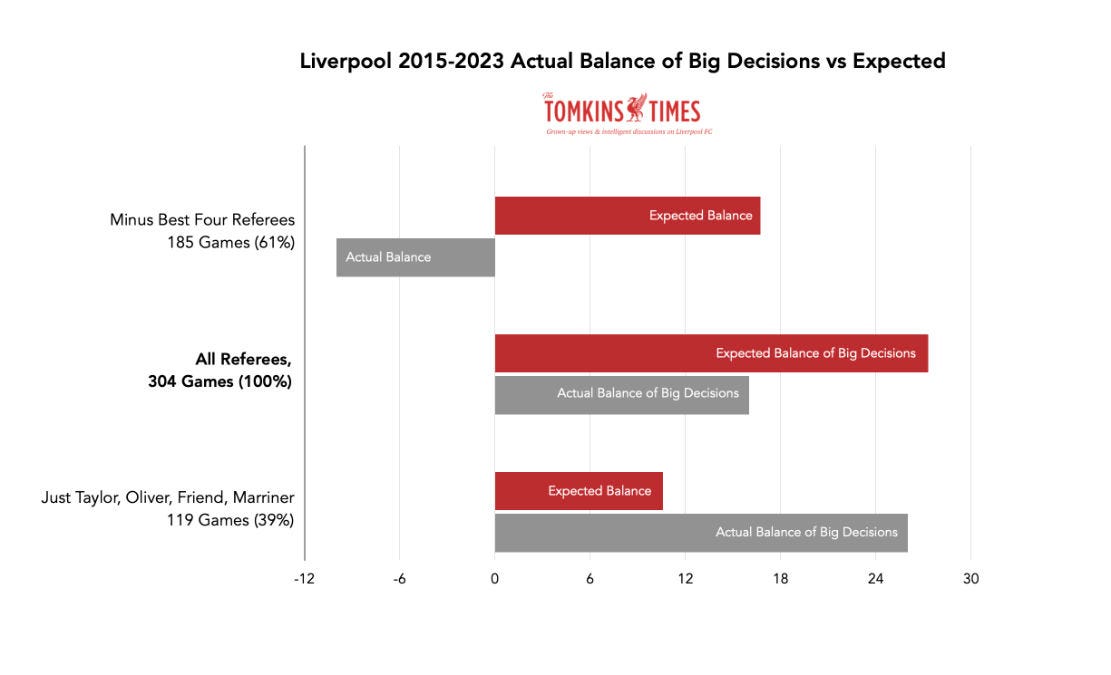
Liverpool, with the 2nd-best xG ‘GD’ by a reasonable distance, get the worst Balance of Big Decisions, at roughly 14 fewer than expected. This makes zero sense. However, when Liverpool have the best refs, the picture flips.
If Liverpool only had the refs objectively ranked as the best, or ‘most normal’, the Reds’ figures would be less freakishly bad; the worst (weakest?) refs, who do more games than the better refs, are extra-bad for Liverpool, it seems.
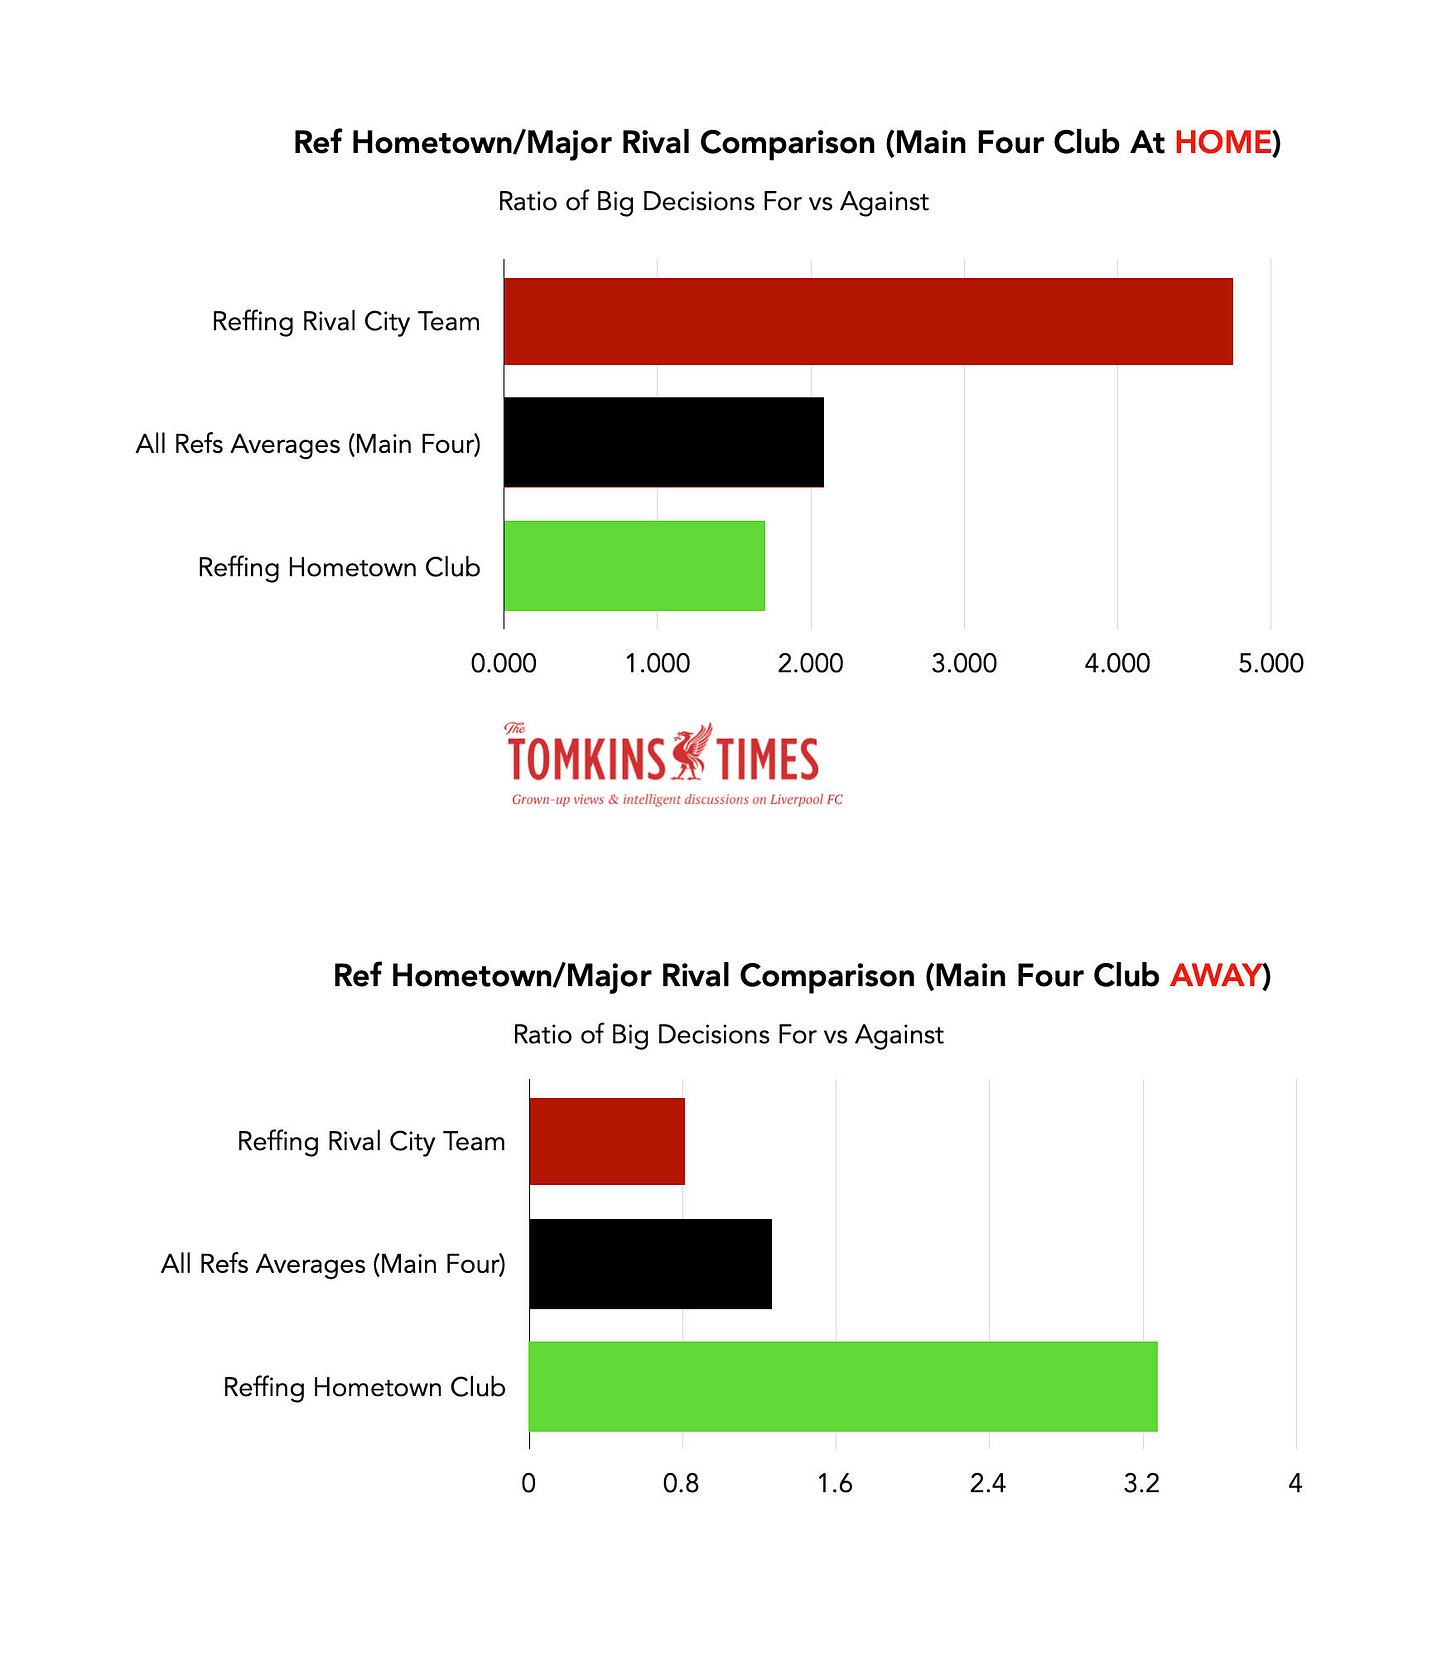
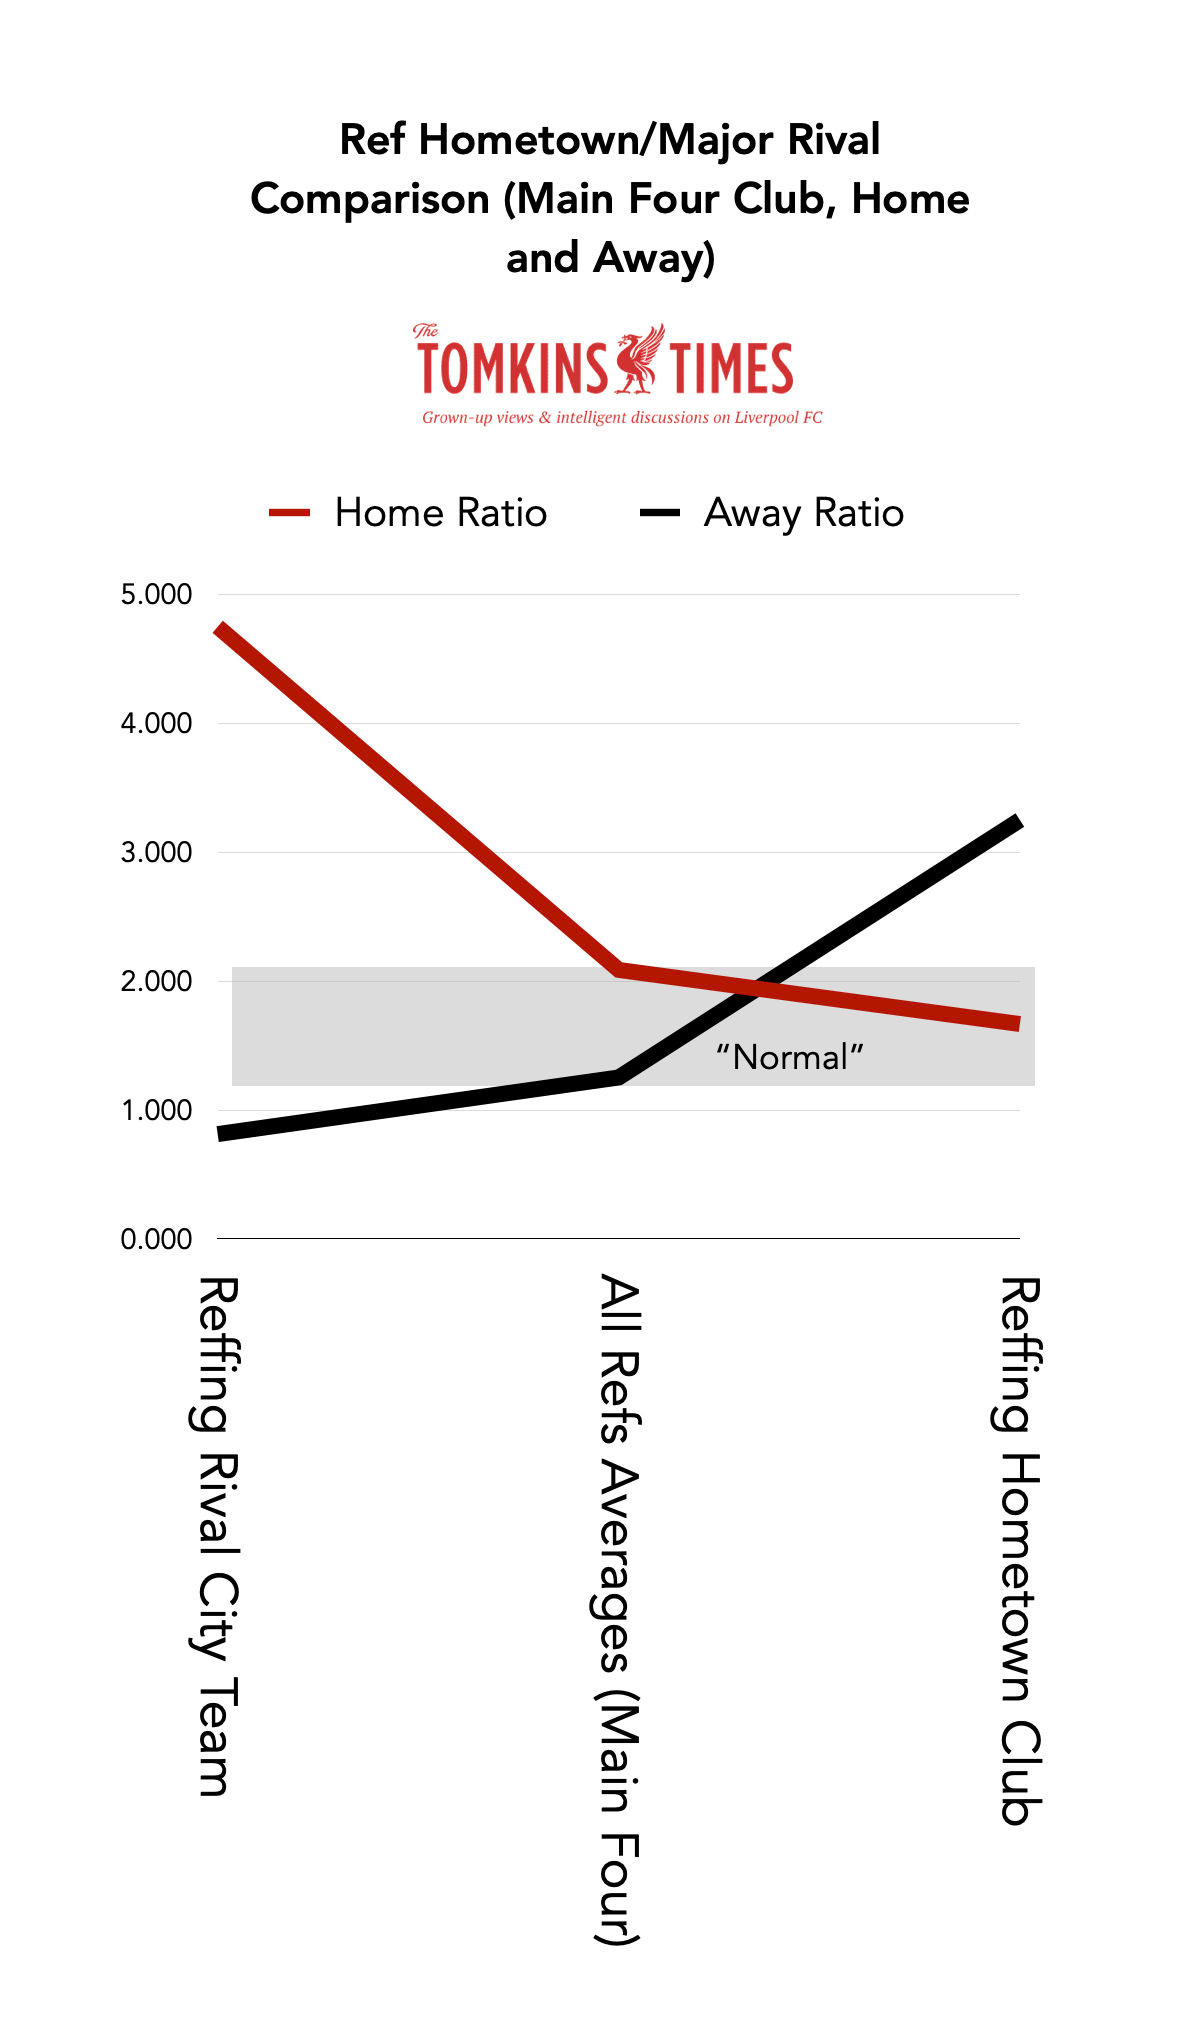
A finding of real interest is that, in general, Liverpudlian refs (or from Merseyside in general) are much more likely to give a Big Decision to Mancunian clubs in Manchester, but much less likely to give a Big Decision to Liverpool at Anfield (albeit the only Liverpudlian ref who has done Liverpool is Mike Dean.)
Conversely, a Liverpudlian ref is much less likely to give an away Big Decision to a Manchester club, and a Mancunian referee is much less likely to give an away Big Decision to Liverpool.
So, on this part of the study, we can say that “rival” refs are overly generous when at the home of the “enemy”, but then extra harsh on those clubs in away games, when not feeling the pressure to try and look as unbiased as possible. Normality is flipped on its head.
Whatever the reason beyond my subjective theory above, the data involving Liverpudlian and Mancunian refs in games involving Liverpool, Man City and Man United suggests an inability to referee “normally”. These are the kinds of issues I’ve been concerned about for years, including the feuds officials have that they cannot disguise (unless really forced to).
Referees who have done c.100 Main Four games since 2015 see their data cluster more tightly together around ‘normal’, with no extreme outliers – but still quite a reasonable divergence, from c. +0.3 extra Big Decisions For per game for some club/ref combos and -0.3 for others. This is roughly half the levels reached by the positive and negative outliers.
As a general fact, the home/away split for all Premier League penalties 2015-2023 is: 461 home (56.77%), 351 away (43.23%). Home clubs have the advantage of their fans, a familiar pitch, less travel, etc., and you would expect some home advantage that is not indicative of a ref being a Homer. That normal split can be said to be c.57:43.
A referee will make a Big Decision in a match involving a Main Four club every 2.74 games, with the ratio, as noted, 1.68:1 in favour of the Main Four club.
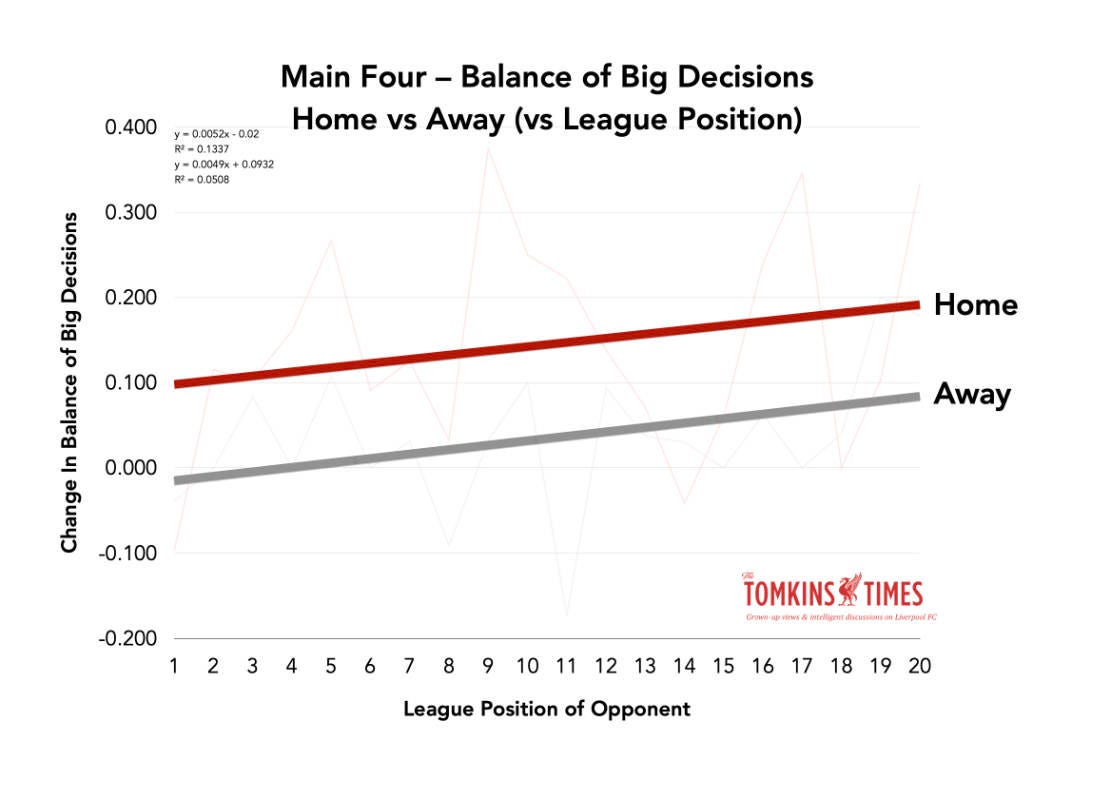
At home, Big Decision likelihood For a Main Four club doubles on a trendline, from playing the best teams (0.10 extra Big Decision) to worst teams (0.20).
However, at home, the Main Four between 2015 and 2023 averaged 2.2 Big Decisions for every 1.0 against. These are the strongest teams, so should be above the general league frequencies.
Away, Big Decision likelihood For a Main Four club also doubles on a trendline, from playing the best teams to worst teams; but it starts from a lower expectancy rate (just under 0.0), and rises to an expectancy rate very similar with playing the better teams at home (0.10). The trendlines for home and away Big Decisions for the Main Four are absolutely parallel.
These frequencies in easier/harder games are used in my Objective Ref Rater, and to create Expected Big Decisions, against which Actual Big Decisions can be compared.
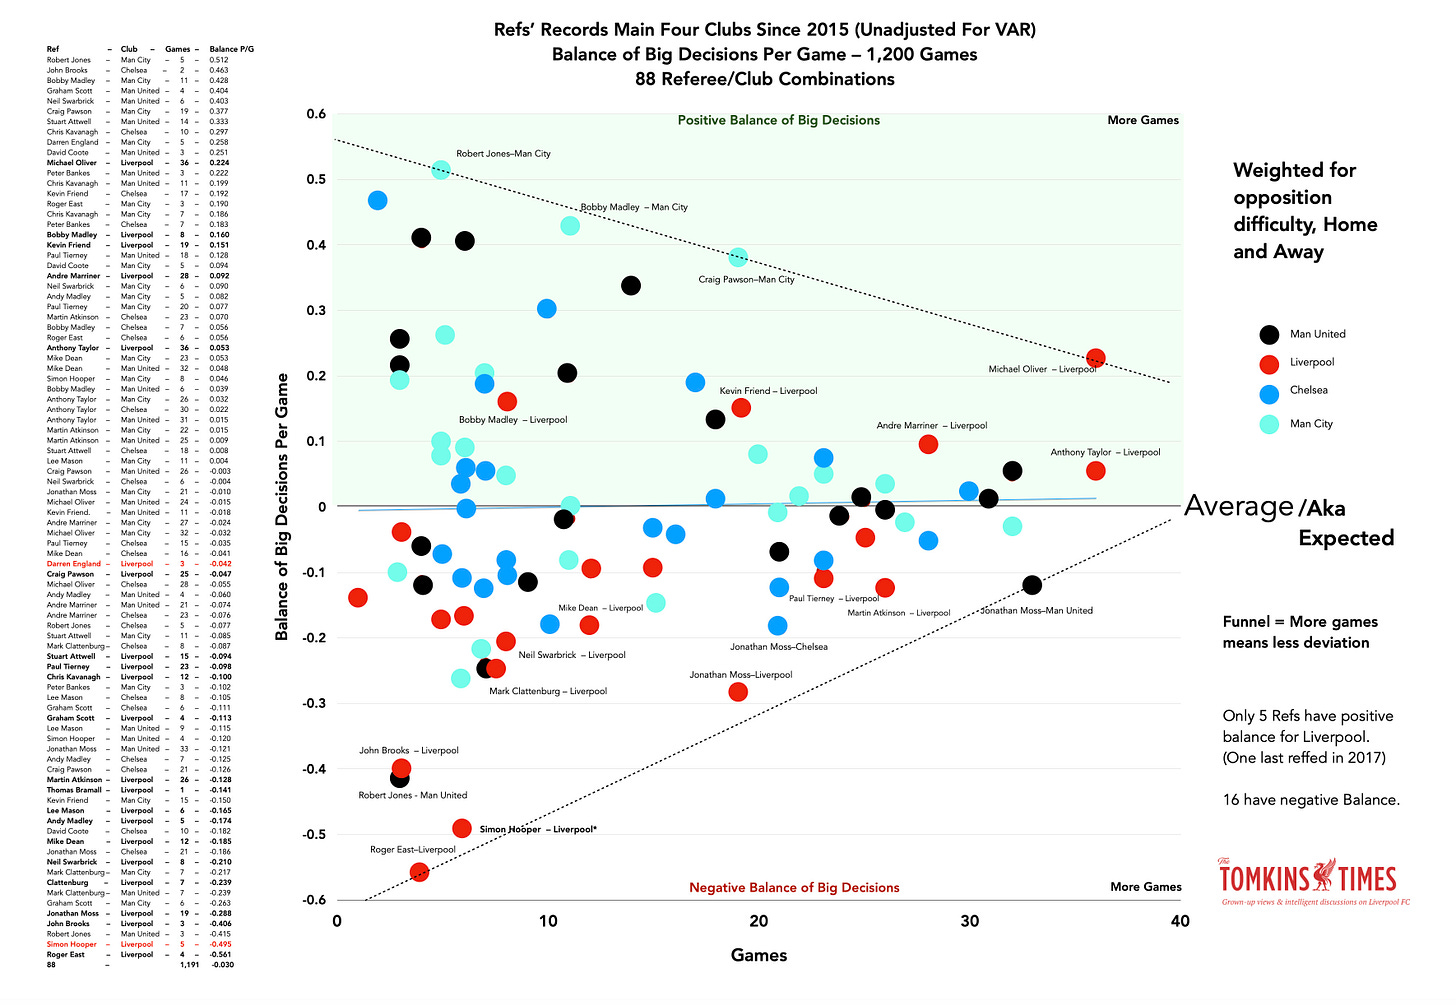
Only five referees out of the 22 to officiate Liverpool games since 2015 have given Liverpool a positive Balance of Big Decisions vs expectations. These just happen to include the four ranked objectively as the most ‘normal’ referees (Oliver, Taylor, Marriner and Friend); plus Bobby Madley, who hasn’t done a game for the Reds since 2017 due to suspension for inappropriate behaviour.
For the other three Main Four clubs, at least ten referees have given the club a positive Balance of Big Decisions vs expectations. While the following scatterplot is busy (sorry!), it contains the 88 ref/club combiations.
Of the refs who are way below expected Big Decisions for each of the four clubs (88 ref/club combinations), no fewer than ten of the harshest 17 are “referee/Liverpool” combinations. (This has now gone to 11 of 17, if adding Simon Hooper’s data from Spurs; a small sample size, as some of these are, but it’s a lot of similarly bad small sample sizes that add up to getting on for 200, or 2/3rds, of games.)
NEW: this is a quadrant of the scatterplot, showing 16 red dots of Liverpool below the line at 0, that represents par for expected Big Decisions:
Any of those refs in isolation mean little; but add all those samples together and you get hundreds of games.
Without Oliver and Taylor, Liverpool’s Big Decisions Balance (in the remaining 200+ games) would be more akin to a team below mid-table.
A VAR will make a subjective Big Decision intervention (so, not including offsides, etc.) every 8.38 games, or three times as infrequently as a referee on the pitch. (Which makes sense, as the ref should be seeing the obvious things with no need for the VAR to do anything other than confirm.)
Liverpool get by far the fewest subjective foul-based VAR Big Decisions of the Main Four, perhaps to counter the misleading #LiVARpool narrative. (They do get the most offside overturns, as incorrect offside decisions involving Liverpool by a lino are massively higher than for the other three clubs. Again, this is interesting given what should have happened at Spurs this weekend, as is why assistant referees are so eager to flag.)
Stuart Attwell is also by far the biggest Homer, with almost all of his decisions going to whoever is at home (20 out of 25): the Main Four team, or if an away game, the team at home against the Main Four side. Attwell is also the ref most likely to favour a Main Four team, albeit done mostly at home, naturally.
By some distance, Liverpool games feature the fewest Big Decisions.
Also, the fewest VAR overturns.
Also, the fewest yellow cards.
Plus, the fewest penalties.
(And no second yellow card for an opponent since 2015, when all other regular Premier League clubs have at least five, and Spurs are nearing 10.)
At times it seems like referees and VARs are totally passive during Liverpool matches; this season it’s been like they’ve not actually been on duty when it comes to obvious errors. (But at other times the refs and VARs are on overdrive. Four red cards?!)
Paul Tierney’s overall data is fairly normal, but in his case, the contrast between his record for Liverpool (as both a ref and a VAR) and the other Main Four clubs is what leads to my constant questioning of his suitability. For the other clubs his VAR decisions are almost all in their favour; and for Liverpool, 100% are against (three, all going to Manchester clubs), two of which were highly dodgy (even Gary Neville and Roy Keane called an apparent foul on David de Gea ludicrous).
Refs do not make anywhere near as many bookings at Anfield. At Anfield, away players are booked only 93.4% as often as they are at Old Trafford, 85.2% as often as they are at the Etihad, and 78% as often as at Stamford Bridge. This may partly explain why no opposition player ever gets a second yellow card (a Big Decision) when playing Liverpool, as they more rarely get the first. (Graphs below from last season.)
Teams’ win percentages can still be high with ungenerous refs, and low with more generous refs. But on average, Big Decisions change results by a big margin.
Rankings for Premier League penalties won per season since 2015: 1 Manchester City; 2 Leicester City; 3 Brentford; 4 Manchester United; 5 Crystal Palace; 6 Brighton; 7 Nottingham Forest; 8 Chelsea; 9 Fulham; 10 Liverpool. Dispels myth that smaller clubs don’t get Big Decisions. (Palace, like some other clubs, also beneficiaries of lots of opposition red cards, and are the biggest beneficiaries of 2nd-yellows.)
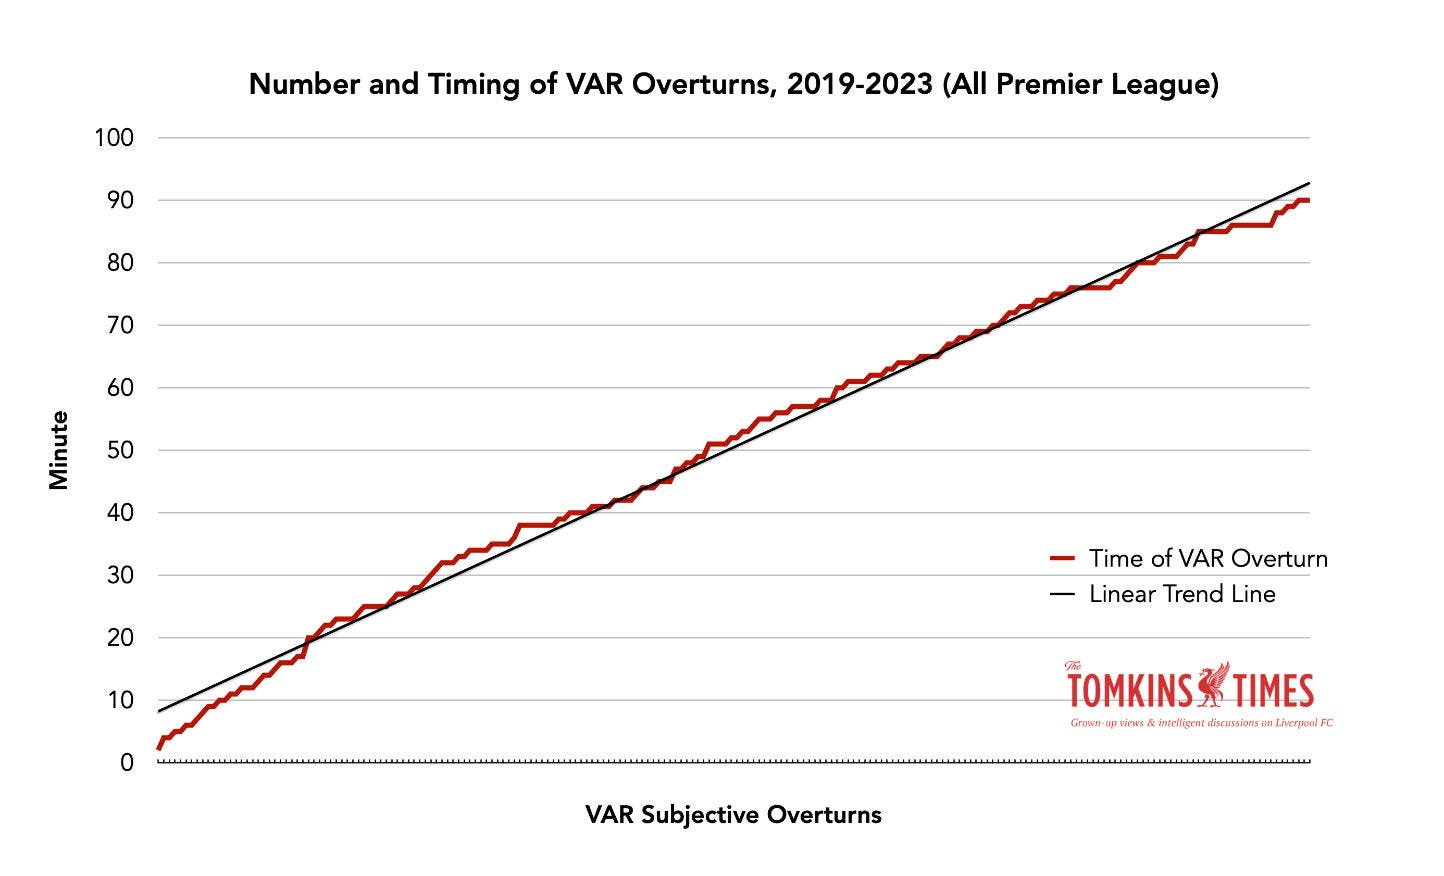
VAR Big Decisions tend to be consistent and steady within the timeframe of a match, with 2.62 overturns for every minute-time of the game (1-90); 236 subjective overturns in total as of early September 2023. (Involves some double-counting in Main Four head-to-heads.)
Subjective overturns have a natural distribution that makes for a lovely logical graph (below) – but only after the first 20 minutes; the first ten minutes sees very little action, as if it’s deemed too early to intervene (just as a bad early tackle is more likely to be given as a yellow card by the on-field ref).
Only Chelsea have to wait longer than the Reds for a Subjective Player-To-Player Big Decision, at 45 minutes to Liverpool’s 43. Man City have to only wait 12 minutes for their first For; as do Man United.
The average time of Subjective Player-To-Player Big Decisions For for Chelsea and Liverpool is over the 60-minute mark. For the Manchester clubs, it’s under 50 minutes.
As such, the treatment by VAR of Chelsea and Liverpool is vaguely similar, but Chelsea do better. The treatment of those two clubs in contrast to the Manchester clubs is alarming. What is going on?
Again, Liverpool games involve fewer VAR subjective calls than the average of the other three Main Four teams.
Excluding offsides and handballs, so focusing purely in fouls and other physical player-to-player decisions (“Subjective Player-To-Player Big Decision”), Liverpool’s VAR balance is -2 (now -3 after the trip to Spurs). All the other clubs have a positive balance.
Anfield has seen Liverpool have just three VAR Subjective Player-To-Player Big Decisions For the Reds.
Penalties vary in relation to quality of teams involved; red cards do not.
One thing I showed a couple of years ago was that over a seven-year period and 600 Premier League penalties, foreign defenders were penalised more than expected (based on share of minutes played), and homegrown attackers won far more penalties than expected (again, based on share of minutes played). So it’s not helpful to have foreign strikers and foreign defenders if you want Big Decisions.
Active Refs
Positive for Liverpool In Bold, negative in italics.
Ref – Club – Games– Balance P/G
Michael Oliver, Liverpool 36 +0.224
Anthony Taylor, Liverpool 36 +0.053
Darren England, Liverpool 3 -0.042
Craig Pawson, Liverpool 25 -0.047
Stuart Attwell, Liverpool 15 -0.094
Paul Tierney, Liverpool 23 -0.098
Chris Kavanagh, Liverpool 12 -0.100
Graham Scott, Liverpool 4 -0.113
David Coote, Liverpool 1 -0.137
Thomas Bramall, Liverpool 1 -0.141
Andy Madley, Liverpool 5 -0.174
John Brooks, Liverpool 3 -0.406
Simon Hooper, Liverpool 5 -0.495
Expected Big Decisions vs Actual Big Decisions
Since 2015, and based on the averages for the Main Four, Liverpool ‘should’ have had 68.82 Big Decisions For, and 41.51 Against.
The Against is spookily accurate: 39. (Now over 40 after the two at Spurs.)
But the For has 14 missing Big Decisions in the Reds’ favour. These are penalties, straight red cards and second yellows.
Indeed, all of the Main Four, with all refs, have very similar Against data, when judged against the benchmark of average Big Decisions for the Main Four.
(All clubs have the same expected Big Decisions For and Against per game, as it’s the average; but the slight variation comes from a different number of games they have played, with referees who have only done a couple of games excluded from the study. But pretty much everything in this study is to a per-game basis.)
Expected Big Decisions Against vs Actual
Liverpool 41.51 (39 actual) -2.51
Chelsea 39.67 (39 actual) -0.67
Man City 40.53 (44 actual) 3.47
Man United 40.46 (40 actual) -0.46
Only Man City are out by a few percentage points, to their detriment.
But when it comes to Positive Big Decisions, or Big Decisions For, this is where the Liverpool curse kicks in. Most just don’t like giving Liverpool Positive Big Decisions.
Expected Big Decisions For vs Actual
Liverpool -13.82
Chelsea -3.03
Man City +13.67
Man United +3.35
Almost 14 missing penalties to Liverpool (and/or red cards to opponents) over an eight-year period, or getting up towards two per season. That the Reds have been punished by 2.51 fewer decisions Against than expected (again, until the trip to Spurs!) still means a net harm of over 11 missing Big Decisions in the Reds’ favour.
As noted elsewhere in this study, a positive balance of 11 Big Decisions for your team is worth an average of seven points (0.6 per Big Decision Per Game), but it all depends on when they were given.
Considering that Liverpool lost two titles by 1-2 points, and missed out on the top four in 2022/23 by four points, this could be massively costly in terms of league titles and, less likely but not impossible, Champions League participation in 2023/24.
Seven points might not sound a lot across eight seasons, but if just a couple of those points were distributed in a tight-run campaign, a lot could have changed.
That said, looking at Decisions For, Man City are at +13.67 since 2015, but they are that far ahead of the average of Chelsea, Man United and Liverpool in xG (and pretty much all other metrics) that they should probably be well ahead in the pack of four, from which the benchmark average is set. So that seems fair enough.
However, Liverpool are also ahead, on average, of the combined average xG differences of Chelsea, Man United and City.
Yet the other three clubs’ combined average of Big Decisions For is 4.66 more than expected; Liverpool’s is -13.82. That’s the issue - the smoking gun, the magic bullet, the bombshell and the rug ripped from right underneath the Reds.
And it’s not just the Reds’ negative figure, but Man City’s positive Balance; much of which they merit, but this:
Liverpool -13.82
Man City +13.67
… in terms of Balance of Big Decisions 2015-2023 (with Chelsea and Man United in between) is still seriously flawed.
That said, Liverpool won the league with 99 points and just five penalties in 2019/20, so in stark contrast with the title bid of 2013/14 (when Brendan Rodgers’ team won 12), not with the help of officials.
(As I’ve noted many times, Liverpool win more penalties with more English players, and every single season since 2004 that either Rafa Benítez or Jürgen Klopp has managed, the Reds rank lower in the penalty league table than the actual league table; but for the other years, the Reds finished higher in the penalty table.)
Man United won 14 penalties in 2019/20 and 12 the season before, albeit City’s distribution is more steady.
And of course, red cards is another area where the Reds are weirdly treated; especially 2nd-yellows for opponents, which is basically no longer a thing for Liverpool opponents. (I’ll keep repeating: the last, at the time of writing, was eight years ago: Sadio Mané, for Southampton.) Refs seem to have little problem giving Liverpool players a second yellow.
Even now, during Klopp’s tenure, Man United have had 15 extra Big Decisions For, compared to Liverpool. And Anfield seems to play a big part in the weirdness.
Conclusion and Roundup
• See full version of the article for the analysis.
There are biases that I've pretty much proven in this study, especially the Homer refs, and the Liverpudlian/Mancunian anti-bias. Both of those are examples where refs cannot be making normal, rational decisions.
That so many refs treat Liverpool harsher than expected seems to be an increasing trend, led by the younger and less experienced refs, whose individual data is noisy but when combined it shows why Liverpool get so few Big Decisions.
If the PGMOL release the audio of the Hooper/England clusterfuck, then I'll believe their explanation, but it seems to me that it's likely to be Hooper asking England if he's completed level 16 of Angry Birds.
This is a chance to reset, regroup and rethink how they operate VAR and how they choose referees for games. Because, the best league in the world has the most shambolic refereeing system, cloaked in secrecy and where even the efforts transparency are token. (Where was the VAR dialogue by Tierney and Hatzidakis when Mac Allister was ludicrously sent off by a rookie ref?)
And in addition, they are sending refs to Saudi and the UAE, which opens them up to further questions about integrity given the ownership models in the Premier League; but also, just the ludicrous nature of flying around the world ahead of doing games for the very league their supposed to be focusing on.
I don't expect a fully equitable outcome as I don't believe life, and sport, is designed for equal outcomes. But there are other ways to be fair.
Liverpool need a fair crack of the whip; the removal of referees with problems doing the club, and to be like other clubs who get their fair share (or more) of Big Decisions. Quite frankly, Liverpool under Klopp do not.
It may have cost the Reds a league title or two, it's that major. But also, we won't know how games would have unfolded had the Reds not been forced to play with 10 or nine men, or not get the penalties other teams regularly get.
And what would have happened if, in the last 300 or so games, an opposition player had actually been given a second yellow card?
I mean, crazy stuff like that. It happened so long ago that the player in question later joined Liverpool, played 269 games for the club, spent a season in Germany and is now in Saudi Arabia.
I know, I'm asking too much, clearly.
Thank you for reading this free article. Apologies for anything that doesn’t quite make sense, as I’ve tried to create this ASAP, based on feedback from the TL;DR brigade, and in fairness, I understand that a 16,000-word study is not easy to read. I just felt that I had to do a proper, detailed job, and explain my thinking around the objective data and the conclusions.
As such, what I have to say makes more sense in the full version, as I cannot distil so many ideas into a shorter piece without losing vital context. This version is a quarter of the length of the original.
• See full version of the article for the analysis.
Comments are for paying subscribers only as part of our respectful and well-informed global community. This is where I spend most of my time discussing football and the Reds.
Keep reading with a 7-day free trial
Subscribe to The Tomkins Times - Main Hub to keep reading this post and get 7 days of free access to the full post archives.


