


Quick (Stunning) Foul Balance Update – Liverpool's Shocking Treatment Gets Worse
An accessible study proving 99.9% correlation between possession vs Foul Balance, data from c.1,000 games

As I noted very recently, the relationship between possessions and Foul Balance is the first time I’ve found a 99.9% correlation in football data. I wanted to take it a stage further, but in a shorter piece (under 2,000 words).
Even a many-seasons study of goals scored, goals conceded and goal difference that I recently ran came out with 80-90% correlations to final league position.
Then this:

Up, and to the Right
This, above, shows possession rising towards the right of the graph, and Foul Balance being better towards the top of the graph, is ‘R2=0.9967’ correlated, which means 99.9%, but would round up to 100%.
So this graph *proves* that there is a 100% correlation between the more possession you have and the better outcome on Foul Balance, based on almost 1,000 Premier League games by the big clubs, and the better performing smaller clubs, 2022-2025*.
It makes total sense, as you generally need to have the ball to be fouled, so the more you have the ball, the fewer fouls you make. No wonder it correlates 100%.
This line, trending upwards and to the right, is the symbol of fairness.
Now, individual games will always fall outside the patterns, and sometimes wildly. There will be outlying examples that do little to disturb the averages.
Just as xG Difference massively correlates with goals scored and conceded, there can always be games where you create 5xG and score none, and the opposition sometimes has 0.1xG and scores a goal.
But on average, once you get into proper sample sizes, it roughly evens out, even if not to 100%.
For instance, this season, for the Reds, it’s nearly perfectly averaging out:
In 34 games in the Premier League and Champions League, Liverpool’s actual goals For and Against average out at:
2.32F, 0.91A
The xG averages out at:
2.28F, 0.90A
So, virtually identical. (And elite!)
Academic and Liverpool fan Mike Taylor, whom I’ve known online for 25 years since I first started writing about the Reds, suggested doing scatterplots of individual teams, and I took his advice.
So in this short article I will show a series of graphs for clubs and their last 100 Premier League games (which basically means since the start of 2022/23), and also a series for this season’s first 25 league games, to see how things might have changed.
100 Games
So, let’s look at the last 100 Premier League games for each of the main clubs, and see if their own individual data matches the trend, before moving on to this season.
(BTW, Stuart Attwell is VAR at the weekend. Have a look at this article for videos of a litany of glaring errors when VARring Liverpool. And no, it’s not a podcast, but remains trapped in a podcast article format! My paranoia is not helped by the constant appointments of Paul Tierney and Stuart Attwell as VARs, given that they give Liverpool NOTHING. But I digress…)
So, look at the graphs, and see if the line moves up and to the right.
(Up, and to the right.)
Emerging from the negative red space, into the positive white space. (Or in the case of Aston Villa and Man City, at no point averaging in the red, while Newcastle are almost entirely in the positive zone and moving up and to the right.)
(“Up and to the right, up and to the right”; it sounds a bit like descriptions of JFK’s head after being shot. Hopefully this piece is not quite as conspiracy-minded.)


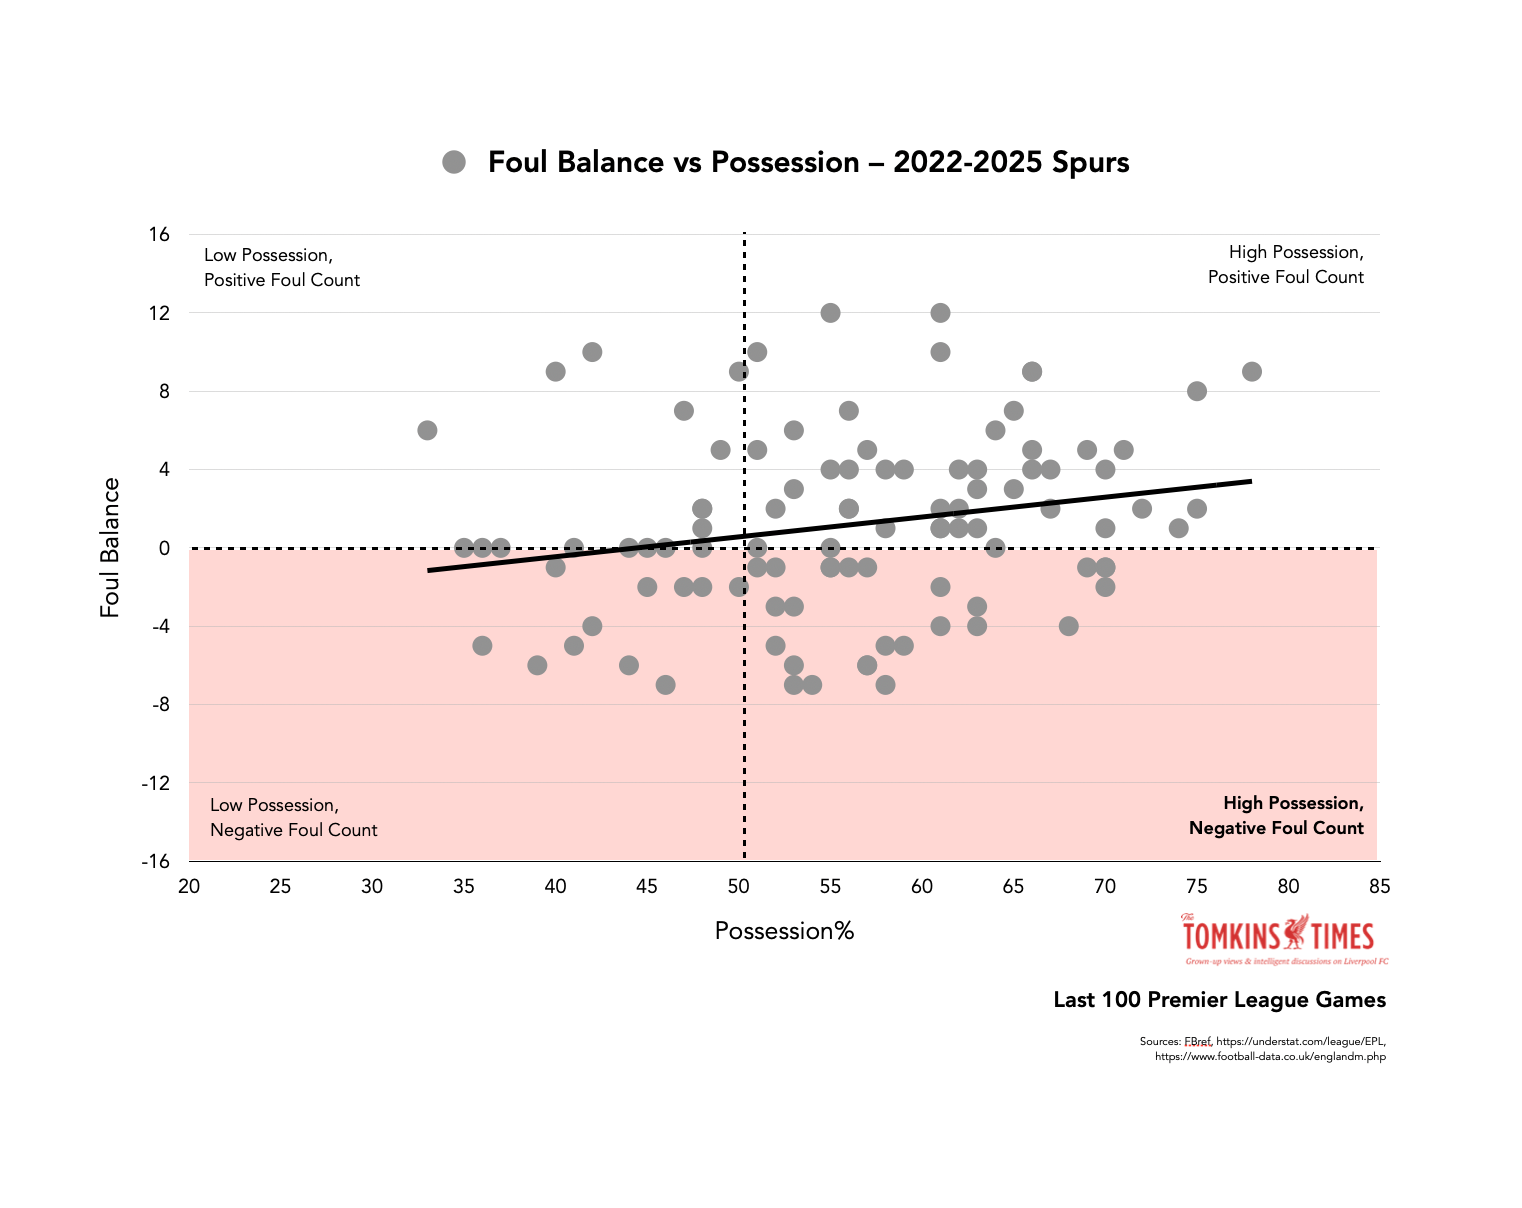


Some clubs have less possession, and thus have a poorer Foul Balance.
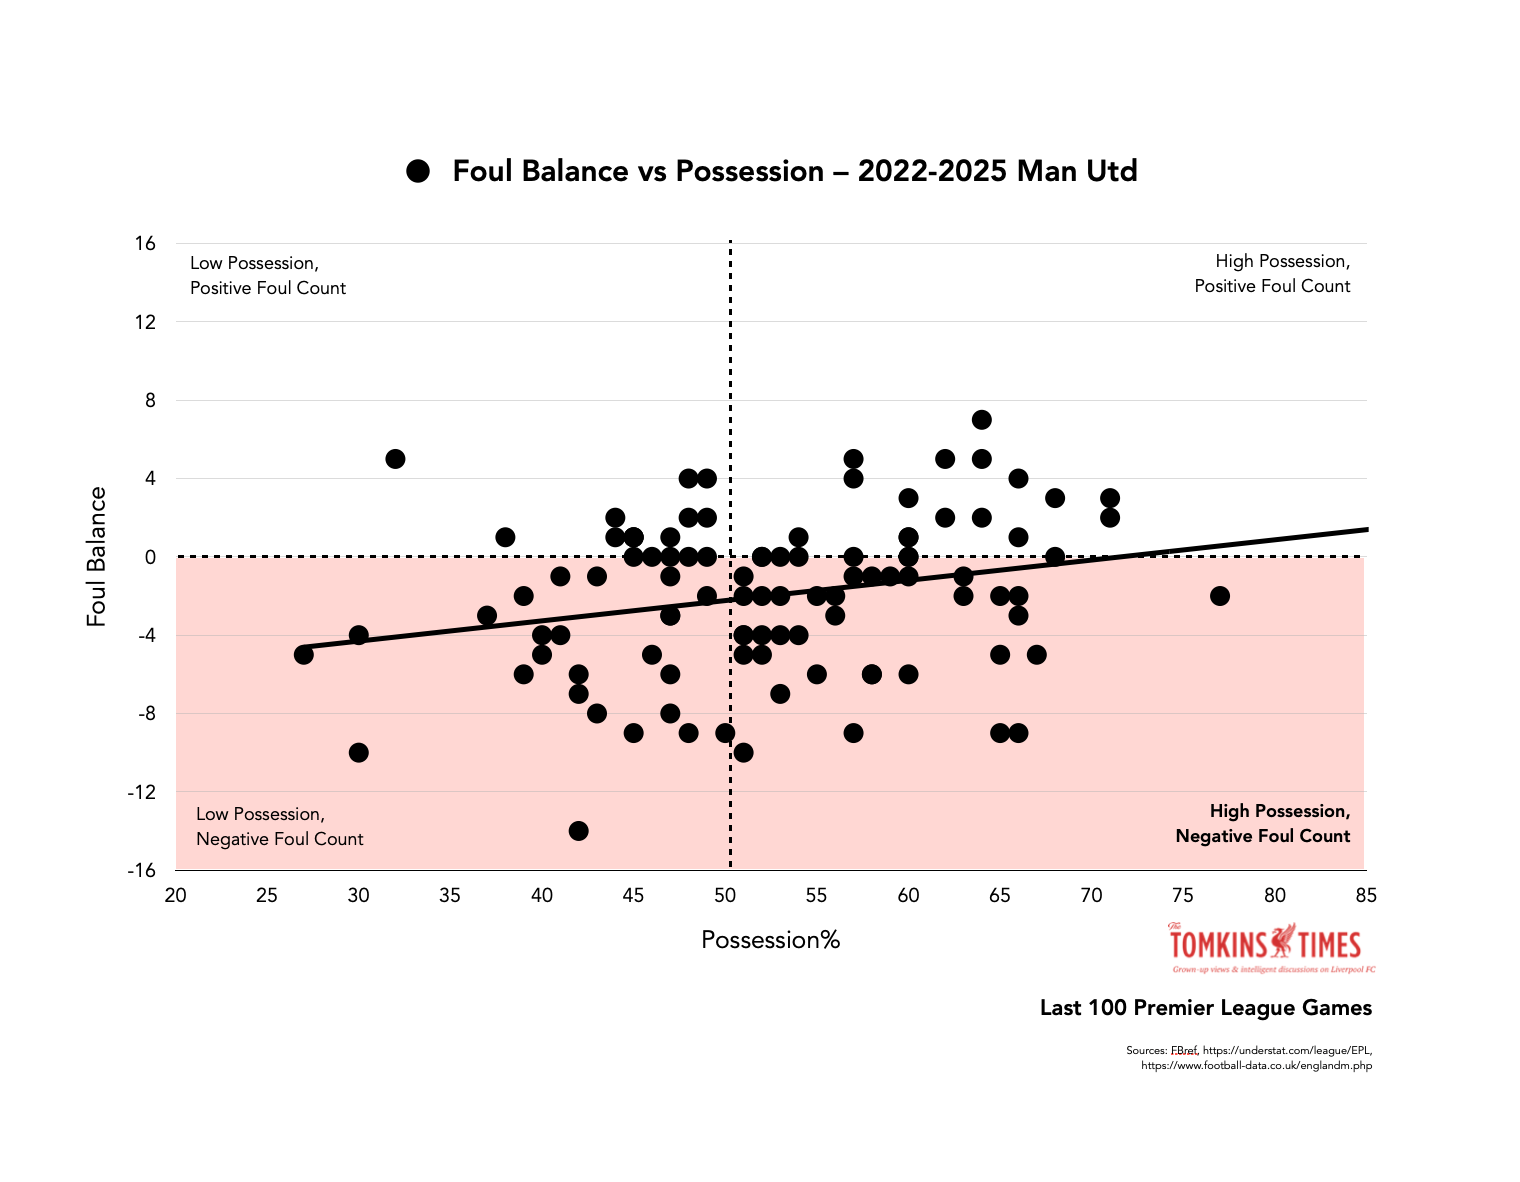
Man United have a poor Foul Balance, but again, poor possession. Even then, the trend is up and to the right. (Up and to the right.) But they are the only other side to average a negative Foul Balance in the study, just not as bad as Liverpool’s average.
The only one that is not up and to the right?
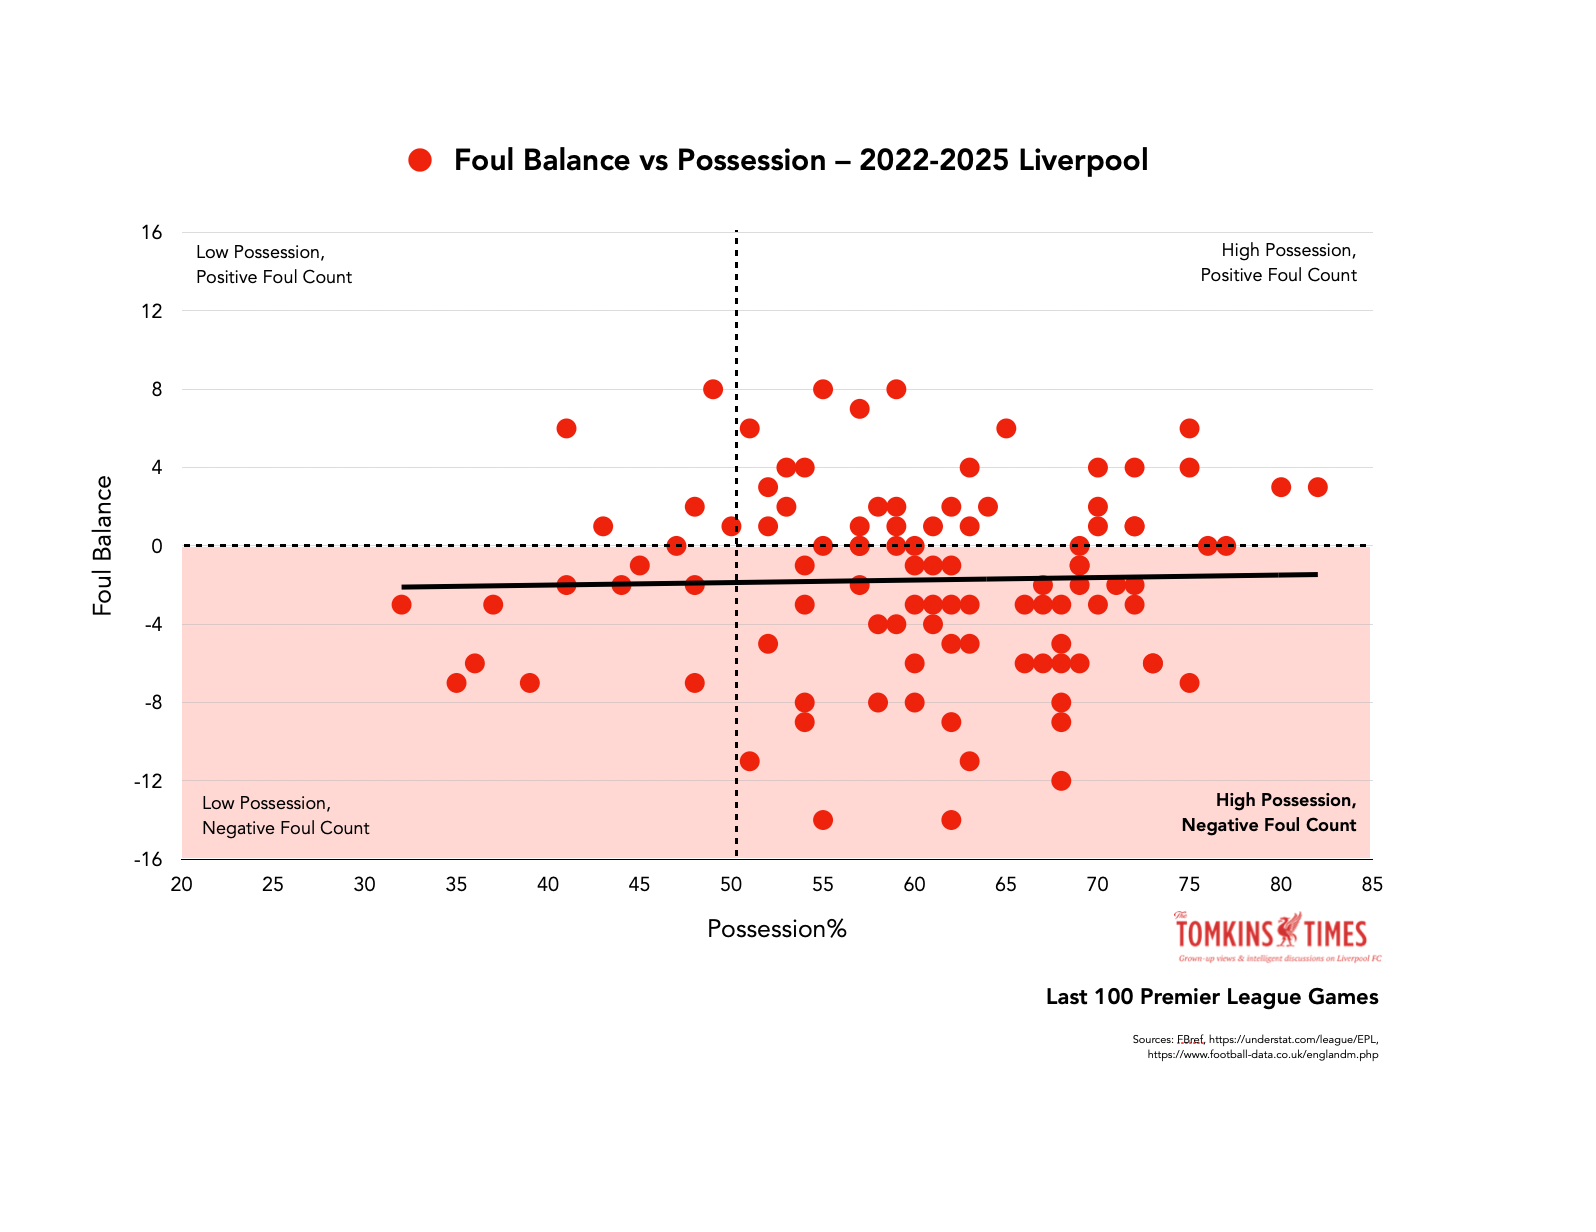
Liverpool. Whatever the possession average, the Foul Balance remains constantly negative, ranging from around -3 to -1. Even with 100% possession, Liverpool would still narrowly lose the Foul Balance.
Instead of a good hard elevation, that’s flat and flaccid.
Next, this season.
2024/25 Foul Balance vs Possession
Arsenal have had a few issues with red cards, and their Foul Balance this season is worse than usual, and slightly in the red, but it’s still just about trending up and to the right.
The rest follow the usual pattern.

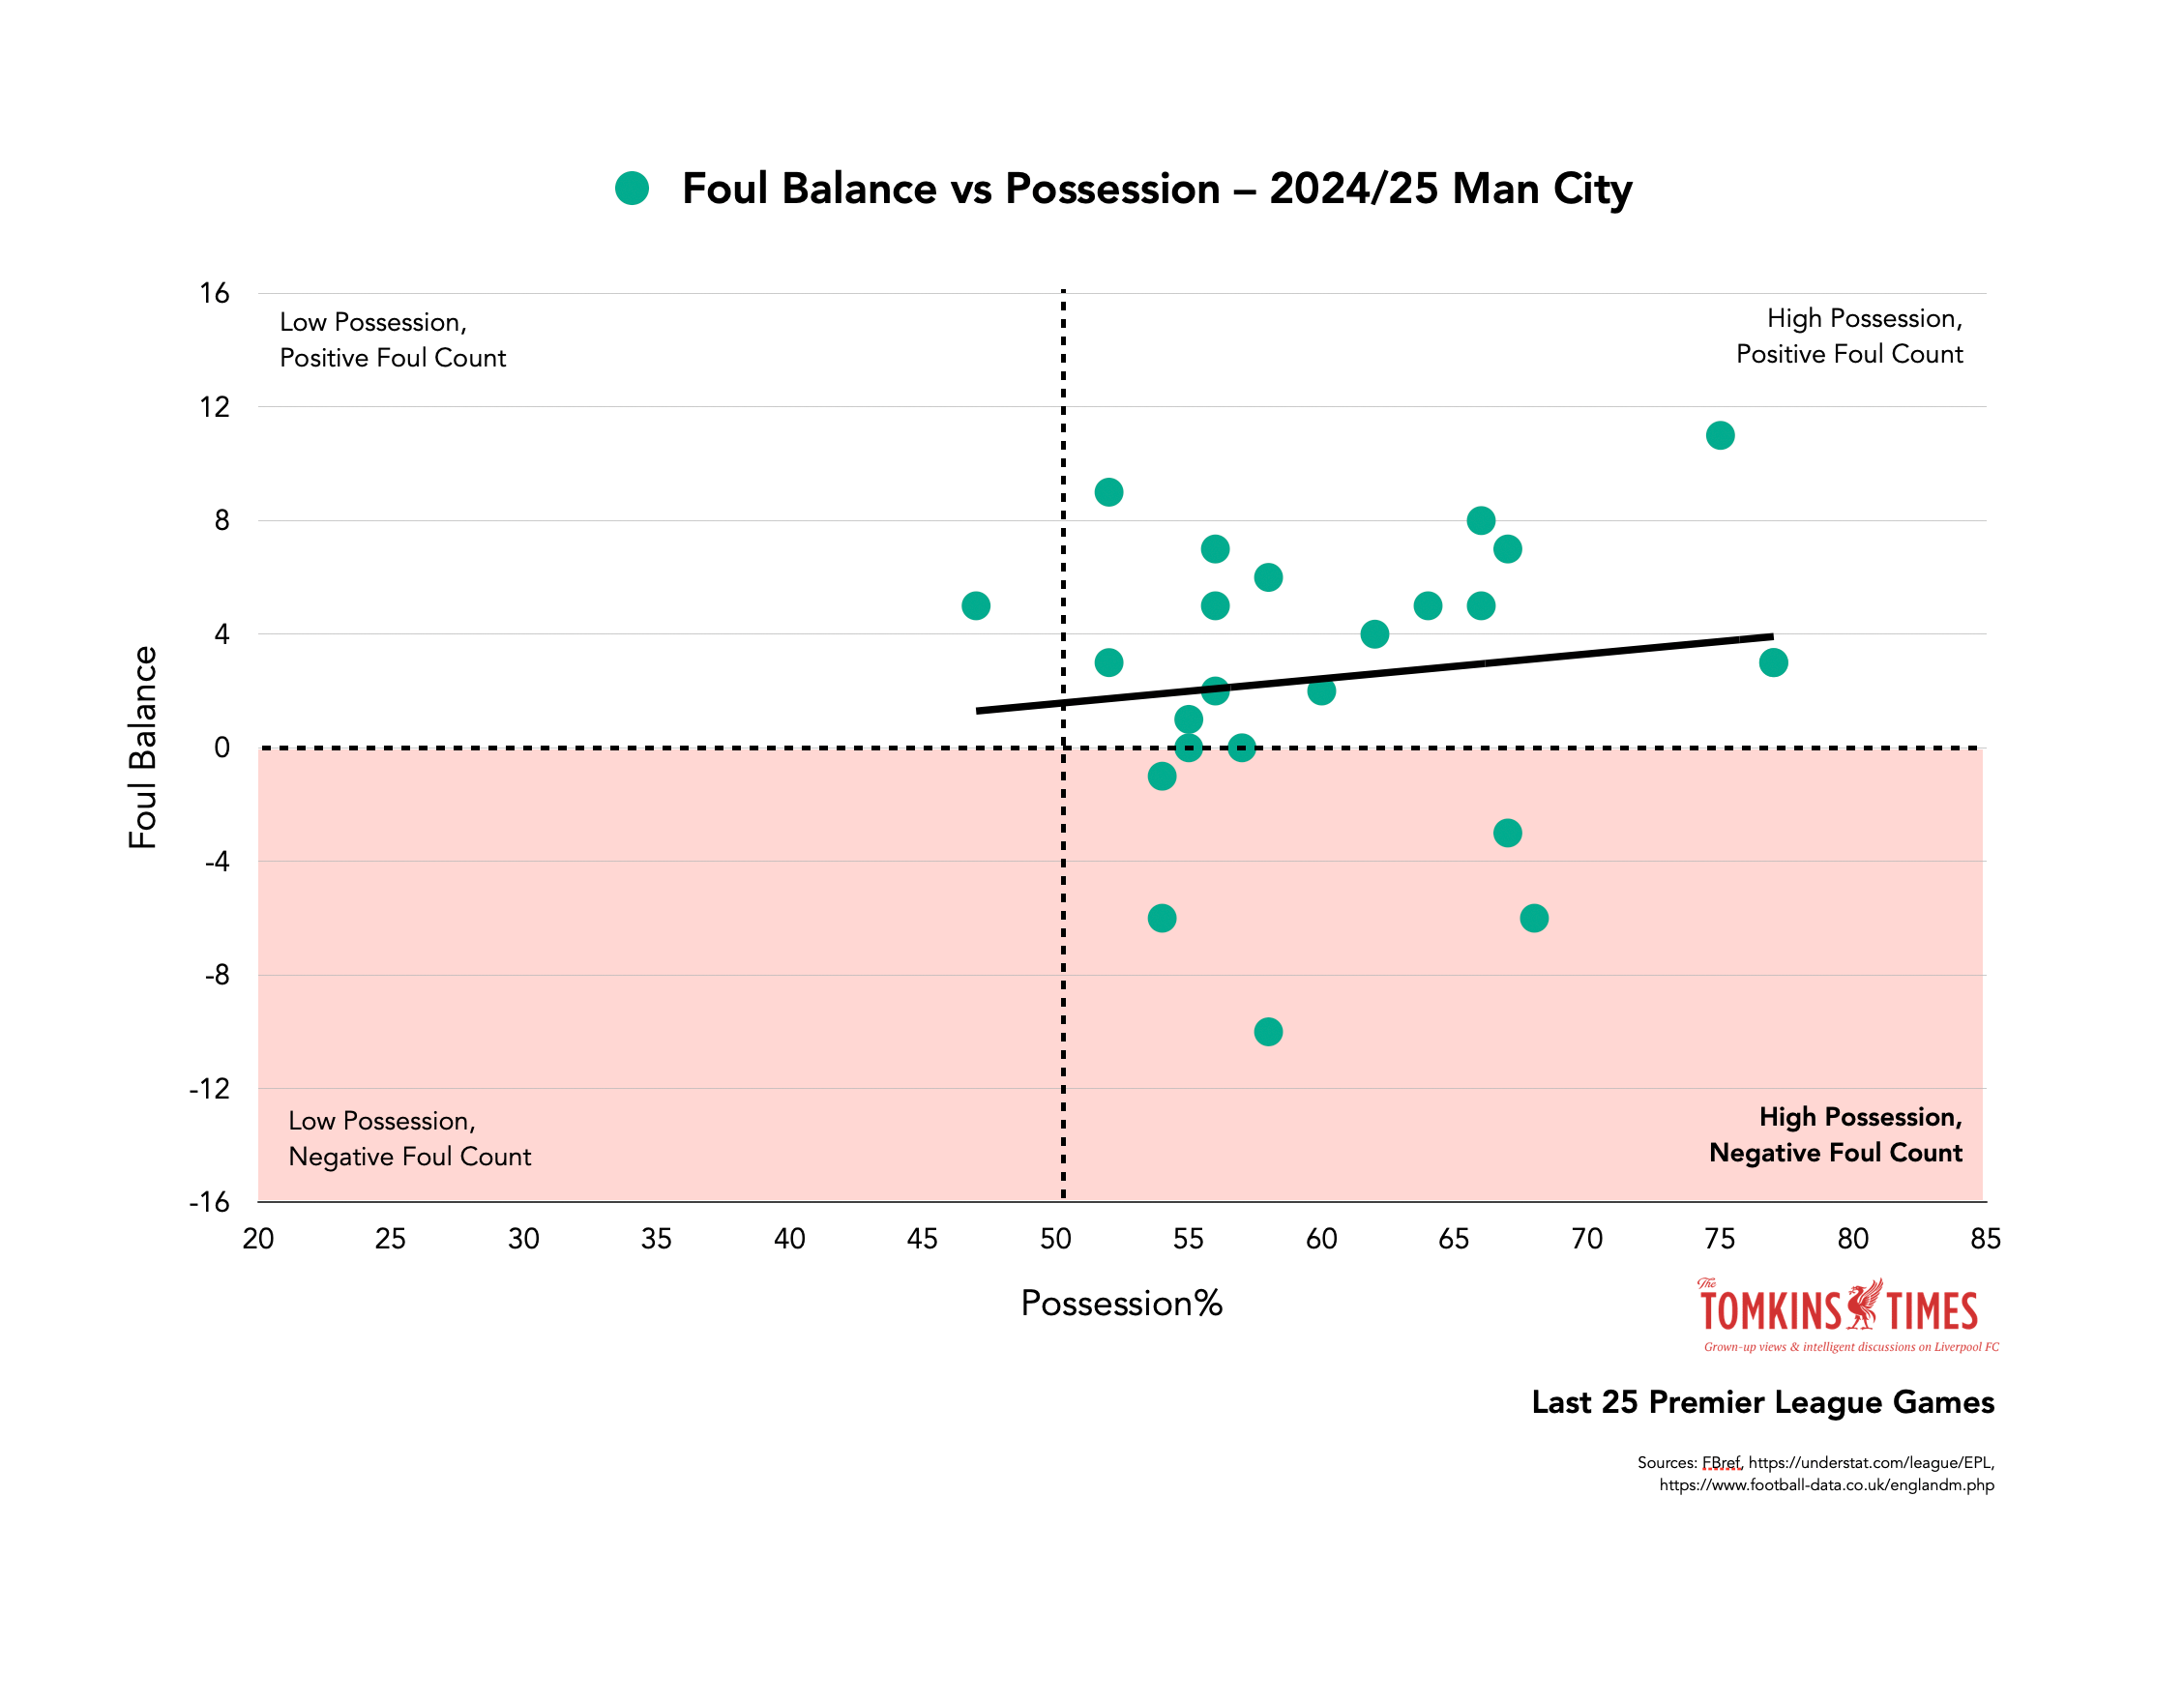


Up and to the right, up and to the right.
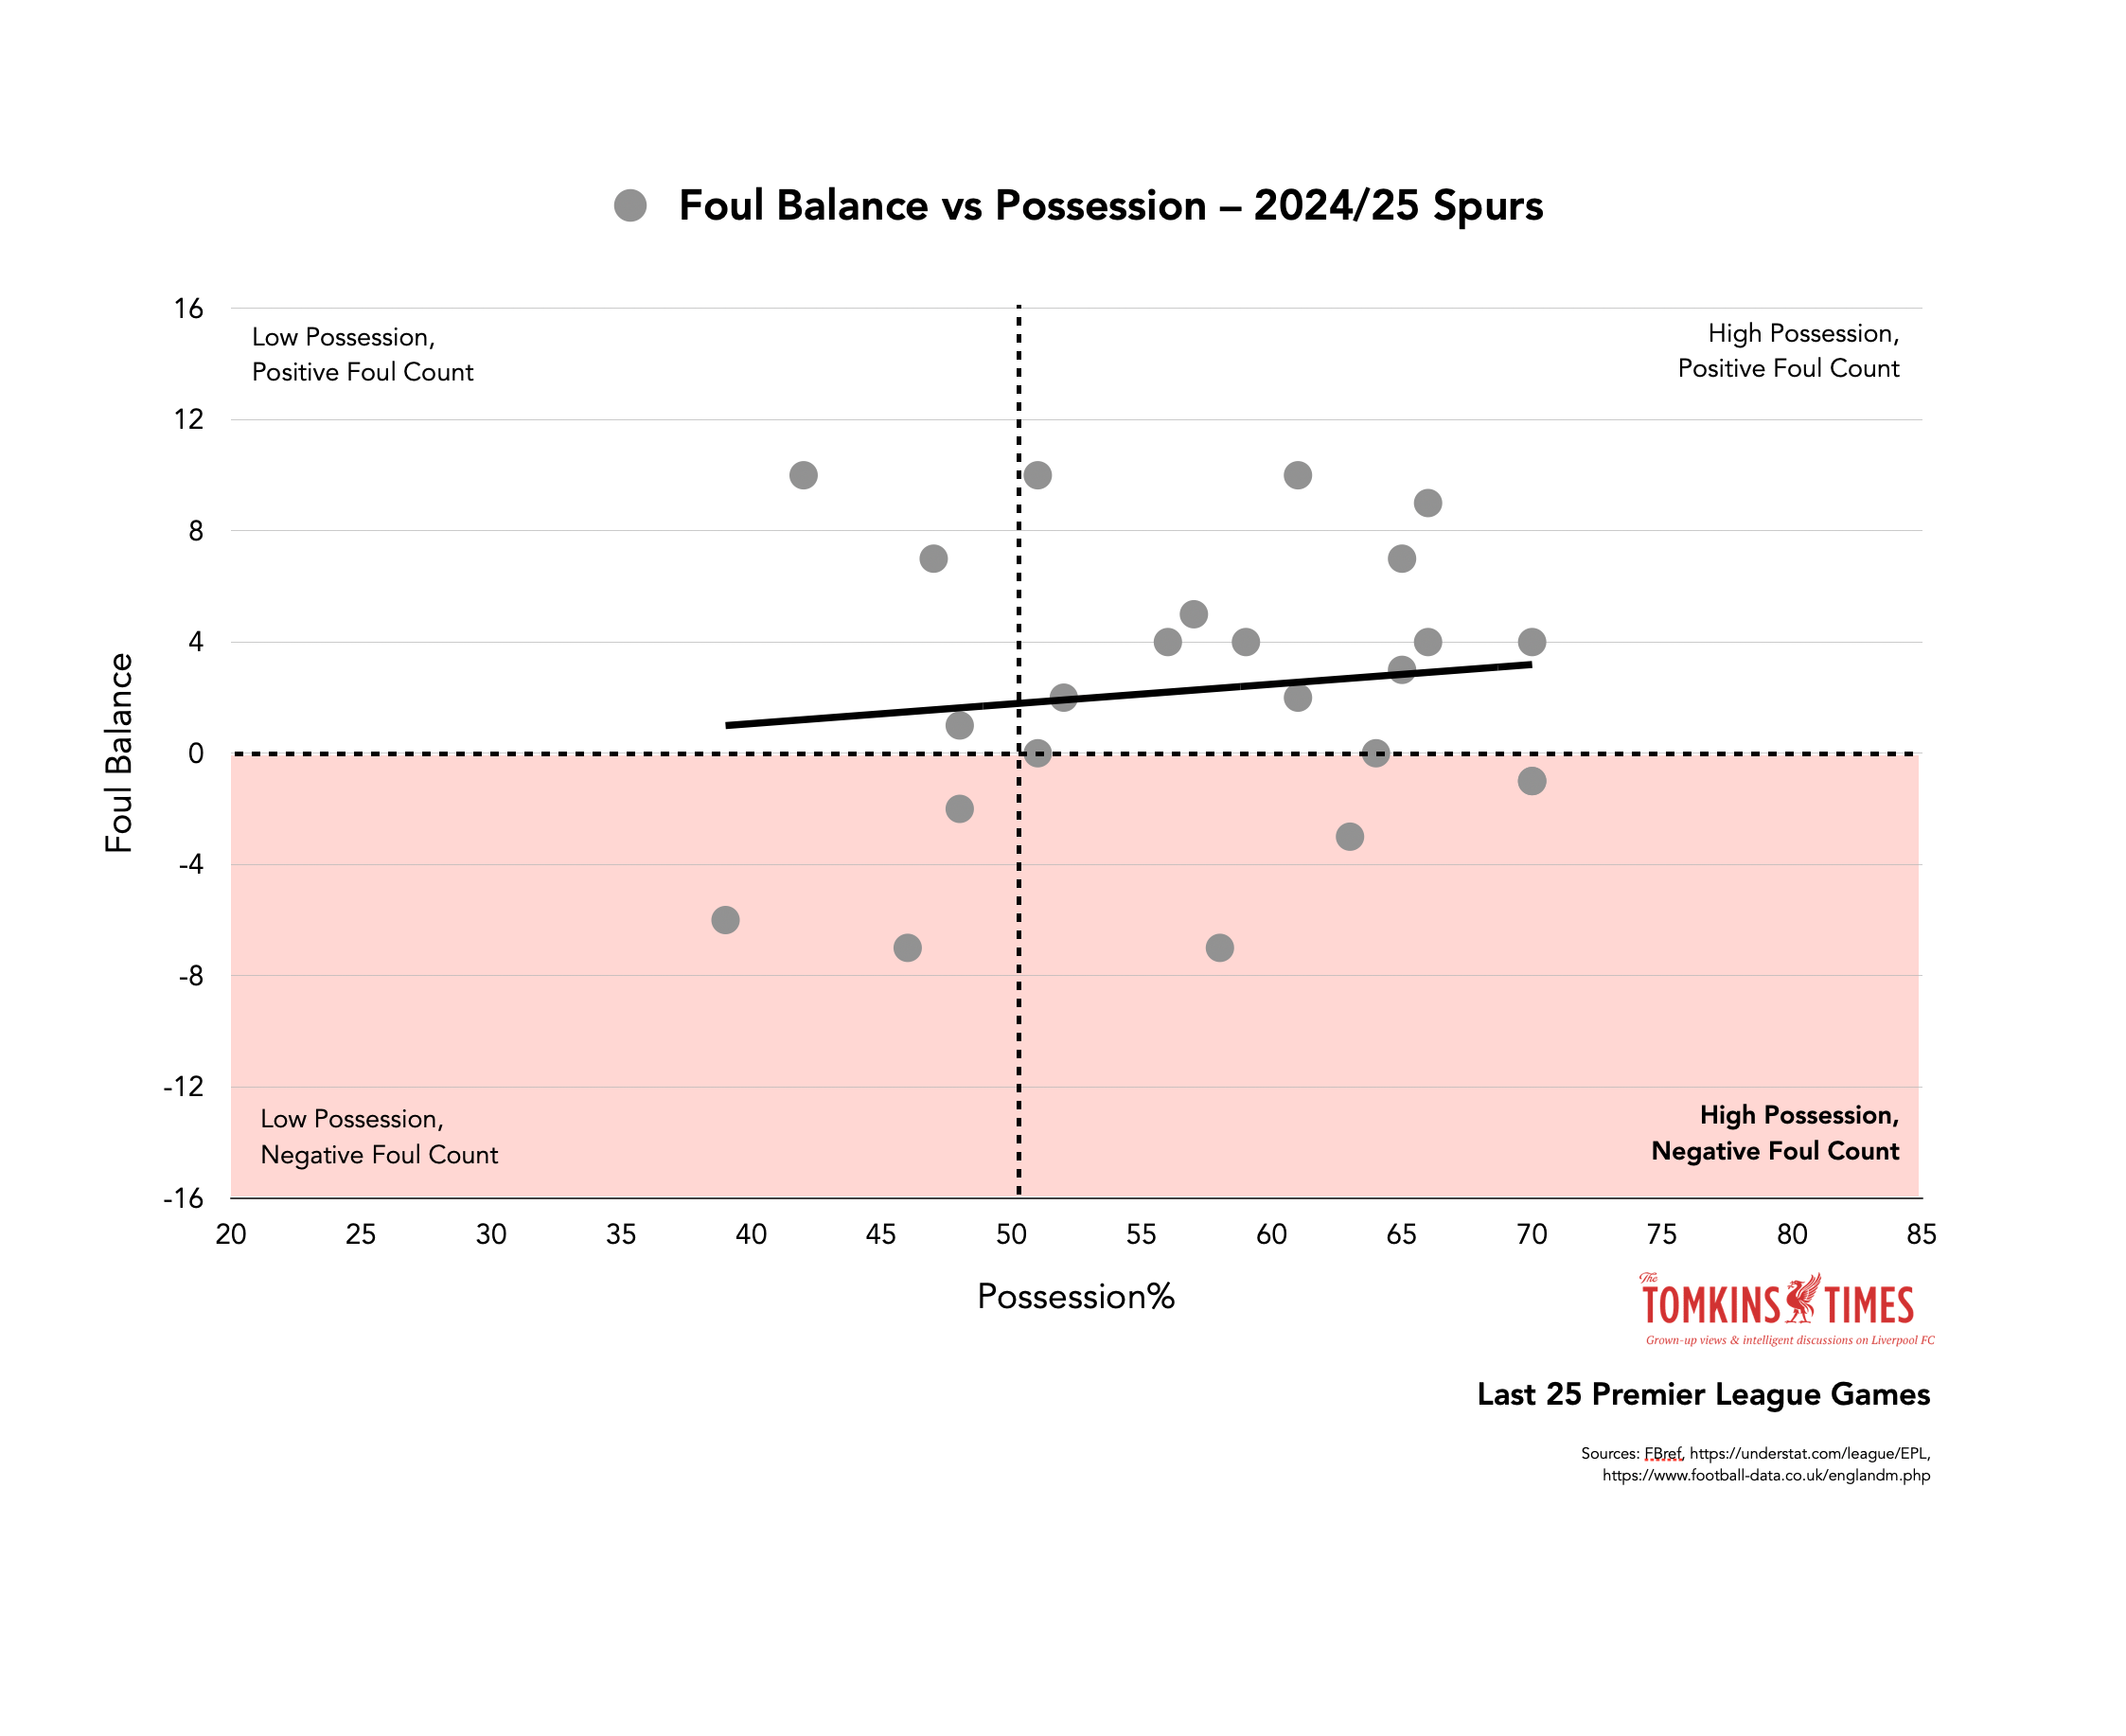
And then…

Seriously, what the actual fuck?!
Again. What the actual fuck?!
😱
(Note: please feel free to share or quote the article and graphics, albeit Twitter/X will essentially kill the links to Substack content. I deleted my account on there many months ago.)
Conclusions
I ran the data past a PhD, Mike Taylor, who agreed my methodology was sound.
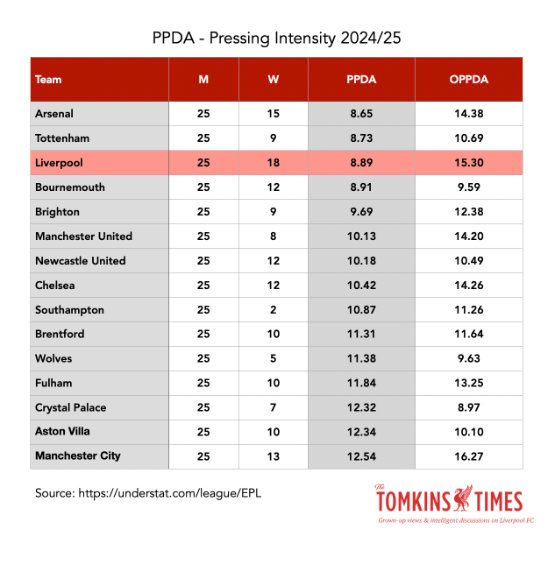
I cannot fully explain the results, but pressing intensity doesn’t seem to explain much at all, as both Spurs and Arsenal press more than Liverpool this season, based on PPDA, the pressing metric.
Equally, most teams included in the full 920 games of the study like to play quick free-kicks where possible, and want play-on where possible. A lot of potential free-kicks are not given to teams when play-on is waved.
When Liverpool have had over 57% possession in the league this season, the Foul Balance is a mind-boggling -4.64 per game. When eSports guru Michal Blicharz said I should check against European outcomes, he sent me the data.
With low possession, Liverpool are screwed by refs in Europe, often in games like Real Madrid away.
But at 57% possession or more (and with the same average of 64% as the Slot sample), the Foul Balance is only slightly negative in the Champions League since 2020 vs the Premier League this season, and thus 6.7 times less bad than in the Premier League, even though English teams are often penalised more because of the way the game is played here, including more tolerance of higher boot.

Even then, it’s not a perfect comparison given the different nature of the game and the different timescales (you can’t get a big enough sample from this season for the Reds in Europe), and that the referees are different and the opponents are different, but it’s still enlightening.
When I said, repeatedly, that refs seem to ‘hate’ Liverpool, or that someone like David Coote’s data looks suspicious, I’d expect I get a load of pushback, were I inclined to still use social media.
But with Foul Balance, you can get a lot of data per game, and that adds up to a shit-ton of data overall.
At the end of a previous, sprawling article on this I listed around 20 reasons that could contribute to this undeniable unfairness. (I wrote this one as I’d gone deeper on the data, and it’s less sprawling!)
But the more data I uncover, the worse it gets.
The Reds’ Foul Balance got worse immediately after ‘BrooksGate’, and got worse again after CooteGate. See the graph below for the rolling 7-game average, and the low-points being right after these two clashes with the PGMOL.
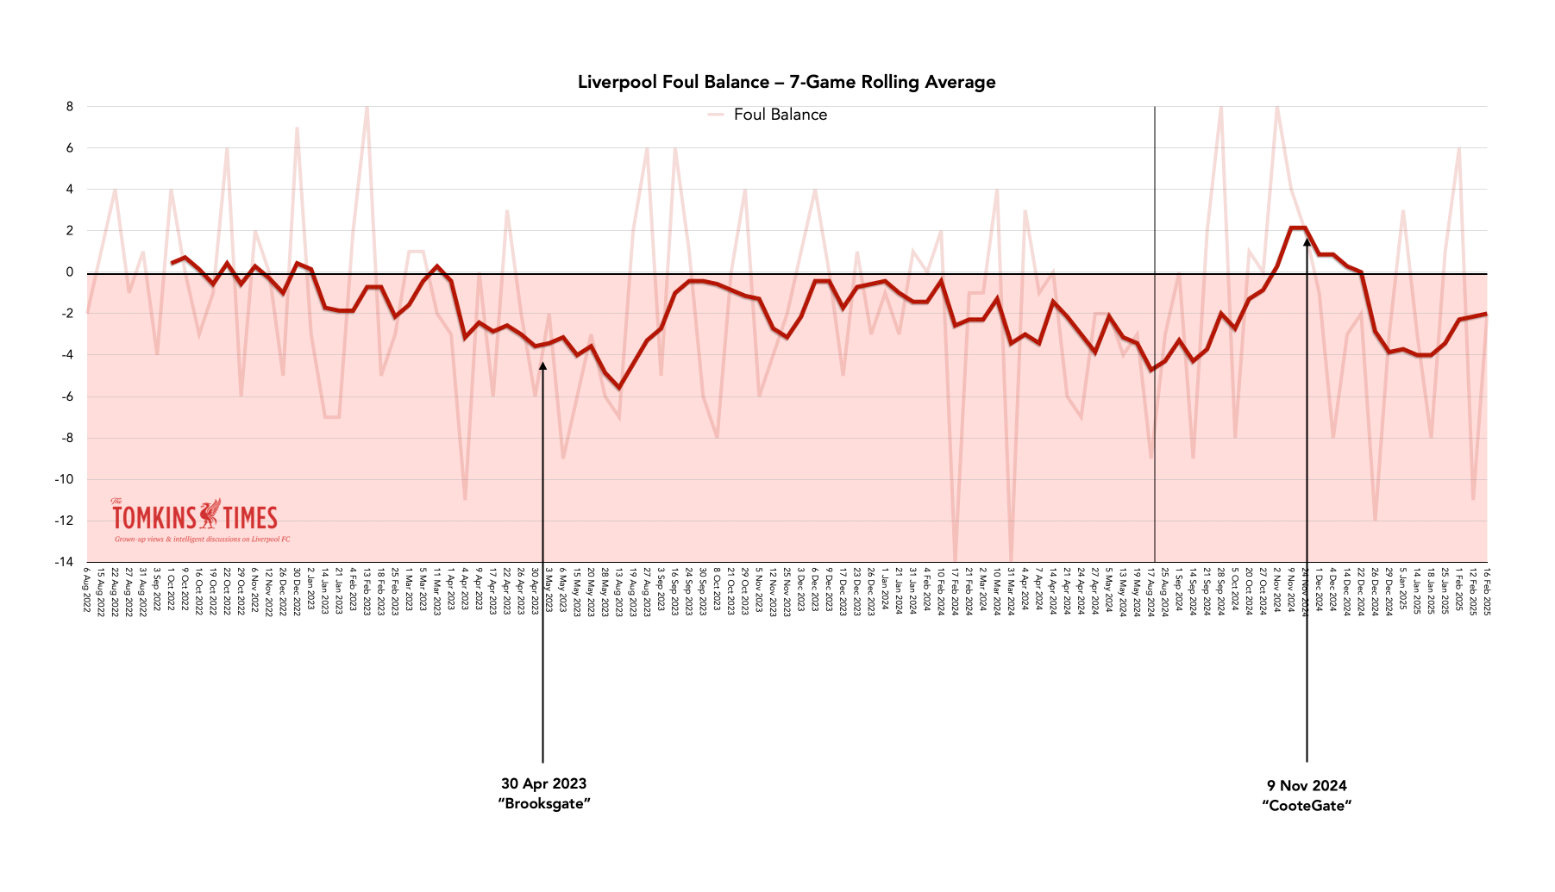
I’ll leave people to draw their own conclusions, but it just isn’t right, is it?
Indeed, until CooteGate (coinciding with Liverpool taking control of the title race), refs seemed okay with Arne Slot’s version of Liverpool.
(Coote himself was okay with the Foul Balance that day, but said Mo Salah wasn’t fouled as a DOGSO when Mo Salah was tripped, tugged and hauled over. This is also because Liverpool are never given foul DOGSOs at Anfield.)
If you don’t think the dramatic downturn in Foul Balance is linked to CooteGate, then it seems to be linked with Liverpool going clear at the top.
And the lowest point is directly after BrooksGate, when Jürgen Klopp went ballistic at the 4th official who had yet to referee a Liverpool game, and it all kicked off.
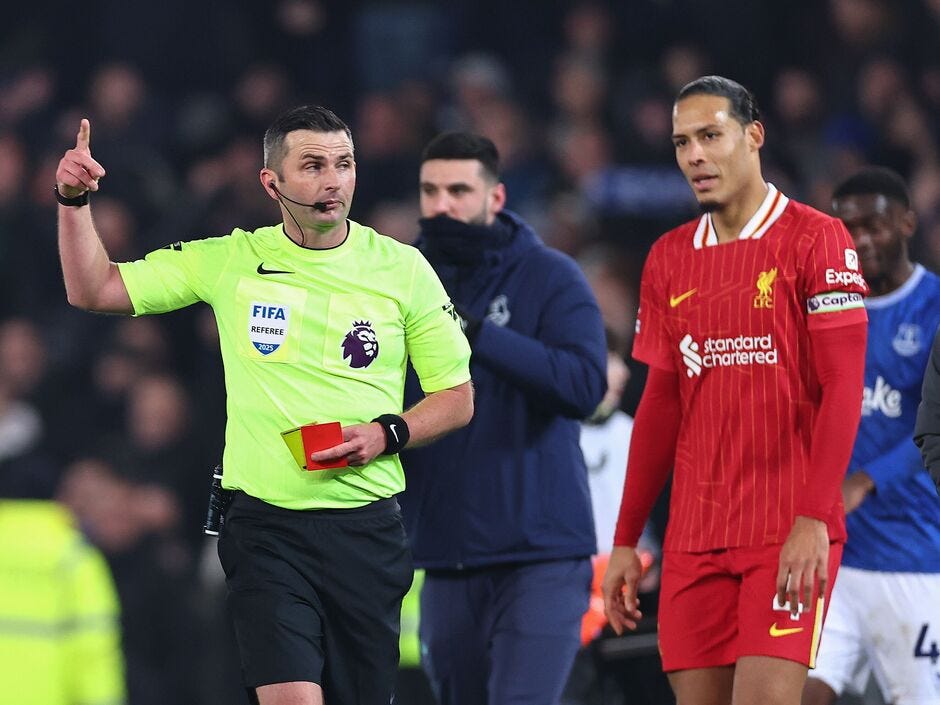
When Liverpool went to Goodison for the final time, people said it was great for Michael Oliver to “let the game flow”, but he gave Everton an outlying twenty free-kicks, at least five for clear dives where no tackle was even made. That is the opposite of letting ‘Liverpool’ flow. Twenty free-kicks is a huge number.
He gave Liverpool just nine, despite some clear ones right in front of him, including a total wipeout of Mo Salah. It was a game that he managed to suit Everton, and not suit fairness.
Ex-PGMOL chief, Hackett, gave his expert opinion to Football Insider, saying: “It is frankly difficult to understand how the award of a free kick was not the outcome of this foul challenge.”
The former PGMOL chief and ex-FIFA official exclusively told Football Insider it was “difficult to understand” why the referee had not awarded a free-kick in a dangerous area just minutes before Everton scored their equaliser.
(The same bafflement was noted when Coote didn’t send off Leon Bailey for an equally obvious foul, also on Salah. Both Coote and Oliver had great views but deliberately chose to ignore the most blatant of offences. Salah getting so few free-kicks is not new, and adds to the foul imbalance.)
You can see some incidents from the derby here:
(Not my choice of music!)
You can see how terribly this was officiated, and yet people said it was good; maybe as it suited the narrative surrounding Everton, and the league title race. (Don’t ever confuse Everton with a league title race.)
What Oliver did was stop Liverpool’s flow, and give Everton an enormous number of fouls. And it fits the pattern that I’ve uncovered, in how Liverpool are treated unfairly compared to all other clubs.
This was one of several 99th percentile negative Foul Balances Liverpool have had this season (when compared against over 2,000 games in a previous study, to find the likelihood of -11 to -14 Foul Balances. Coote gave -14 to Liverpool at home in the run-in last season, as just one example of many bizarre things he did in his three games reffing Liverpool and 13 as VAR).
Oliver had literally just had death threats from Arsenal fans for distorting the title race, so his appointment was bizarre. Oliver has been far less generous to Liverpool since his beloved Newcastle United became rivals, and since he went to Saudi to ref games for a ton of money. (These may just be coincidental.) It was an officiating shitshow.
I’ve argued for years that Liverpool are refereed differently to everyone else, and VARred differently to everyone else (only two foul penalties awarded since 2019; two foul penalties taken away this season alone. Man City and Man United have been given almost 20 foul VAR penalties combined, and as I noted before, four were by ex-Manchester FA employee Coote in his first season as a VAR).
Craig Pawson is literally the only active ref who doesn’t give Liverpool a negative Foul Balance, and even then, that’s negligible.
(But it was +2 at Villa, which again fit his reasonable refereeing of the Reds, albeit the VAR was horrific and didn’t help Pawson. Mike Dean had a marginally positive and logical ratio, but gave more Big Decisions against the Reds. He also didn’t do Liverpool very often.)
The Reds have done well on penalties this season for a change, but since BrooksGate the red cards received has gone through the roof. There were four against Liverpool players in the next dozen or so games, including two at Spurs where Luis Díaz’s goal was also ignored. Brooks himself sent off Virgil van Dijk, but didn’t send off Tyrone Mings, both in the next few games. It felt like Brooks was having his revenge.
The one for Andy Robertson this season was earlier than any Liverpool opponent has been sent off, and was incorrect, as it was 100% a foul but not a DOGSO, so Arsenal aren’t the only one with gripes about bad red cards. (VAR? Stuart Attwell. Attwell also didn’t see the Doku karate kick on Mac Allister as a foul, and Michael Oliver ran away, to hand the title to Man City. Again, who is the VAR for Liverpool’s trip to Man City? It’s laughable.)
Liverpool were 1-0 down, and ended up playing 90 actual minutes to draw 2-2 when outplaying 11-man Fulham. They should have had a penalty and Fulham should have had a red card. Again, Attwell had temporary blindness as the VAR, as he always does.
While I won’t go too deeply in the other officiating patterns, I’ll point out that unless it’s an empty stadia (in 2020/21), Liverpool also haven’t been given a penalty before the 15th minute in over a dozen years (in contrast to other clubs), nor any subjective VAR overturns before the 27th minute, again in contrast to others.
There is a zone of non-interference, of ‘I didn’t see anything’, that lasts 15-30 minutes. Refs admit they don’t like giving decisions too early in games, but it’s Liverpool who suffer most. (Maybe it’s partly because the backlash were they to give anything to Liverpool will be too huge?)
When listed via time/minute in the match, there are 50-60 earlier examples of subjective VAR overturns before Liverpool get their first, and it’s similar with penalties. Liverpool do well with offsides when the VAR has its lines straight.
Again, it’s all in the data, such as opposition players never getting a second yellow since 2016, apart from 2023; and one of those was in the last minute of added time. One was given in the Everton game to Abdoulaye Doucouré, but after the game, along with Curtis Jones, and a red card to both Slot and his assistant.
Liverpool also had a terrible record with winning penalties once Brendan Rodgers left, in relation to attacking output, but that’s more normal this season. (I still think the challenge on Diogo Jota vs Wolves was reckless, and he had to dive out the way from what was a foul lunge, where the defender went in so hard he hurt himself; but the Curtis Jones one against Chelsea was not a foul. Again, look at what was done to Mo Salah at Forest by two players in the box, and how the VAR didn’t intervene for a blatant double-foul.)
To me, games appear to be managed to stop Liverpool’s flow, and give soft free-kicks to the opposition to allow them to disrupt the game and have set-piece opportunities.
That was what the eye-test said, and also looks undeniable in the data. Up and to the right. (Except for Liverpool.)
Given more than a tiny sample size, possession should improve your Foul Balance, to a certainty of 99.9%.
Except for Liverpool.
* Sample of all Premier League games since 2022 for the following nine clubs: Newcastle Utd, Man City, Spurs, Aston Villa, Arsenal, Brighton, Chelsea, Bournemouth and Man Utd. (August 2022-December 2024, 920 Games.) Then, for individual teams, the data was updated to include up to MW25 of 2024/25. Data is taken directly from sources listed.
This is a free read, as I want people to share the information, but comments and many other articles are for paying TTT Main Hub subscribers only. Paying to subscribe will also help fund my time in a psychiatric hospital and a padded cell, which is probably imminent, as I randomly shout ‘up and to the right’ at strangers.
Keep reading with a 7-day free trial
Subscribe to The Tomkins Times - Main Hub to keep reading this post and get 7 days of free access to the full post archives.